The classical 4x2km/5min rest workout has been problematic for me. The last time I did it, on August 31, I managed 1:54.3 with an average heart rate of 164bpm.
There was also a workout in the fall of 2015 which was done after a similar day as today. A bike ride to work in the morning, a long day at work, and then sit down to do a 4x2km.
So, today I set off at a conservative 1:54 target pace. Here is the comparison chart. Today is the blue line, August 31 is the red line:
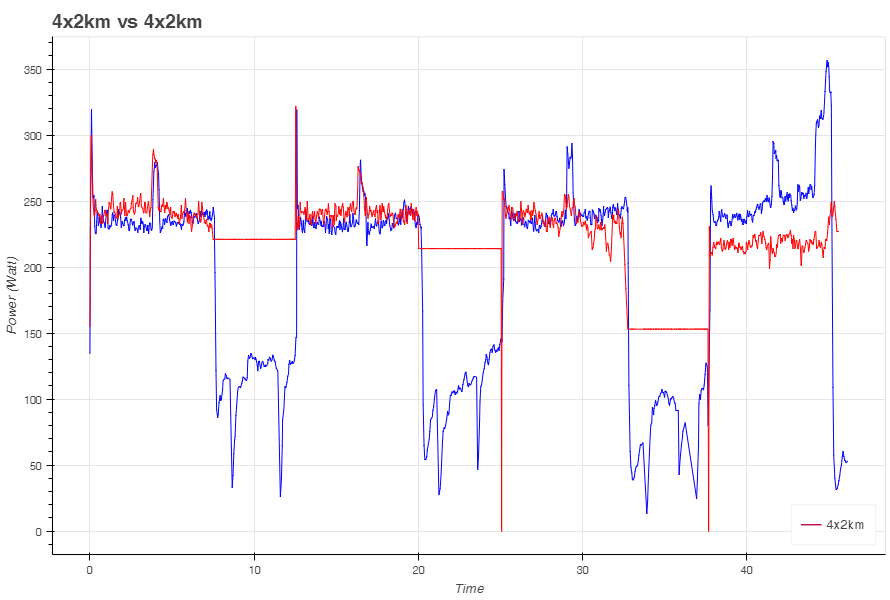
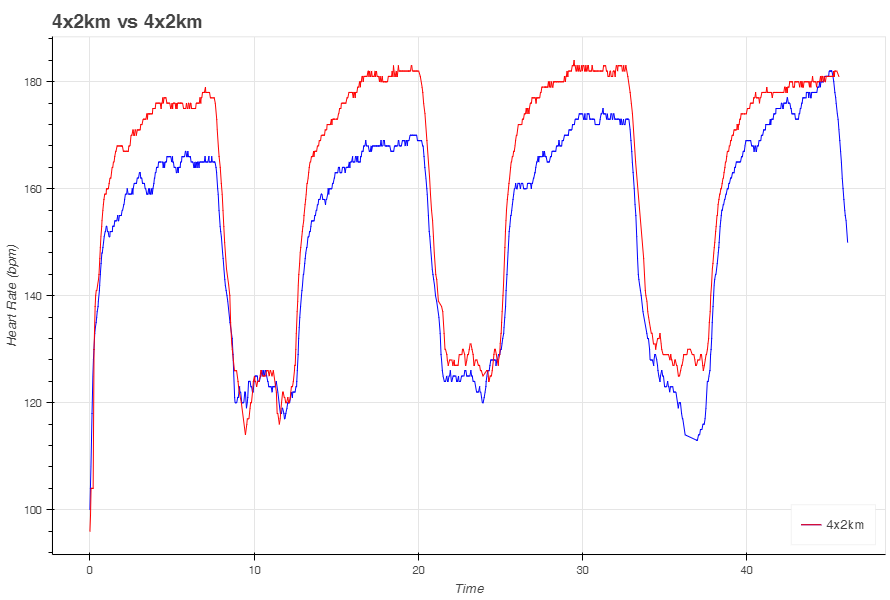
A huge difference in heart rate. Here are today’s stats:
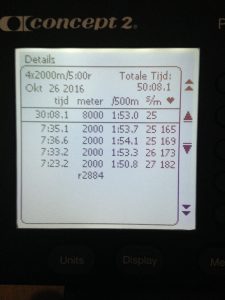
Workout Summary - media/20161026-191009o.csv

--|Total|-Total-|--Avg--|Avg-|-Avg-|-Max-|-Avg

--|Dist-|-Time--|-Pace--|SPM-|-HR--|-HR--|-DPS

--|10867|46:07.0|02:07.4|24.9|155.4|182.0|09.5

W-|08000|30:08.0|01:52.9|25.8|164.3|182.0|10.3

R-|02866|16:00.0|02:47.5|22.3|142.6|182.0|06.8

Workout Details

#-|SDist|-Split-|-SPace-|SPM-|AvgHR|MaxHR|DPS-

01|02000|07:35.1|01:53.7|25.3|158.1|167.0|10.4

02|02000|07:36.6|01:54.1|25.2|162.5|170.0|10.4

03|02000|07:33.2|01:53.3|25.8|167.4|175.0|10.3

04|02000|07:23.2|01:50.7|27.0|169.4|182.0|10.0
Just for fun, I created a few other plots:
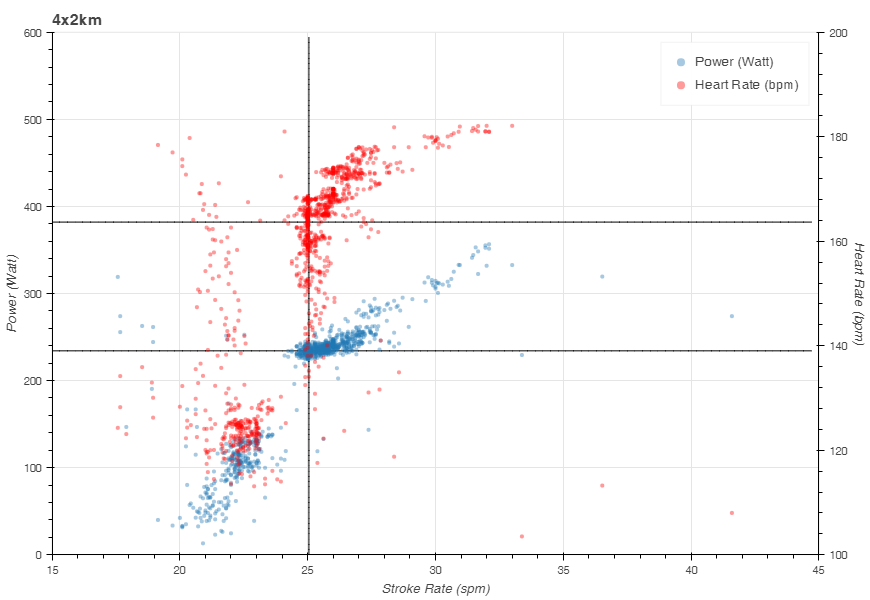
Power and heart rate vs stroke rate. The stroke clouds around 21spm is from the rest periods.
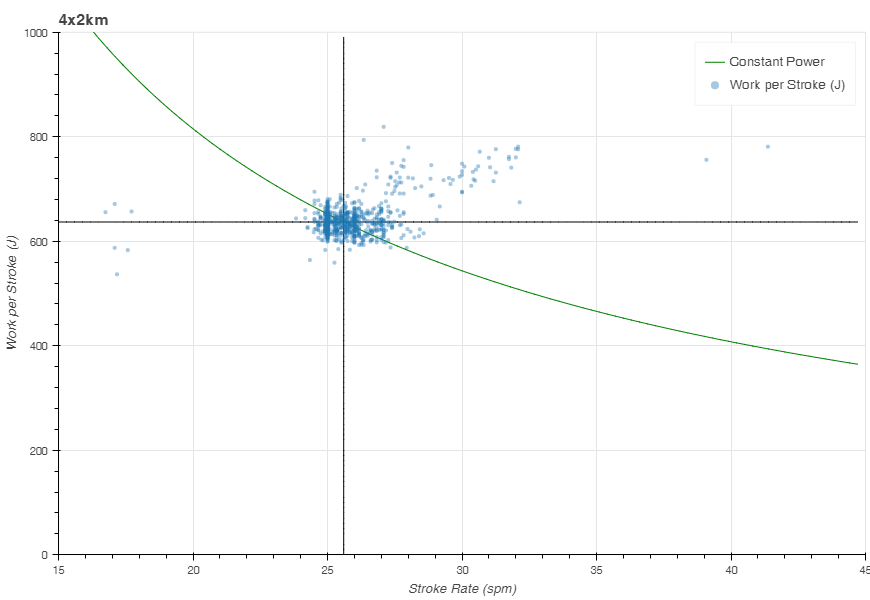
This next plot is work per stroke vs SPM. This time I have removed the strokes taken during the rest periods. You can see my usual 640J per stroke. Only the strokes from the final 300m of the last interval are significantly higher. Let’s say I was “driving home”. I was wondering if the work per stroke came from a longer stroke length or a more forceful stroke:
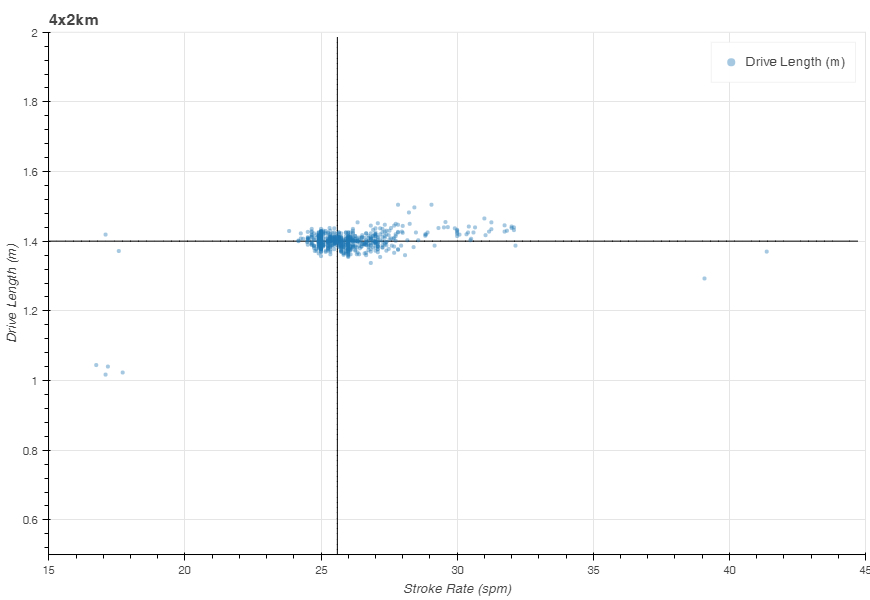
Looks like it’s both. A bit of drive length and a bit of force. Driving home. I was glad this workout worked out.
Follow me in social media
Like this:
Like Loading...
Oct 26 2016
4x2km – threshold workout
The classical 4x2km/5min rest workout has been problematic for me. The last time I did it, on August 31, I managed 1:54.3 with an average heart rate of 164bpm.
There was also a workout in the fall of 2015 which was done after a similar day as today. A bike ride to work in the morning, a long day at work, and then sit down to do a 4x2km.
So, today I set off at a conservative 1:54 target pace. Here is the comparison chart. Today is the blue line, August 31 is the red line:
A huge difference in heart rate. Here are today’s stats:
Workout Summary - media/20161026-191009o.csv
--|Total|-Total-|--Avg--|Avg-|-Avg-|-Max-|-Avg
--|Dist-|-Time--|-Pace--|SPM-|-HR--|-HR--|-DPS
--|10867|46:07.0|02:07.4|24.9|155.4|182.0|09.5
W-|08000|30:08.0|01:52.9|25.8|164.3|182.0|10.3
R-|02866|16:00.0|02:47.5|22.3|142.6|182.0|06.8
Workout Details
#-|SDist|-Split-|-SPace-|SPM-|AvgHR|MaxHR|DPS-
01|02000|07:35.1|01:53.7|25.3|158.1|167.0|10.4
02|02000|07:36.6|01:54.1|25.2|162.5|170.0|10.4
03|02000|07:33.2|01:53.3|25.8|167.4|175.0|10.3
04|02000|07:23.2|01:50.7|27.0|169.4|182.0|10.0
Just for fun, I created a few other plots:
Power and heart rate vs stroke rate. The stroke clouds around 21spm is from the rest periods.
This next plot is work per stroke vs SPM. This time I have removed the strokes taken during the rest periods. You can see my usual 640J per stroke. Only the strokes from the final 300m of the last interval are significantly higher. Let’s say I was “driving home”. I was wondering if the work per stroke came from a longer stroke length or a more forceful stroke:
Looks like it’s both. A bit of drive length and a bit of force. Driving home. I was glad this workout worked out.

Follow me in social mediaShare this:
Like this:
By sanderroosendaal • Uncategorized • 2 • Tags: 4x2km, concept2, erg, OTE, rowing, training