Jan 10 2017
January CTC: 4x4min/4min rest
I have taken it easy last week, even though it was supposed to be a hard week. Too much sniffing and sneezing going on to do any hard workouts.
So, today was the first real hard workout in ages. I chose to do the CTC. It is somewhere in between the shorter stuff I have been doing before Christmas and the “long intervals” that I am supposed to do in this mesocycle of my training plan.
Row 4 times 4 minutes with 4 minutes rest between reps
Use the same damper setting for all reps.
Record your distance for the sixteen minutes of rowing.
Don’t include any resting metres.
The first 4 minutes must be a standing start. All others can be standing or rolling starts.
In the 2k warming up I did a few 10 stroke sprints at slightly faster paces than I normally do them. Then I set up the 4x4min.
I was warned that it would be a tough workout, so I set myself a target to row 28spm and higher, a “light” stroke and watch stroke length and technique.
Every interval was the almost same, except that they got slightly harder each time. The first minute flew by and I would have thoughts of doing a fast interval at 1:46. The second minute was slightly harder. The third minute was endless and I was struggling to keep 1:48. The light at the end of the tunnel got me through the fourth minute.
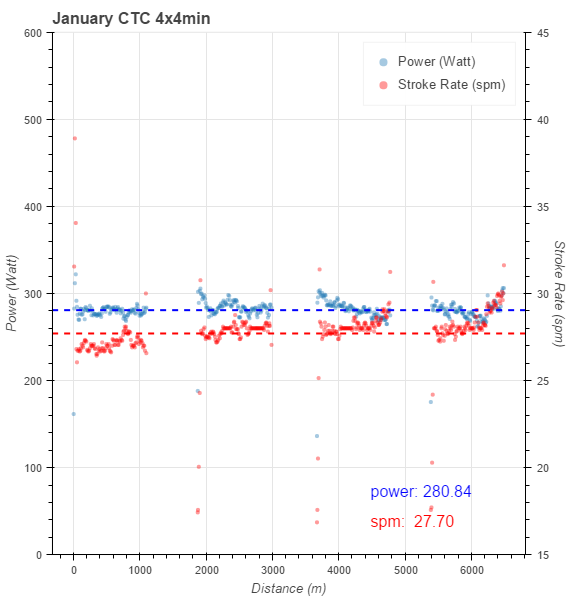
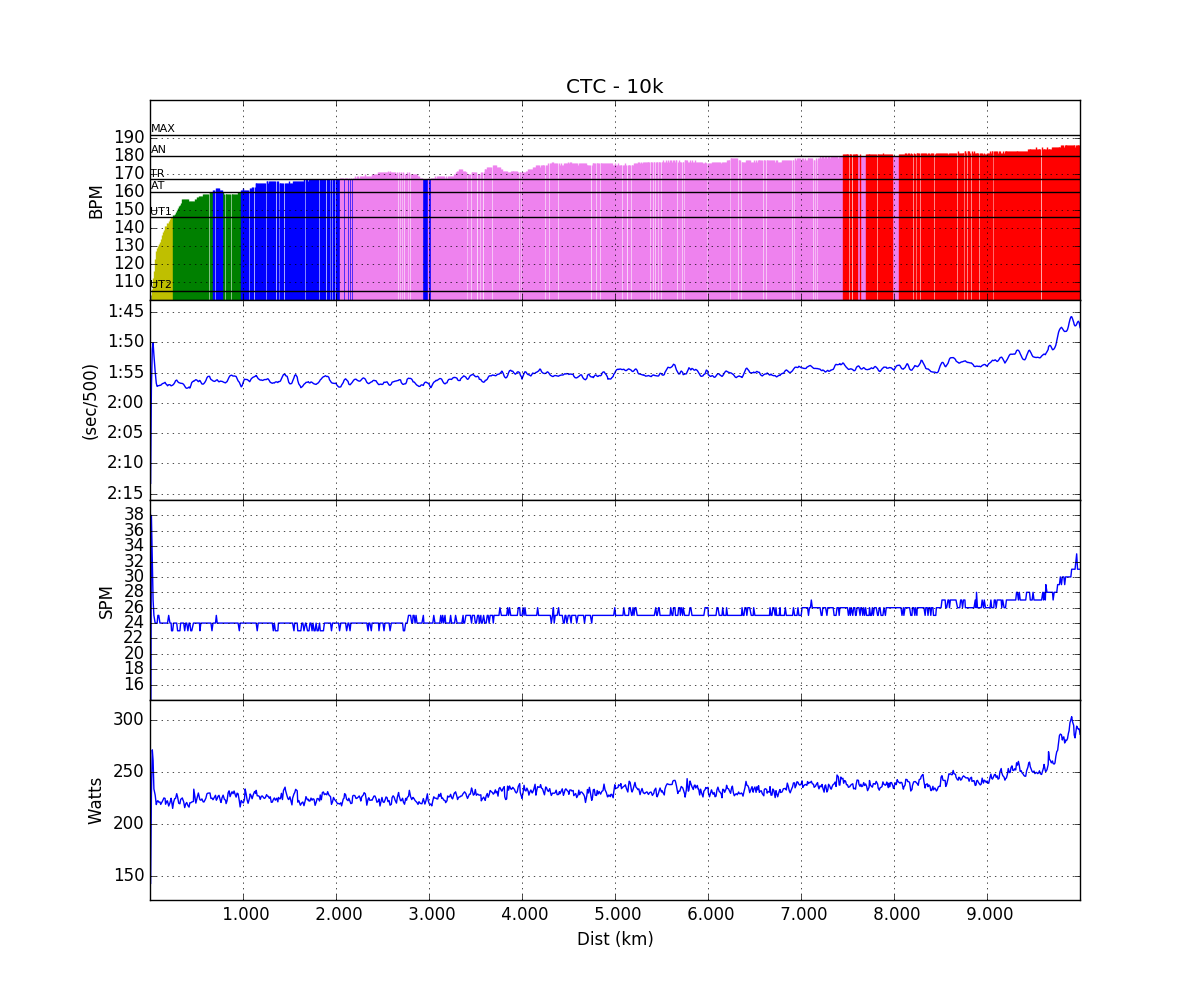
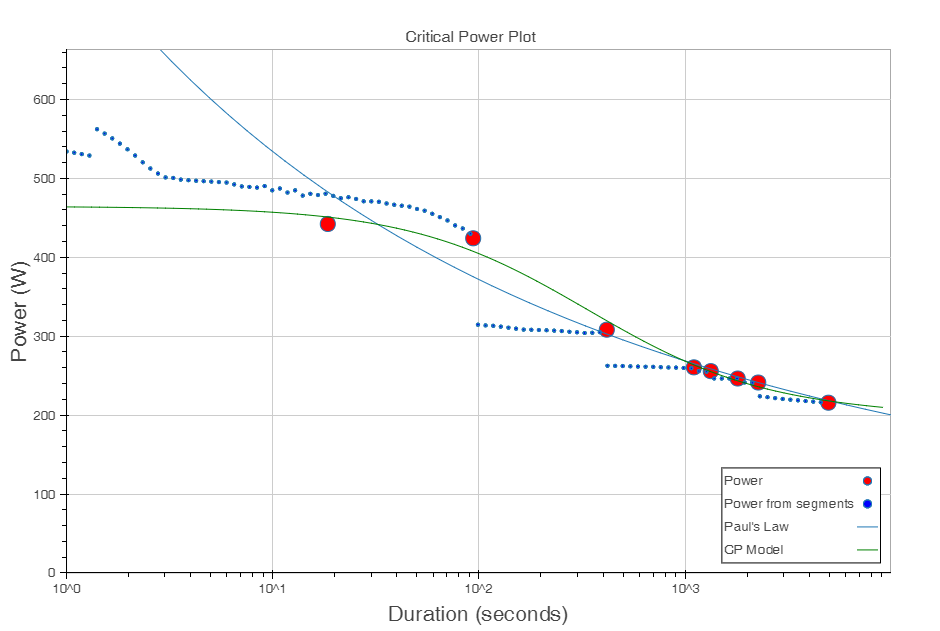
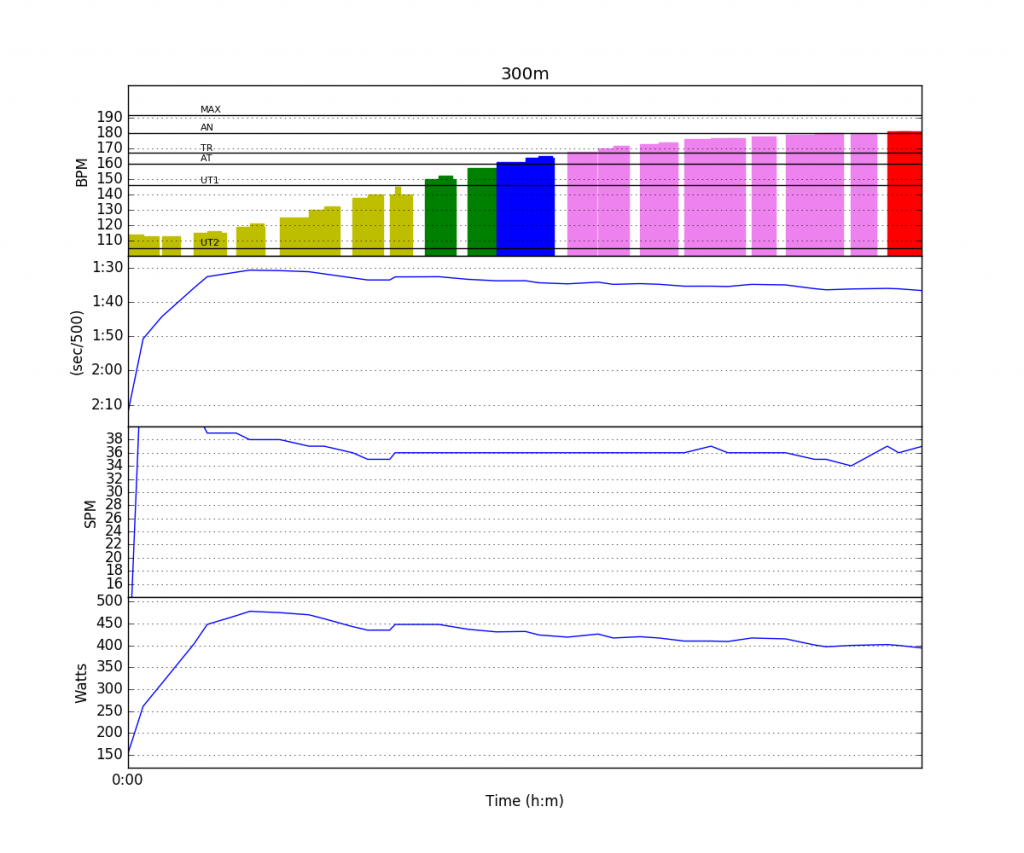
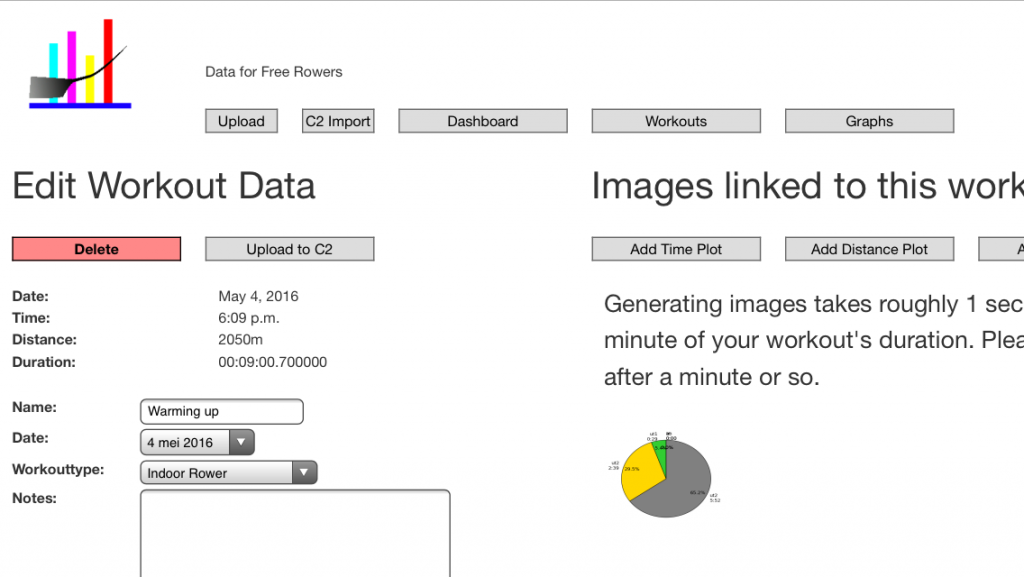
Today, the graphs from Rowsandall.com are very interesting. First, the summary plot:
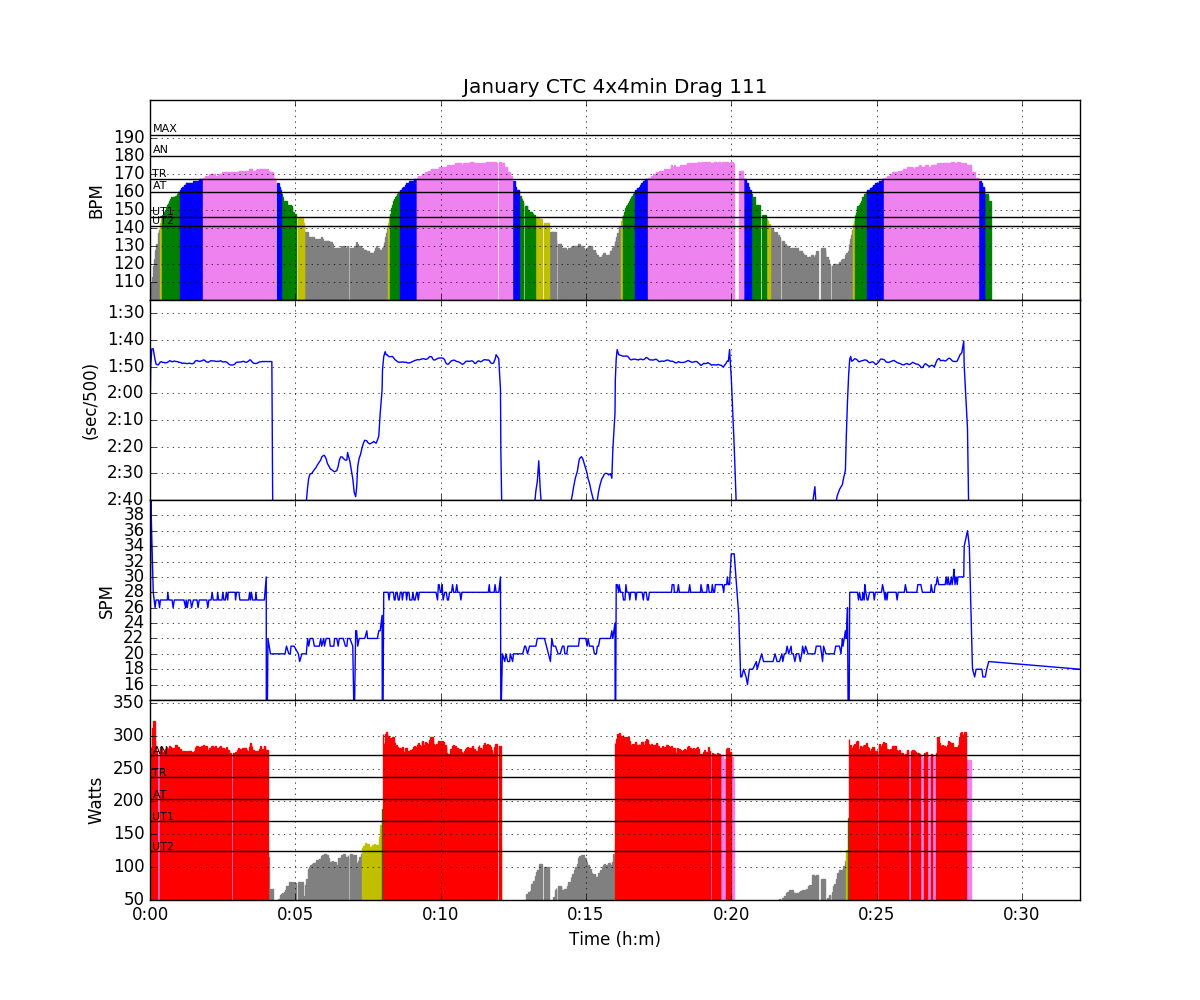
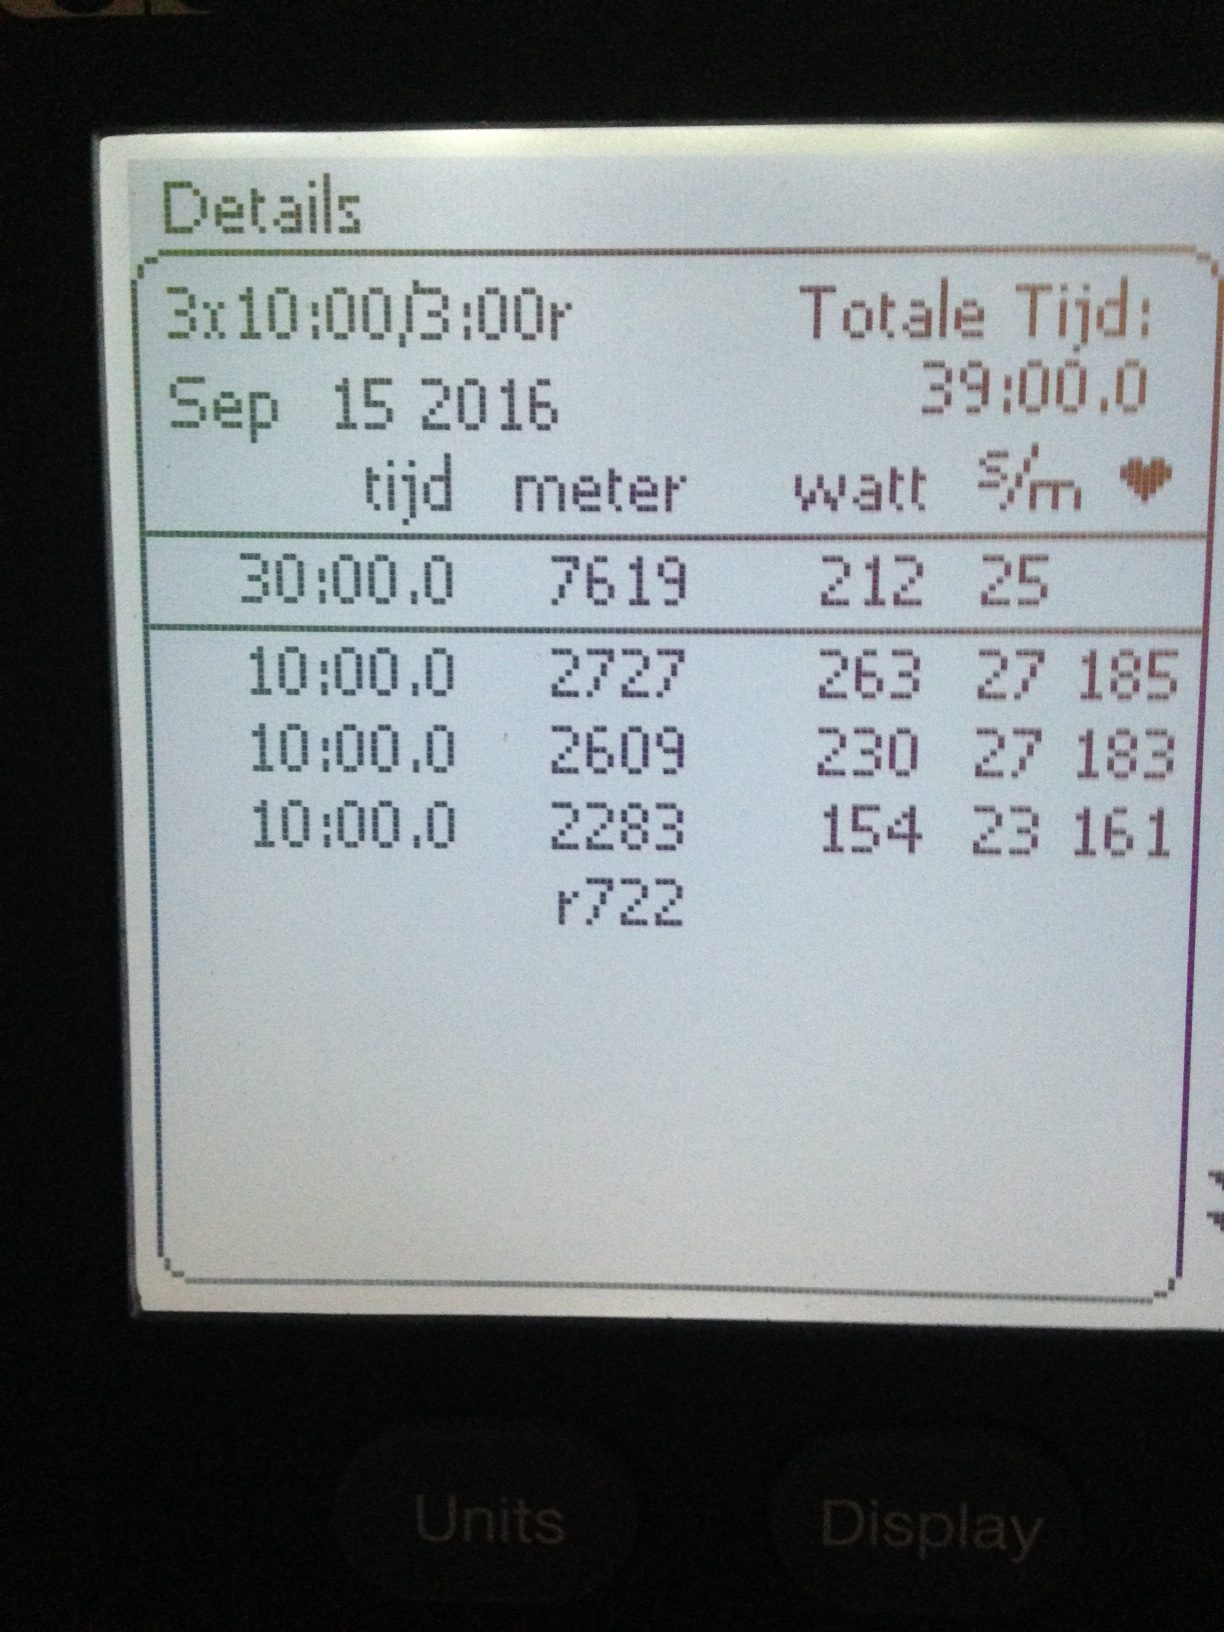
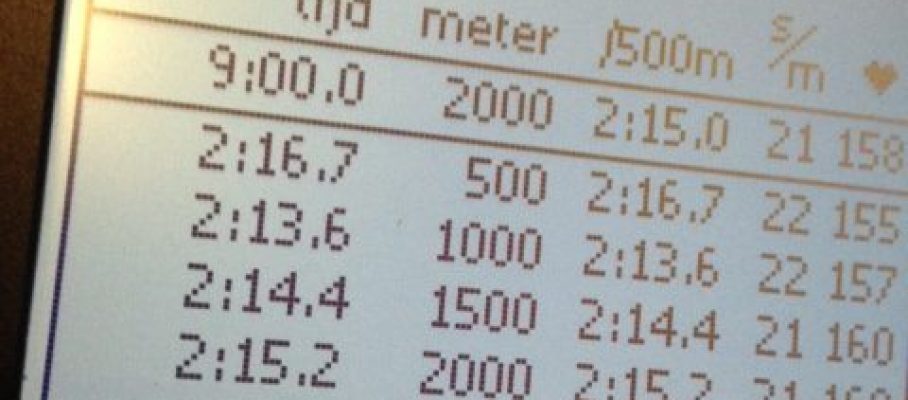
and the summary:
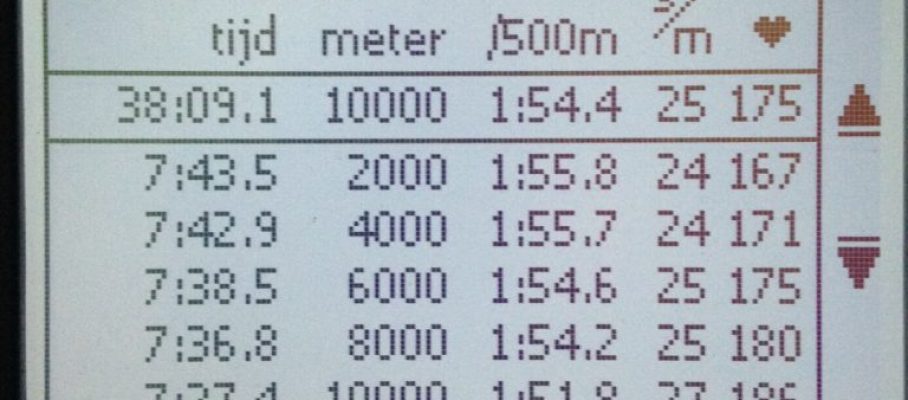
Workout Summary - media/20170110-195135-sled_2017-01-10T19-42-09ZGMT+1.strokes.csv
--|Total|-Total-|--Avg--|-Avg-|Avg-|-Avg-|-Max-|-Avg
--|Dist-|-Time--|-Pace--|-Pwr-|SPM-|-HR--|-HR--|-DPS
--|06613|32:00.0|02:25.2|212.1|25.3|158.0|177.0|08.2
W-|04466|16:00.0|01:47.5|281.5|27.8|167.5|177.0|10.1
R-|02149|16:00.0|03:43.4|074.1|20.7|144.9|177.0|01.3
Workout Details
#-|SDist|-Split-|-SPace-|-Pwr-|SPM-|AvgHR|MaxHR|DPS-
00|01114|04:00.0|01:47.7|279.0|27.1|162.9|173.0|10.3
01|01120|04:00.0|01:47.1|284.4|27.9|169.5|177.0|10.0
02|01117|04:00.0|01:47.4|282.3|28.0|169.1|177.0|10.0
03|01115|04:00.0|01:47.6|280.4|28.1|168.5|177.0|09.9
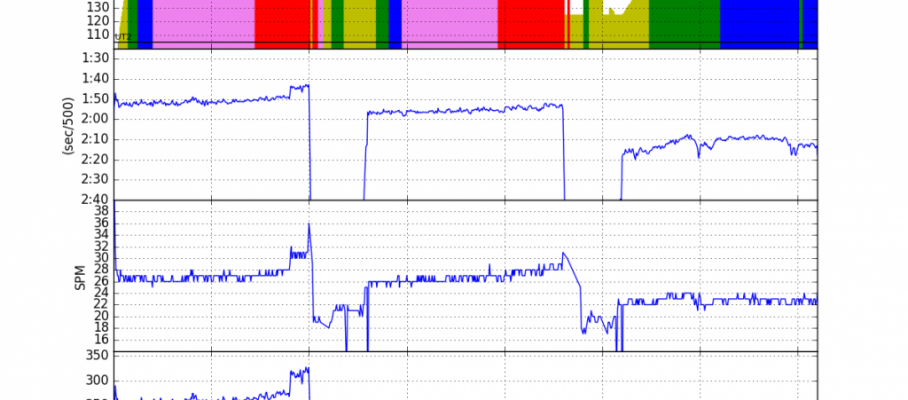
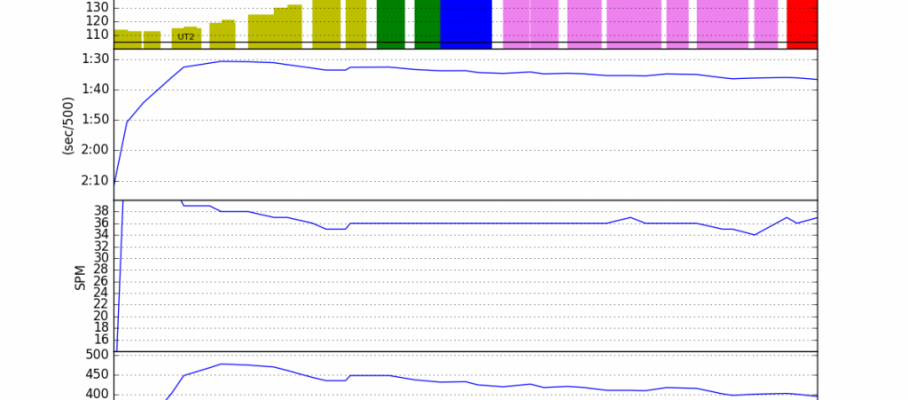
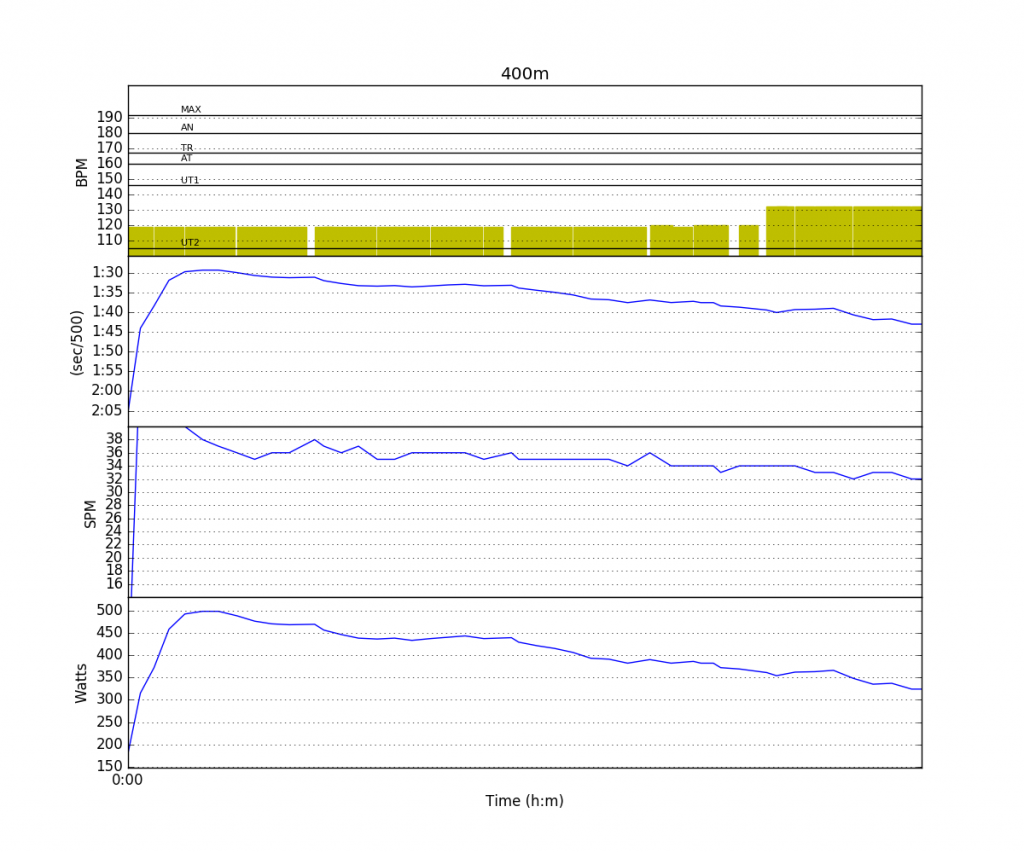
And here are the interesting plots:
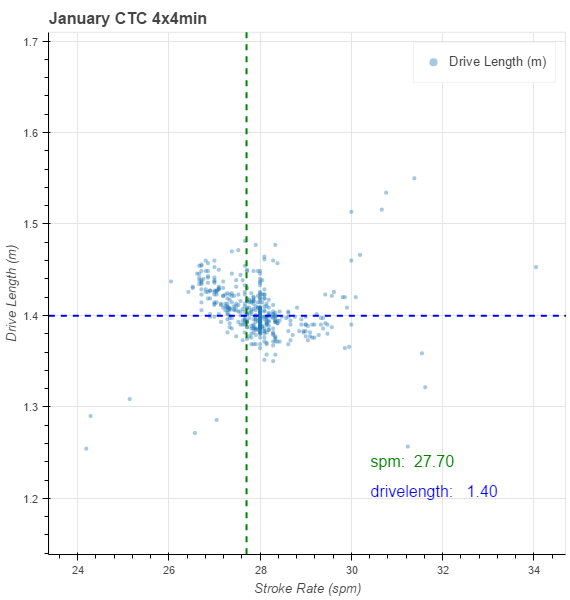
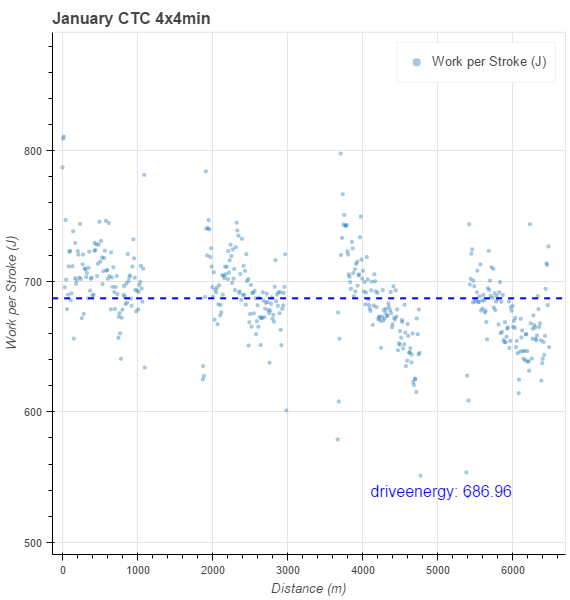
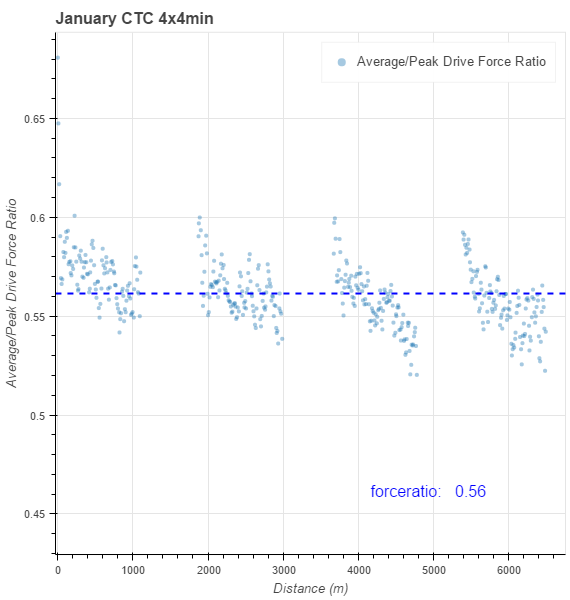
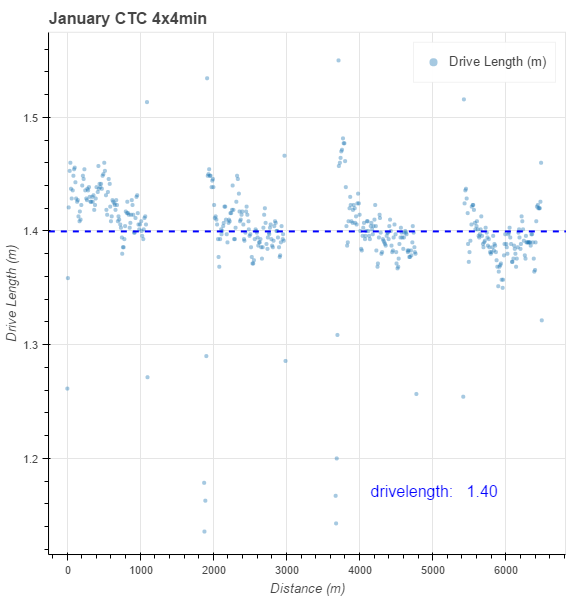

There is a lot of things going on here (at least in my perception).
- I am clearly trading stroke length for stroke rate. I should focus on staying long when I get tired.
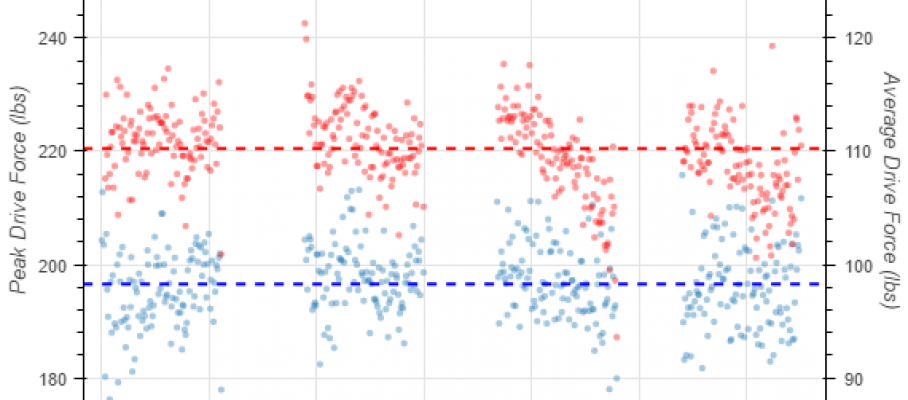
- In the beginning of the row, I was focusing on technique, especially on a couple of the weak points that I discovered in the video analysis. This leads to a slightly higher Average to Peak force ratio. In the second half of each 4 minute interval, and more so in the 3rd and fourth intervals, I just focus on surviving and my technique flaws come back. The ratio drops.
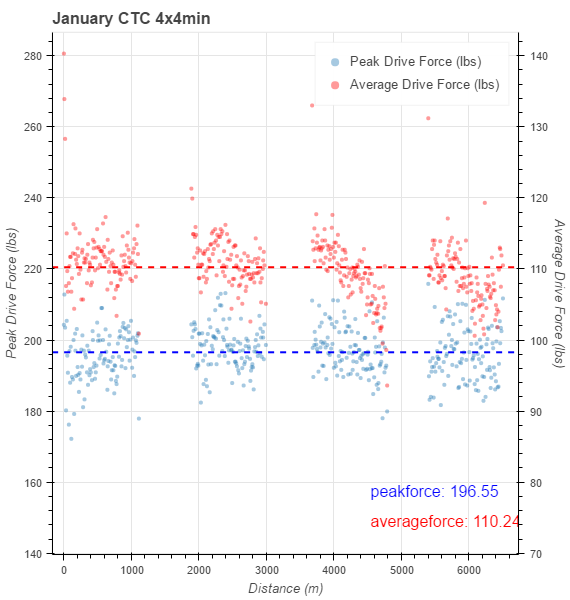
I was wondering if this is due to the peak force or the average force. Guess what? There is a chart for that:
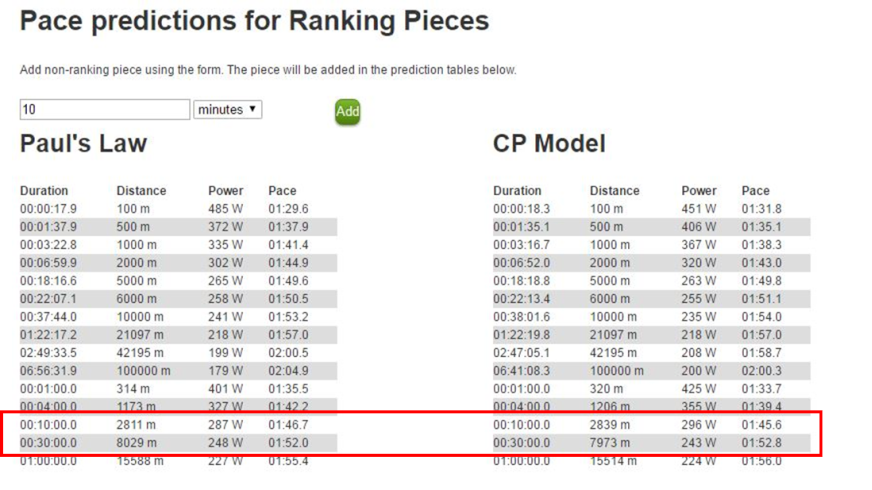
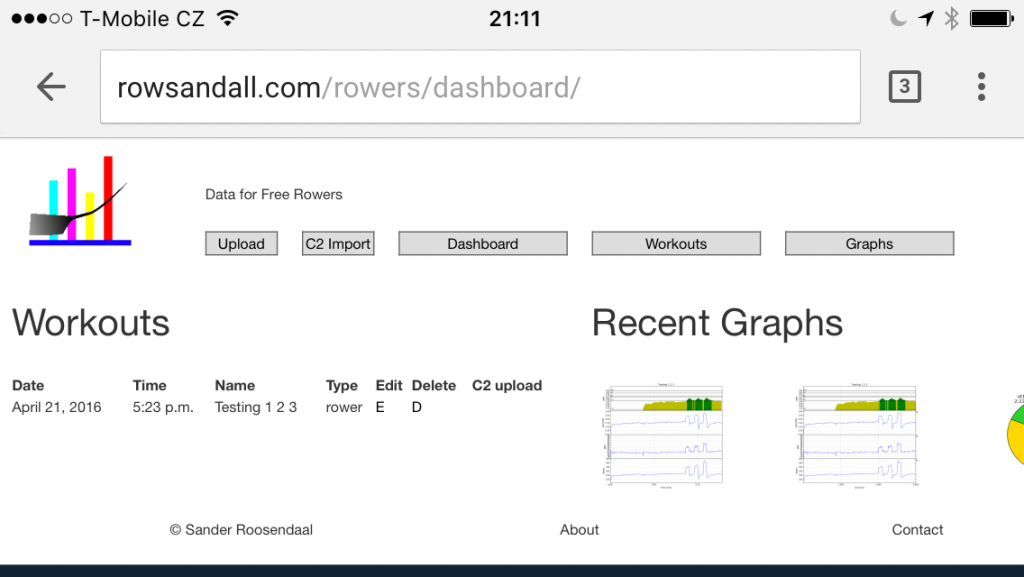
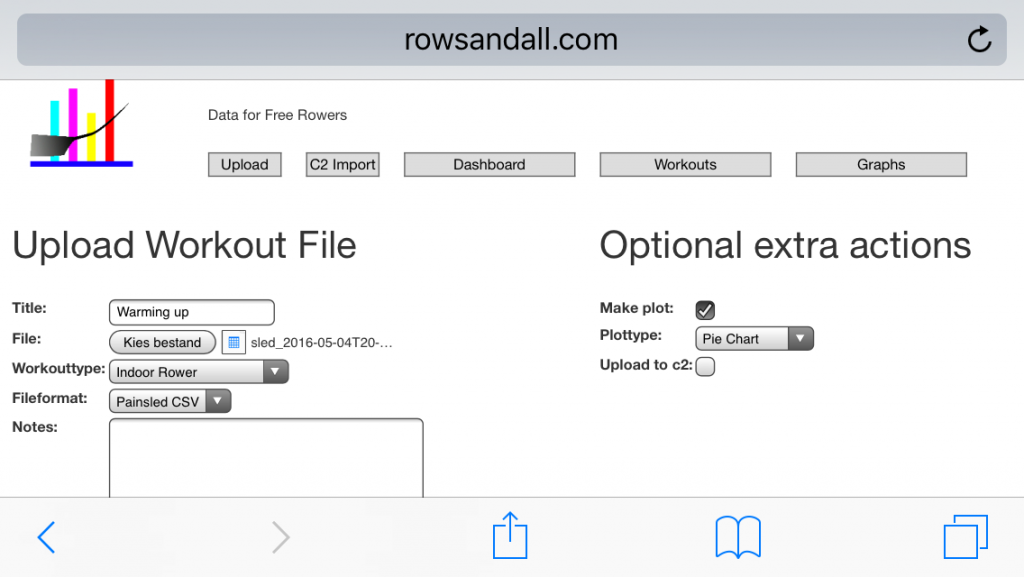
After a few months of spending some of my free time on rowsandall.com, I have something that is really useful, at least for myself. I use painsled to record the data. I get them onto rowsandall.com. I have set of “favorite” charts defined that I browse through. Rest paddling is automatically filtered out, and the result is a set of data that give me a quick overview of what I did, and some observations that are hard to get without a coach sitting next to and observing you.
The temperature in my rowing basement was +1.5C. Outside temperature -8C.


Feb 22 2017
February CTC (10×90″/30″)
Well, that was painful.
Workout Summary - media/20170222-2000230o.csv

--|Total|-Total-|--Avg--|-Avg-|Avg-|-Avg-|-Max-|-Avg

--|Dist-|-Time--|-Pace--|-Pwr-|SPM-|-HR--|-HR--|-DPS

--|04931|20:00.0|02:01.7|244.4|26.8|170.3|181.0|09.2

W-|04129|15:00.0|01:49.0|274.0|27.9|169.9|181.0|09.9

R-|00813|05:00.0|03:04.6|110.8|22.5|172.9|181.0|02.4

Workout Details

#-|SDist|-Split-|-SPace-|-Pwr-|SPM-|AvgHR|MaxHR|DPS-

00|00417|01:30.0|01:47.8|268.6|27.8|145.1|163.0|10.0

01|00408|01:30.0|01:50.2|270.8|27.1|162.0|169.0|10.0

02|00407|01:30.0|01:50.7|261.7|26.9|166.9|172.0|10.1

03|00414|01:30.0|01:48.6|268.6|26.9|169.5|173.0|10.3

04|00415|01:30.0|01:48.5|283.5|27.8|171.7|177.0|10.0

05|00414|01:30.0|01:48.6|272.2|27.3|175.2|179.0|10.1

06|00411|01:30.0|01:49.5|273.3|27.0|175.9|180.0|10.2

07|00415|01:30.0|01:48.5|278.9|28.7|176.7|180.0|09.6

08|00415|01:30.0|01:48.6|279.4|29.1|177.5|181.0|09.5

09|00413|01:30.0|01:48.9|282.8|30.2|178.4|181.0|09.1
The training plan called for a 50 minute gentle run. I came home very late and had 4 performance reviews today, one of which was a very tough one.
Also, I wanted to get the CTC out of the way, and with a 2km warming up and a 2km cooling down, it would be a short workout.
Short but painful. I aimed for 1:49 pace. The 30 second “rest” is just enough to make you go harder than if you would row this without breaks, and you pay for it after 3 or 4 intervals.
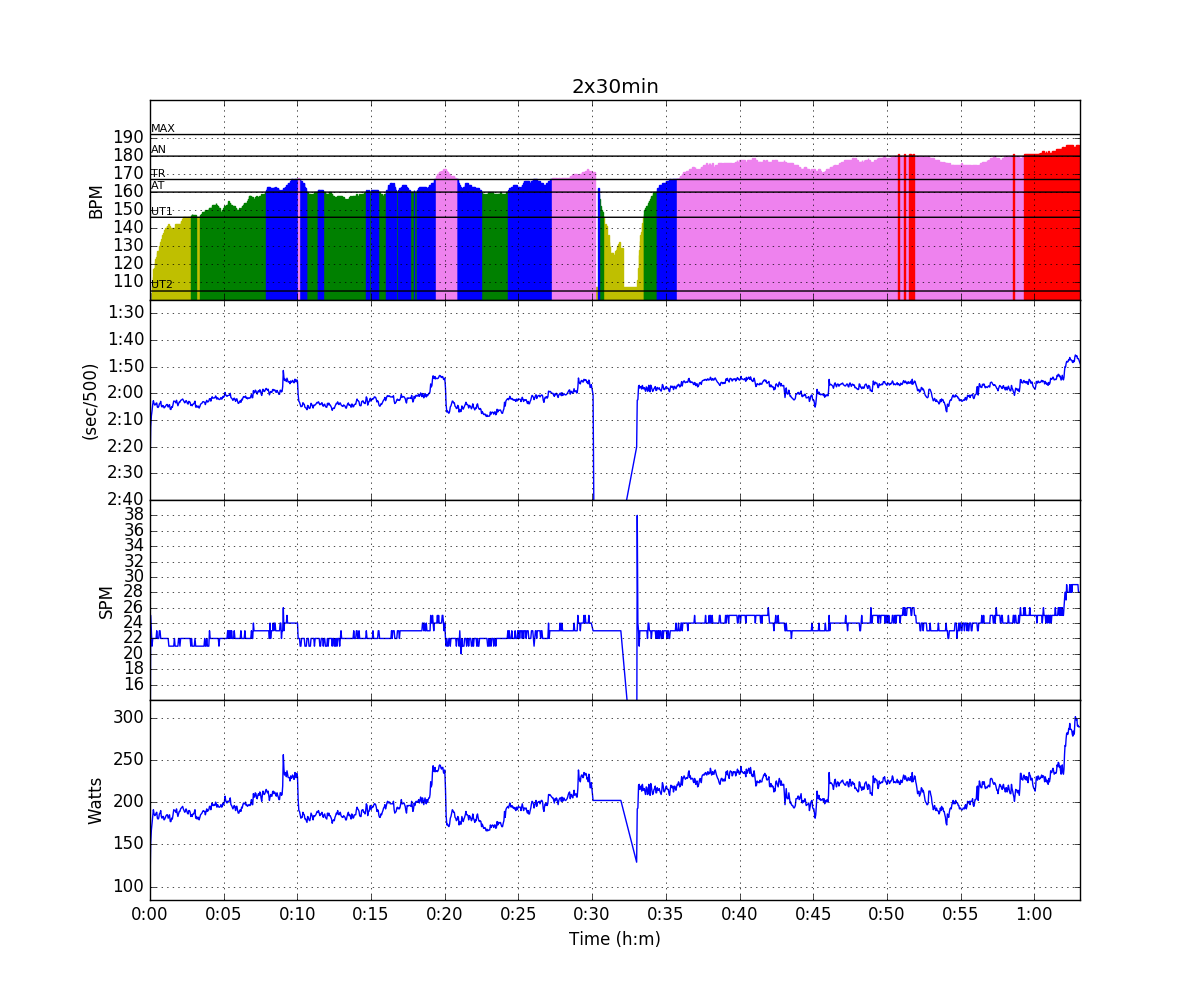
A bunch of stroke metric plots:
And here is the correlations table:
You can see the strong negative correlation of stroke rate and average/peak force ratio. I would also like to point out the strong positive correlation between Work per Stroke and stroke length. A fact we all know but forget as soon as we sit down on the erg.
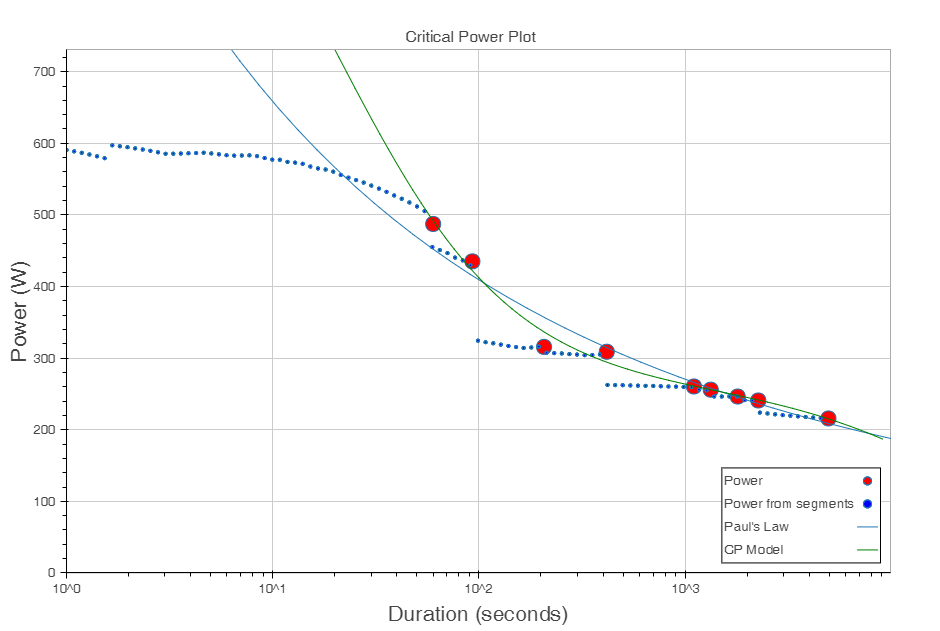
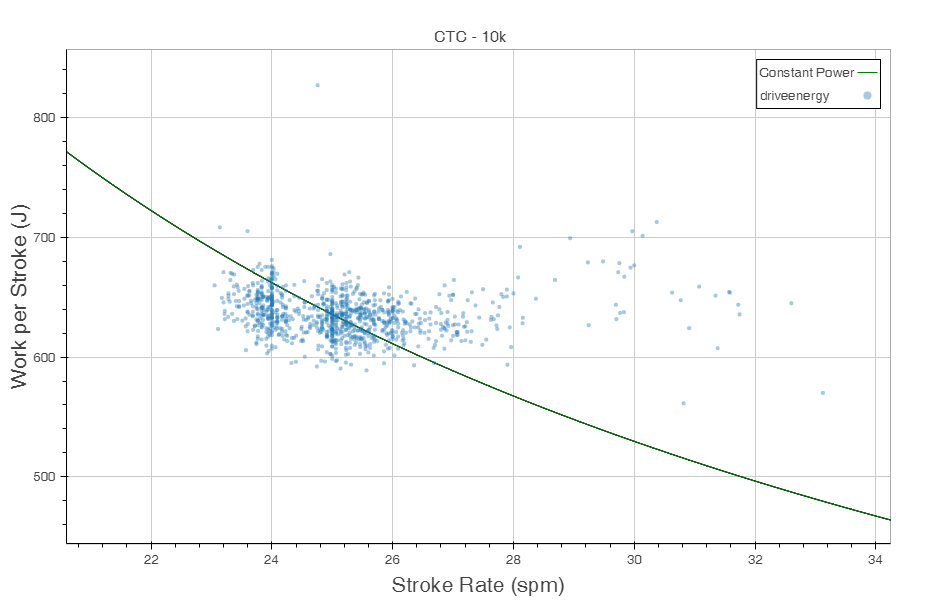
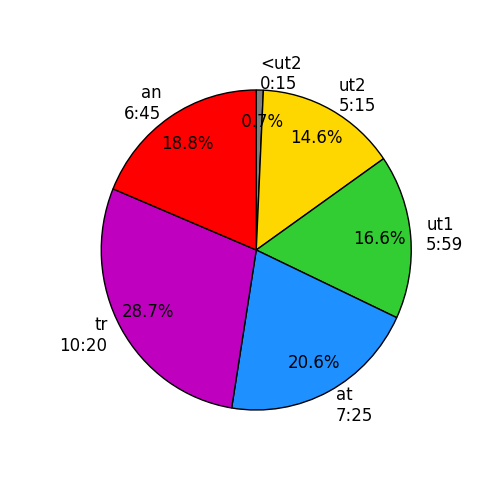
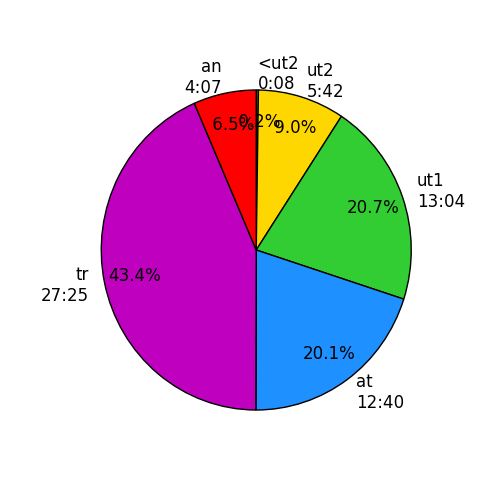
Finally, a few cumulative statistics. I am building the map of New Zealand by plotting power vs stroke rate. Stroke Force Ratio is pretty constant across stroke rates.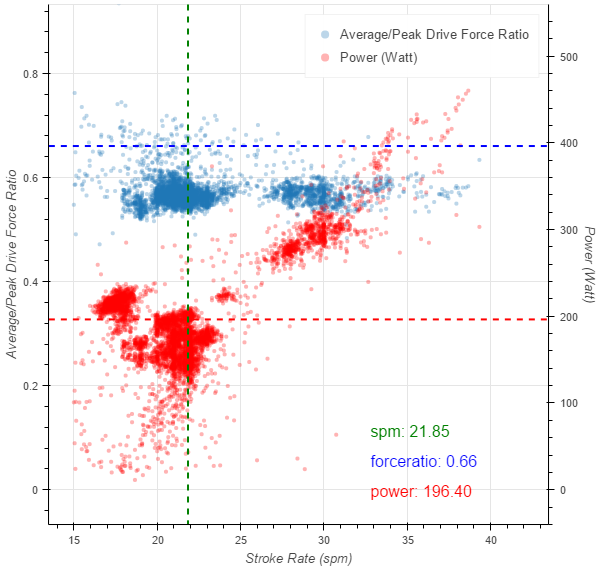
You can also see that in the past 10 days I have done a bit more speed work, compared to the past year.
I nearly fainted after completing the workout. This is a real hard one, especially on a day with a few performance reviews.
By sanderroosendaal • Uncategorized • 1 • Tags: concept2, ctc, erg, OTE, rowing, training