Feb 11 2016
Take me to the river … No
Romana is still ill (she calls it recovering), so I rowed my training at 4pm at the rowing club, so I could help the girls with their training.
I also took a look into the boat house, because I knew my trailer was parked behind the parts for the new dock. Just wanted to make sure I had a plan for Friday – take boats to the river day. That’s when I discovered that the new dock parts are pretty heavy. You need at least six strong men to move one part, and there are many of them.
We’ll be building the dock next week, so I decided to wait another week. It would be hard to organize a group of six strong men at such short notice, even if a rowing club has high concentrations of strong men. Old strong men have day jobs and family commitments. Young strong men have an important erg race coming Saturday so will not be willing to help.
This was the moment where I should have used my brain and reorganized my micro cycle plan. I had a sprinty interval session planned for today, just because I wanted to spend Friday to Sunday fine tuning technique on the river …
After yesterday’s 30 minute intensive row, a light endurance session would have been ideal, and now that the OTW plans were canceled, I should have just done that.
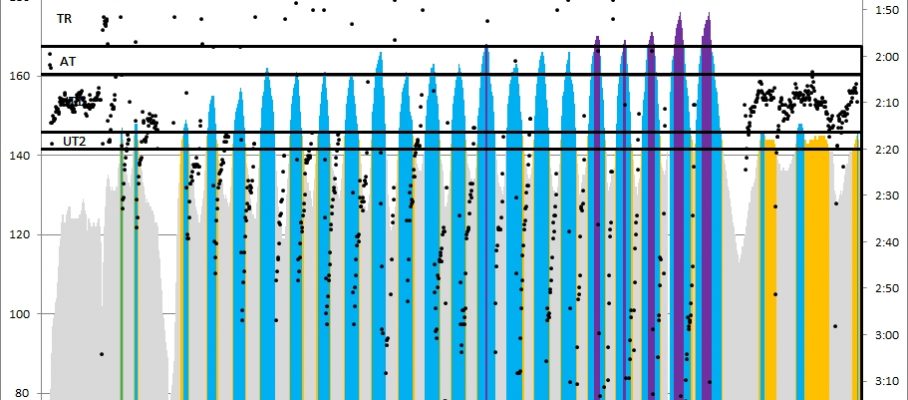
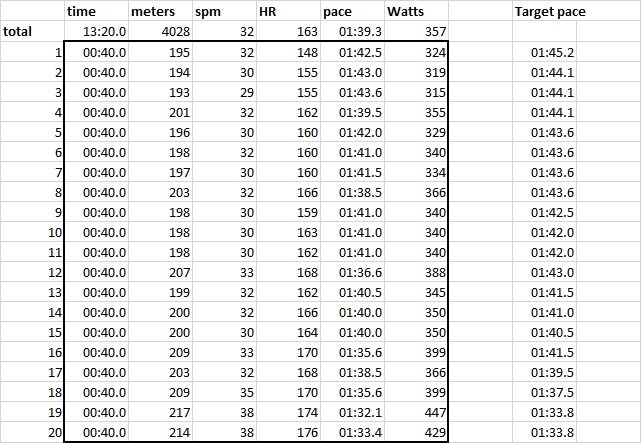
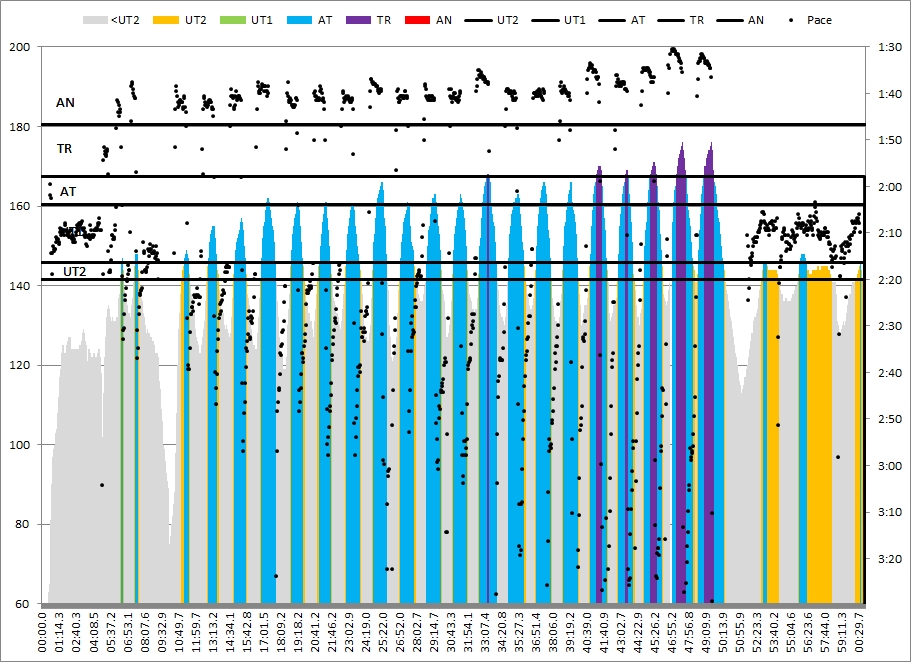
Instead, I stuck to the plan …
Good thing about rowing in the erg room is that there are always rowers walking 0r standing behind the erg, and with me that has a very healthy effect on my splits. I needed that today …

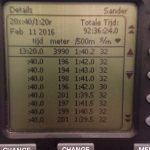
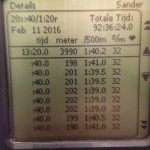
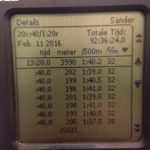
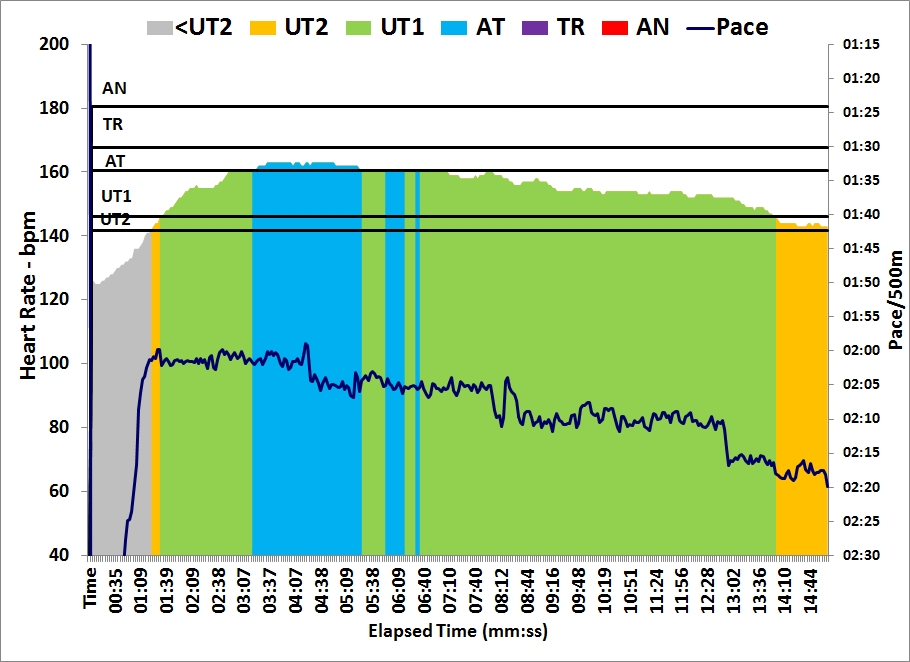
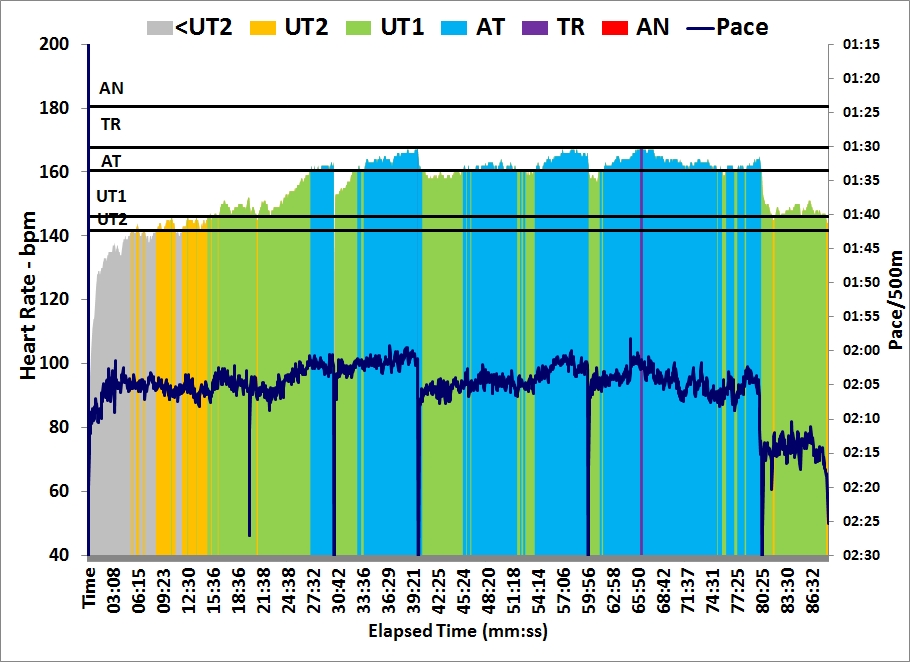
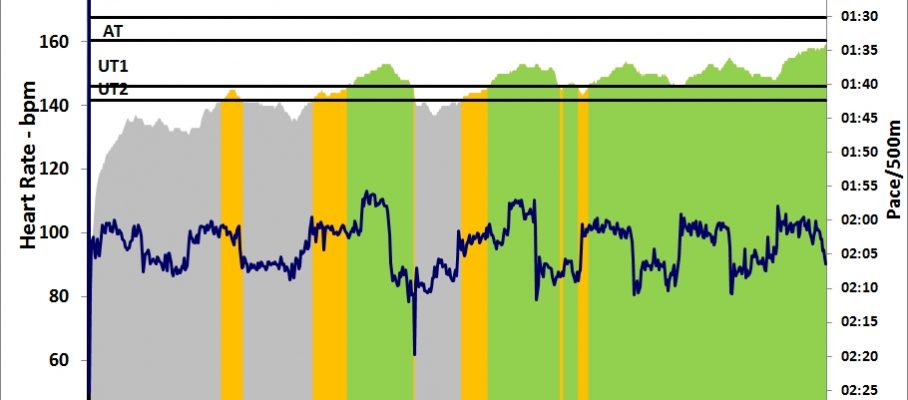
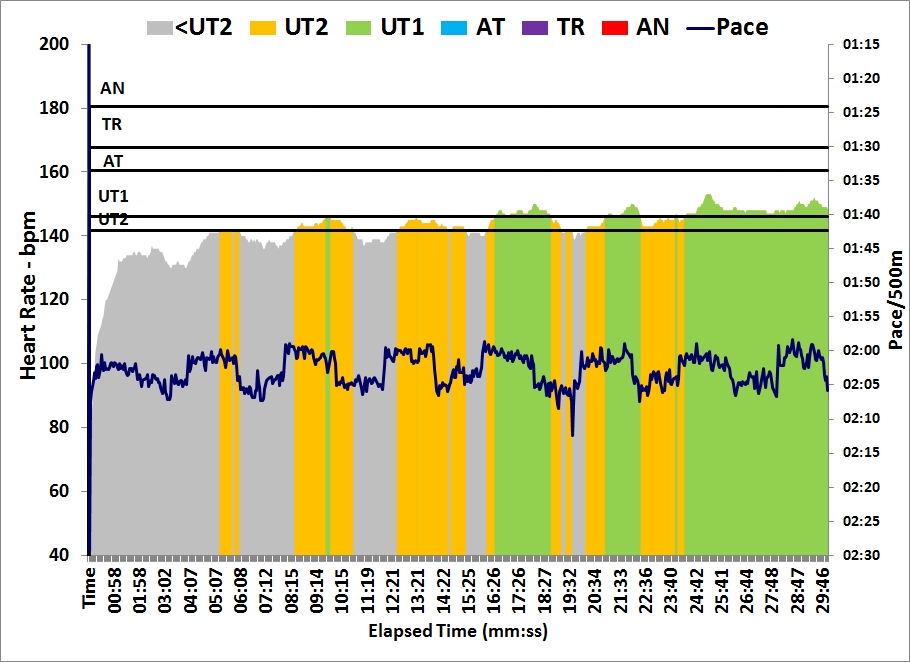
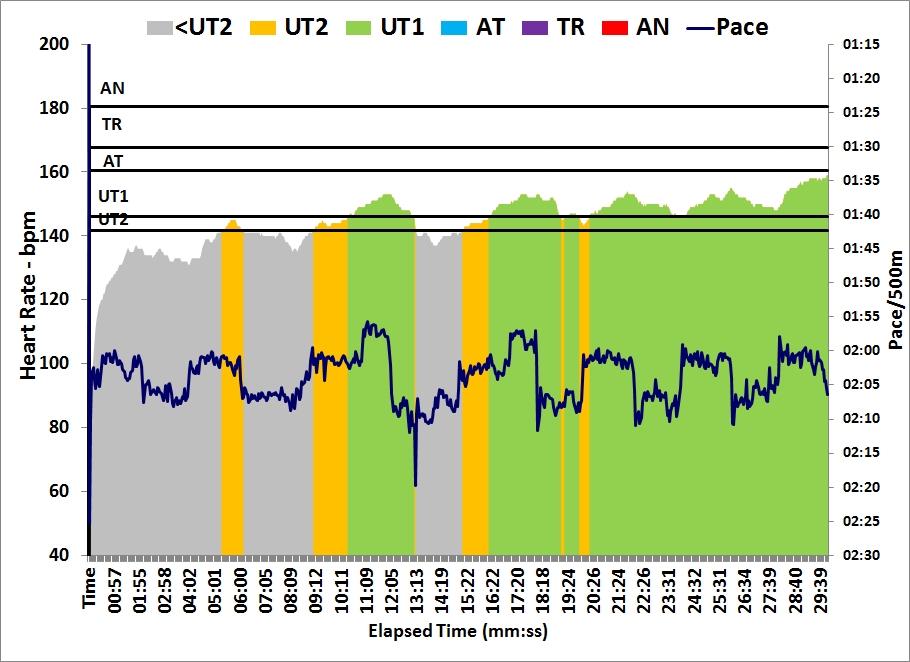
Average pace of 1:40.2. Last week I did the same session with an average pace of 1:39.3.
I have been playing with free software called Golden Cheetah. It’s a desktop program to keep training logs and analyse the data, just like SportTracks, which I use as my central tool.
Golden Cheetah is very power oriented, so if you have many sessions where you don’t have power data (OTW rows, cycling, running), it’s going to be of less use for keeping and analysing all your data. I loaded all my painsled data plus some selected erg tests into it, just to play. One of the plots I did was the following:
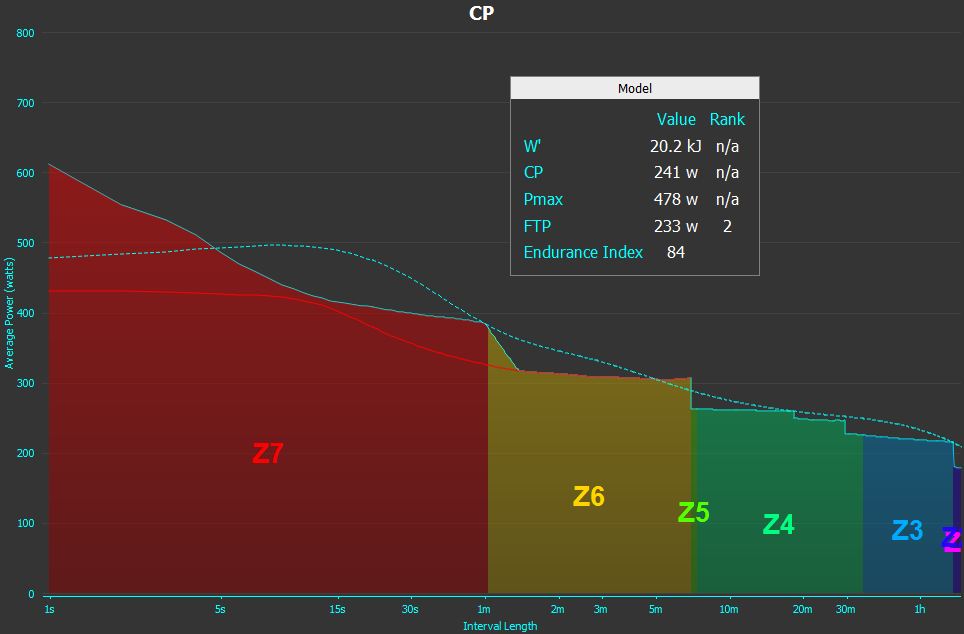
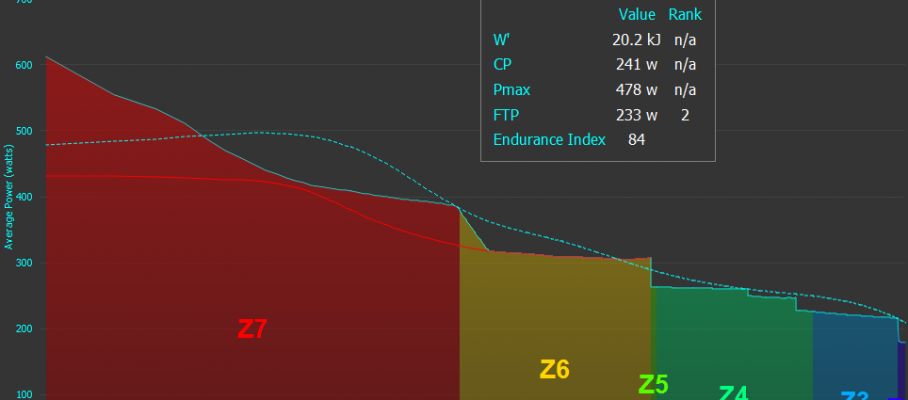
So horizontally it shows the interval length in minutes on a log scale, and vertically (erg) power. The solid blue line is the best effort the program found in my training data. So, for example, at the edge of the “Z7” and “Z6” zones, you can see that I have done a full minute at just under 400W. This was from the 1 min on / 1 min off session on January 4. Actually, the entire “Z7” part of the curve is from that session. The red curve is my 2k erg test from November 15. The dashed blue line is a (pretty bad) fit. I guess that with more data the fit will become better and the whole thing could become a kind of a pace predictor. Reading about their model, I discovered that it’s a more sophisticated version of what I did in this blog post.
Nice, but I will stick with SportTracks and using excel to do pace predictions from my SB/PB rows.
When I drove home and switched on the car radio, they were playing “Take me to the river” by the Talking Heads. Not kidding!





Feb 14 2016
End of the volume week
Friday
The girls did a circuit training using their own body weight. I put an erg on sliders in the weights room so I could check them a bit.
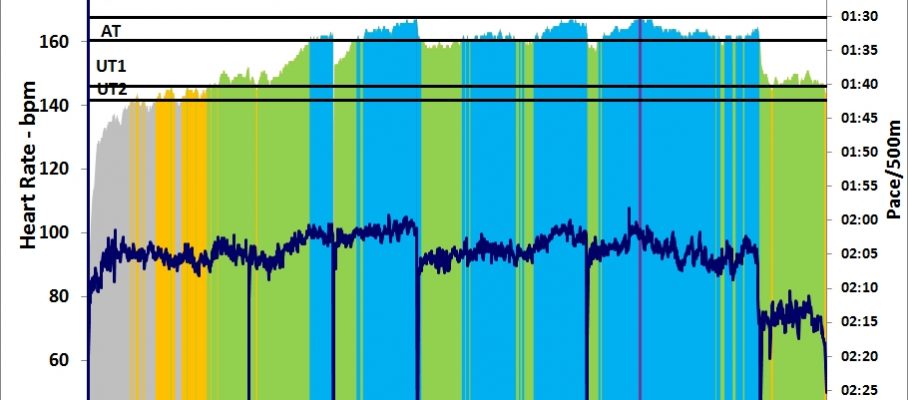
I rowed for an hour, randomly interrupted to give instructions to the girls, or just to get some water.
Tired after a long, heavy week. Still, on the slides, my pace is 1 to 2 seconds per 500m faster in these steady state rows, than on the static erg.
Saturday
I was looking forward to this training. Some running with the girls. They would do a 4x3min with light jogging in between, and for me it would be a light jog all the way. Both were wearing heart rate monitors. It was interesting to see the differences. Girl A, the slower runner, albeit with better running technique, reaches 195 bpm while chatting during the warming up, and reached 205 bpm on the first interval. Girl B, the faster runner – but with worse technique, she wastes a lot of energy in up-down motions – had difficulty getting her heart rate above 165bpm in the first interval, and reaches 175 bpm in the subsequent intervals. A case of sprinter vs stayer … girl B prefers the longer distances and has difficulties to start fast.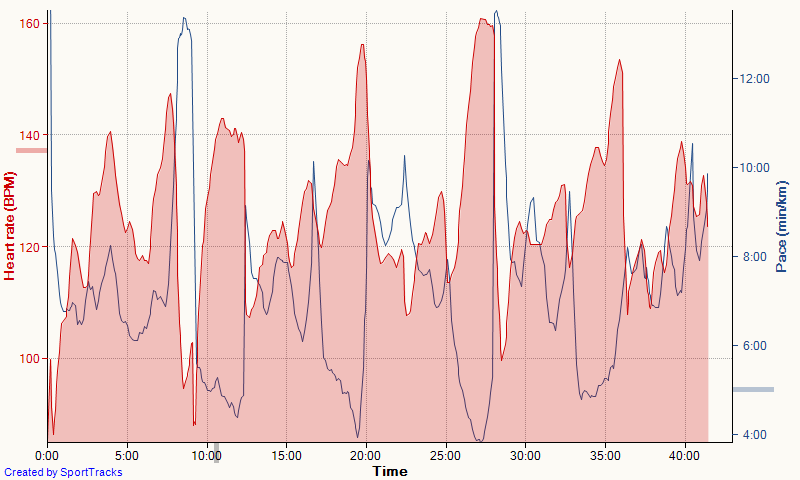
Just fifty minutes.
Sunday
I decided to do only 3×20 minute of erging (vs 4×20 minutes). I would fulfill my training plan with that and my body is really longing for a rest day now. Did a 1402m warming up, so I could put some score on the 2016 Carole McNally memorial CTC, then 3x20min. I didn’t force the average to 200W, but let it evolve naturally.
Added a stroke histogram to my Painsled spreadsheet, just for fun. The left graph is just the 20 minute intervals. The right one includes the warming up, cooling down, and rest periods.
Here are the stats, from the same spreadsheet:
Heart rate was low on average. I am keeping track of lactate at 60min vs average heart rate and perceived exertion. All rows are between 190 and 202 W on average.
Left graph is heart rate vs Lactate. Not really a trend visible. The right graph is my subjective perceived exertion. It is a little suspicious because I write down this number already knowing the result of the lactate measurement … still I try to be honest and think about the number during the row, before I know the result. This measure correlates a lot better with the lactate measurement.
Next week: Low volume, a 1 minute test and a 6 km PB attempt. Tomorrow a rest day: Hurray.
By sanderroosendaal • Uncategorized • 0 • Tags: concept2, erg, OTE, rowing, running, steady state, training