The girls did a circuit training using their own body weight. I put an erg on sliders in the weights room so I could check them a bit.
I rowed for an hour, randomly interrupted to give instructions to the girls, or just to get some water.
Tired after a long, heavy week. Still, on the slides, my pace is 1 to 2 seconds per 500m faster in these steady state rows, than on the static erg.
Saturday
I was looking forward to this training. Some running with the girls. They would do a 4x3min with light jogging in between, and for me it would be a light jog all the way. Both were wearing heart rate monitors. It was interesting to see the differences. Girl A, the slower runner, albeit with better running technique, reaches 195 bpm while chatting during the warming up, and reached 205 bpm on the first interval. Girl B, the faster runner – but with worse technique, she wastes a lot of energy in up-down motions – had difficulty getting her heart rate above 165bpm in the first interval, and reaches 175 bpm in the subsequent intervals. A case of sprinter vs stayer … girl B prefers the longer distances and has difficulties to start fast.
Just fifty minutes.
Sunday
I decided to do only 3×20 minute of erging (vs 4×20 minutes). I would fulfill my training plan with that and my body is really longing for a rest day now. Did a 1402m warming up, so I could put some score on the 2016 Carole McNally memorial CTC, then 3x20min. I didn’t force the average to 200W, but let it evolve naturally.
Added a stroke histogram to my Painsled spreadsheet, just for fun. The left graph is just the 20 minute intervals. The right one includes the warming up, cooling down, and rest periods.
Here are the stats, from the same spreadsheet:
Heart rate was low on average. I am keeping track of lactate at 60min vs average heart rate and perceived exertion. All rows are between 190 and 202 W on average.
Left graph is heart rate vs Lactate. Not really a trend visible. The right graph is my subjective perceived exertion. It is a little suspicious because I write down this number already knowing the result of the lactate measurement … still I try to be honest and think about the number during the row, before I know the result. This measure correlates a lot better with the lactate measurement.
Next week: Low volume, a 1 minute test and a 6 km PB attempt. Tomorrow a rest day: Hurray.
We use cookies to ensure that we give you the best experience on our website. If you continue to use this site we will assume that you are happy with it.Ok
Feb 14 2016
End of the volume week
Friday
The girls did a circuit training using their own body weight. I put an erg on sliders in the weights room so I could check them a bit.
I rowed for an hour, randomly interrupted to give instructions to the girls, or just to get some water.
Tired after a long, heavy week. Still, on the slides, my pace is 1 to 2 seconds per 500m faster in these steady state rows, than on the static erg.
Saturday
I was looking forward to this training. Some running with the girls. They would do a 4x3min with light jogging in between, and for me it would be a light jog all the way. Both were wearing heart rate monitors. It was interesting to see the differences. Girl A, the slower runner, albeit with better running technique, reaches 195 bpm while chatting during the warming up, and reached 205 bpm on the first interval. Girl B, the faster runner – but with worse technique, she wastes a lot of energy in up-down motions – had difficulty getting her heart rate above 165bpm in the first interval, and reaches 175 bpm in the subsequent intervals. A case of sprinter vs stayer … girl B prefers the longer distances and has difficulties to start fast.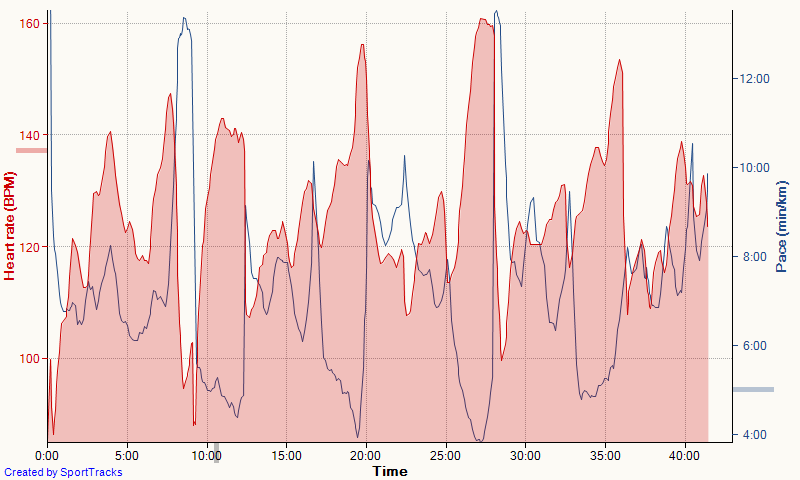
Just fifty minutes.
Sunday
I decided to do only 3×20 minute of erging (vs 4×20 minutes). I would fulfill my training plan with that and my body is really longing for a rest day now. Did a 1402m warming up, so I could put some score on the 2016 Carole McNally memorial CTC, then 3x20min. I didn’t force the average to 200W, but let it evolve naturally.
Added a stroke histogram to my Painsled spreadsheet, just for fun. The left graph is just the 20 minute intervals. The right one includes the warming up, cooling down, and rest periods.
Here are the stats, from the same spreadsheet:
Heart rate was low on average. I am keeping track of lactate at 60min vs average heart rate and perceived exertion. All rows are between 190 and 202 W on average.
Left graph is heart rate vs Lactate. Not really a trend visible. The right graph is my subjective perceived exertion. It is a little suspicious because I write down this number already knowing the result of the lactate measurement … still I try to be honest and think about the number during the row, before I know the result. This measure correlates a lot better with the lactate measurement.
Next week: Low volume, a 1 minute test and a 6 km PB attempt. Tomorrow a rest day: Hurray.
By sanderroosendaal • Uncategorized • 0 • Tags: concept2, erg, OTE, rowing, running, steady state, training