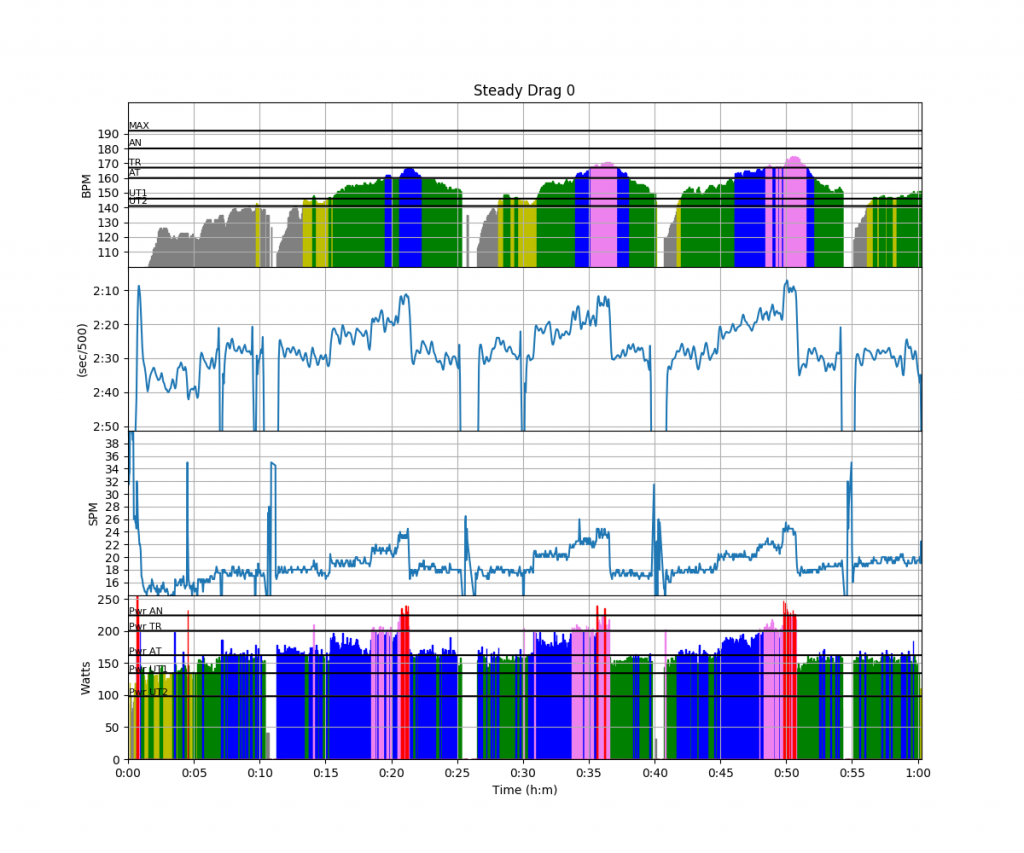
Another Steady State row in the single. It was beautiful weather. No wind at all. Mirror flat water. Great day to do rate ladders and work on technique.
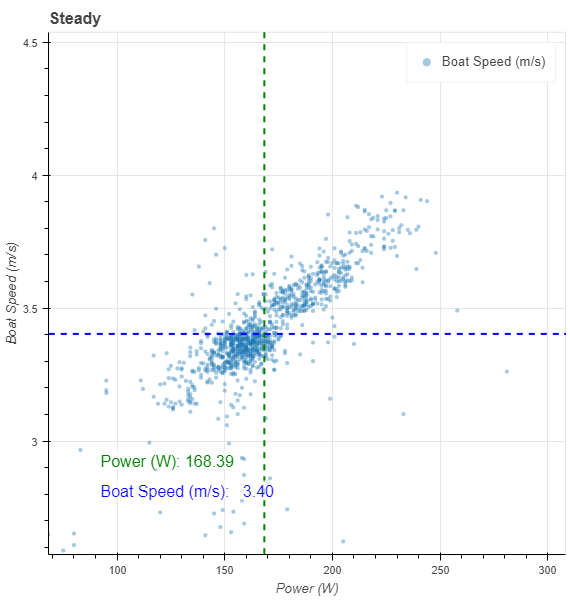
 Paying attention to pace at constant stroke rate I noticed significant speed improvements when focusing on sitting up straight on the catch and making sure I don’t open up the back too early. However, it’s difficult in the boat to check whether the speed gains are because I row at higher Work per Stroke (average drive force, stroke length) when focusing on this or whether I am improving boat efficiency. The following chart seems to suggest it’s primarily a power/length/force thing:
If I look at a measure for efficiency and do the statistics, I find a small positive correlation with:
- Distance per stroke (logical)
- Slip (higher value = higher efficiency)
I also find a small negative correlation with:
- Peak force
- Peak force angle (i.e. lower efficiency when peak force is closer to the bow)
- Average force
- Work per Stroke
I find no correlation whatsoever, i.e. pure random behavior on:
- Drive length
- Catch & Finish angle
- SPM
- Wash
- Effective stroke length
It may be that I am pretty constant in drive length, catch and finish angle, but I do think that the stats point towards one thing and that is ramping up the force too fast at the catch. Look at the correlations. Larger slip, lower average and peak force and work per stroke point to a most efficient stroke when I am not pushing too hard. The odd one out here is the peak force angle.
I also used the Quiske pod to measure seat speed and try to correlate that to efficiency. I recorded three full lake lengths, and from each stretch I selected strokes at 20, 22 and 24spm. Here are the charts:
Stroke Rate 20:
This slideshow requires JavaScript.
Stroke Rate 22:
This slideshow requires JavaScript.
Stroke Rate 24:
This slideshow requires JavaScript.
I am glad my strokes are so consistent and all curves look nearly identical, but it doesn’t help with the analysis. Only at 20spm there is a clear difference between the red curve and the two others. The red curve has
- Lower seat speed early in the drive and a lower boat acceleration early in the drive
- A shorter period where the seat doesn’t move around the finish
In this chart, in particular the recovery in the blue curve seems inefficient. I am hesitant to look at the boat speeds as I haven’t correlated it to average power yet. I am conscious though that this blue curve corresponds to the first Rokle – Sirka stretch, where I was most fanatical in trying to be slow around the finish (doing a “Drew”). One has to bear in mind though that all this was done at low boat speeds and low stroke rates. At full 1k sprint speed and 35spm the recovery dynamics looks totally different, and both boat drag and seat acceleration are much higher. Still, I am sceptical.
Follow me in social media
Like this:
Like Loading...
Sep 17 2018
Another steady state row – Super Flat Water & Technique study
Another Steady State row in the single. It was beautiful weather. No wind at all. Mirror flat water. Great day to do rate ladders and work on technique.
If I look at a measure for efficiency and do the statistics, I find a small positive correlation with:
I also find a small negative correlation with:
I find no correlation whatsoever, i.e. pure random behavior on:
It may be that I am pretty constant in drive length, catch and finish angle, but I do think that the stats point towards one thing and that is ramping up the force too fast at the catch. Look at the correlations. Larger slip, lower average and peak force and work per stroke point to a most efficient stroke when I am not pushing too hard. The odd one out here is the peak force angle.
I also used the Quiske pod to measure seat speed and try to correlate that to efficiency. I recorded three full lake lengths, and from each stretch I selected strokes at 20, 22 and 24spm. Here are the charts:
Stroke Rate 20:
This slideshow requires JavaScript.
Stroke Rate 22:
This slideshow requires JavaScript.
Stroke Rate 24:
This slideshow requires JavaScript.
I am glad my strokes are so consistent and all curves look nearly identical, but it doesn’t help with the analysis. Only at 20spm there is a clear difference between the red curve and the two others. The red curve has
In this chart, in particular the recovery in the blue curve seems inefficient. I am hesitant to look at the boat speeds as I haven’t correlated it to average power yet. I am conscious though that this blue curve corresponds to the first Rokle – Sirka stretch, where I was most fanatical in trying to be slow around the finish (doing a “Drew”). One has to bear in mind though that all this was done at low boat speeds and low stroke rates. At full 1k sprint speed and 35spm the recovery dynamics looks totally different, and both boat drag and seat acceleration are much higher. Still, I am sceptical.
Follow me in social mediaShare this:
Like this:
By sanderroosendaal • Uncategorized • 0 • Tags: 1x, OTW, rowing, single, steady state, training