Monday
A 45 minute strength workout in the gym close to work. I went after work, which was a mistake. It was too crowded and I had to improvise the exercises because some stations were occupied. Must take breaks from work to work out here, then get back to work.
Tuesday
A long steady state session in the single, and a good one.
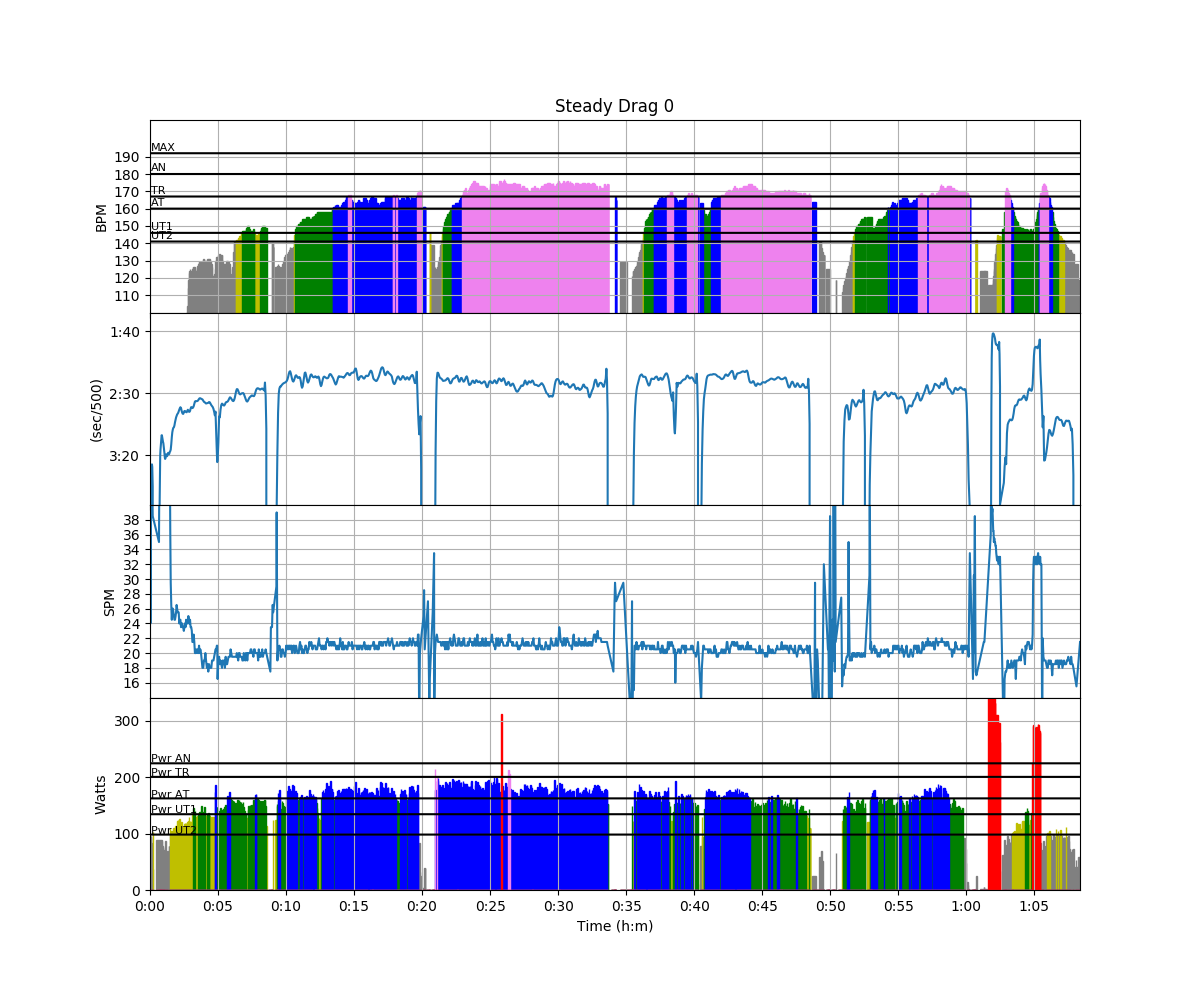 I had no difficult holding 180-190W, and the pace was good enough. I tried to work on light catches (and not digging too deep). At the end I did a start plus 20 strokes for fun, and then another 20 strokes around race pace. In the bit between 21 minutes and 33 minutes I was chased by a launch and an eight full of juniors from the Lodni Sporty club, including a fresh European Champion. Not sure what they were doing, but they stayed behind me, and around 28 minutes they stopped for technical discussions.
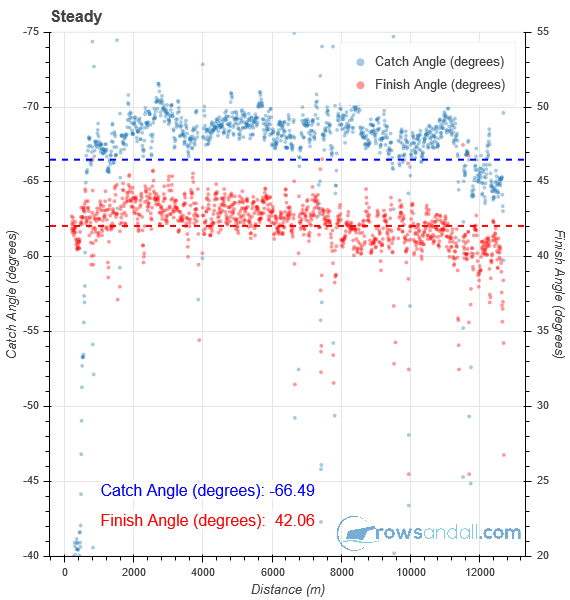 Catch and finish angle look a little inconsistent, and getting less layback when I get tired.
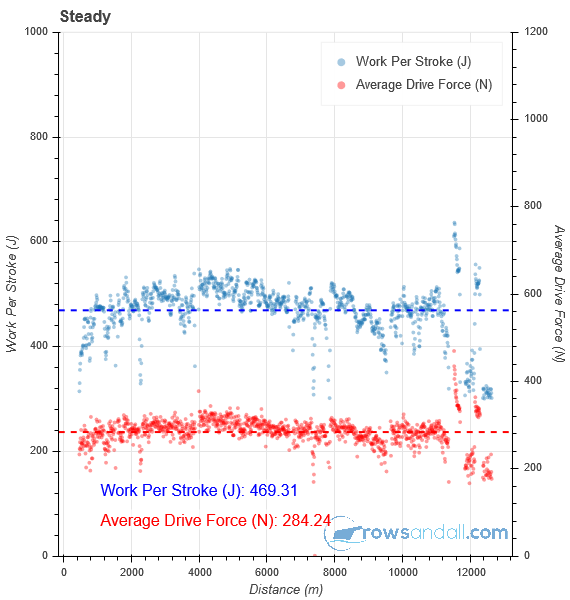 I was happy with the Work Per Stroke values, having been lower in the “recovery from illness” sessions.
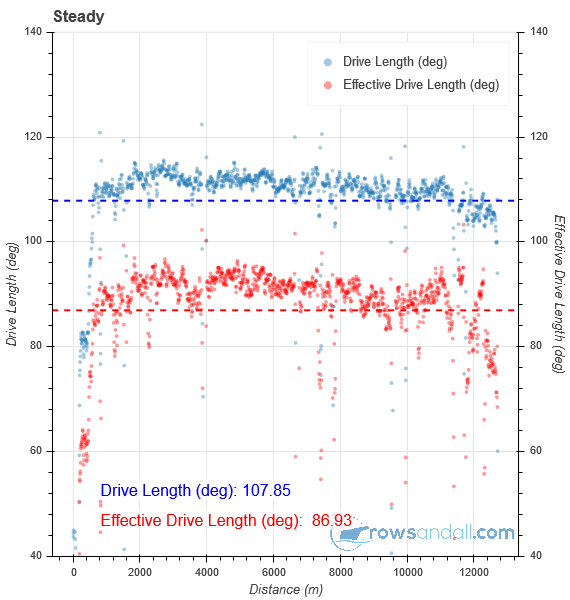 Pretty good length. I am not happy with the average value for Effective Drive Length. In the boat, I saw values around 92 degrees, and yes according to the workout stats the Median is at 90 degrees.
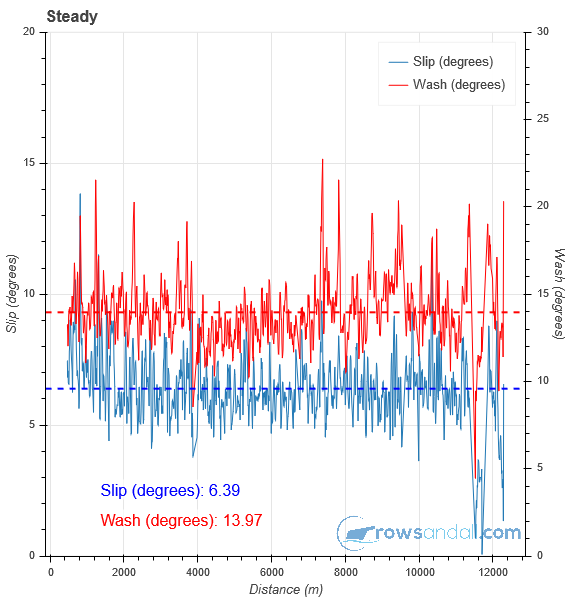
Wash and Slip are in decent ranges, so nothing to worry about.
Box Charts
The rowsandall.com box charts are an underestimated source of insights. Just select a date range, a boat type, and select similar workouts, and there is a lot to learn from the charts that you create. Here is a set of workouts in the single for April, May and early June.
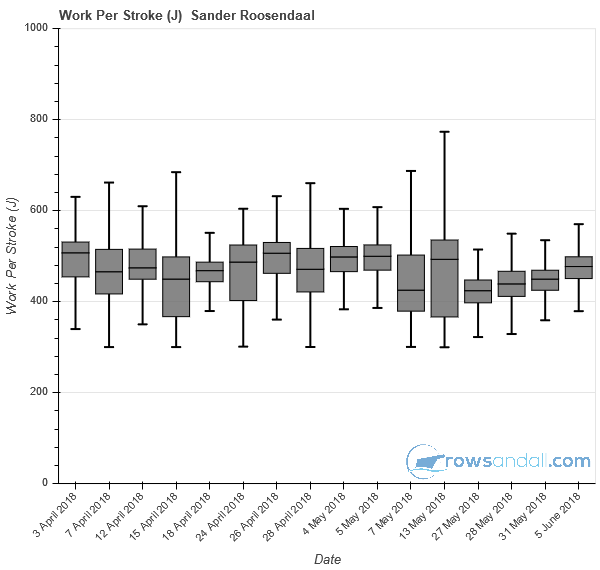 May 13 included a race, and after May 27th is me recovering from illness. You can see how the Work per Stroke value slowly climbs back to normal levels.
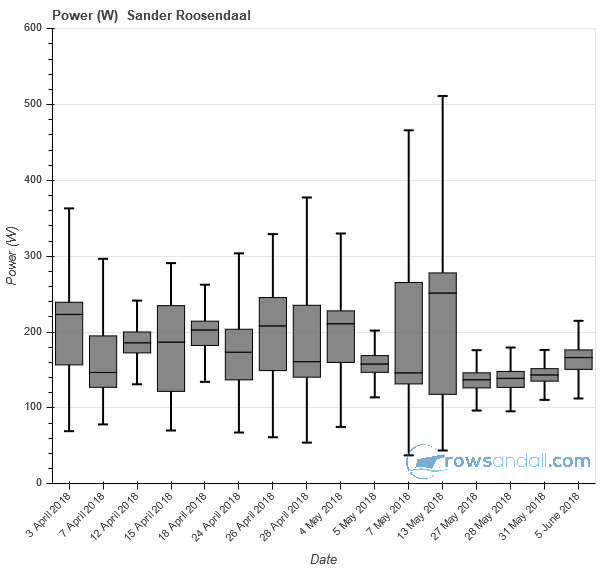 The Power values are interesting as well. So, on May 13 I raced, so ignore that session. May 7 was a sprintervals session. I guess the power ranges are influenced greatly by what kind of session you do.
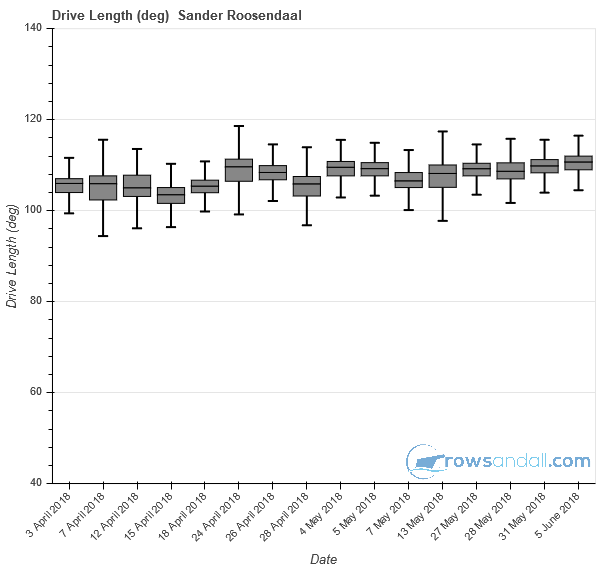 Total drive length. Seems to be increasing slightly over the past two months. So it is definitely not going in the wrong direction.
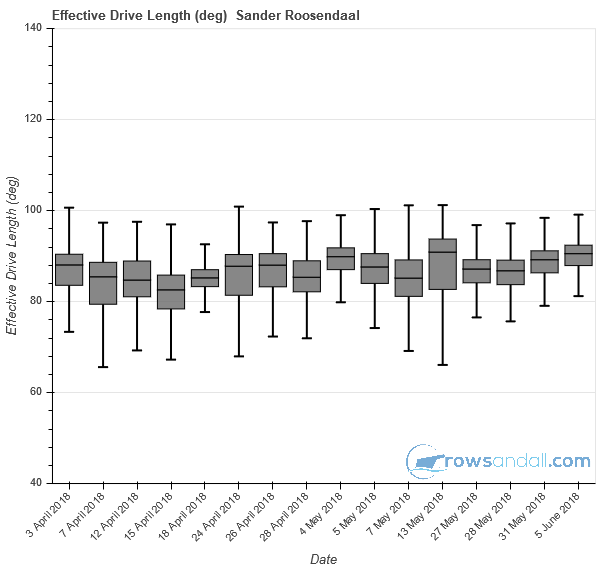 Interestingly, I cannot say that about the effective drive length. This one seems to be stagnating.
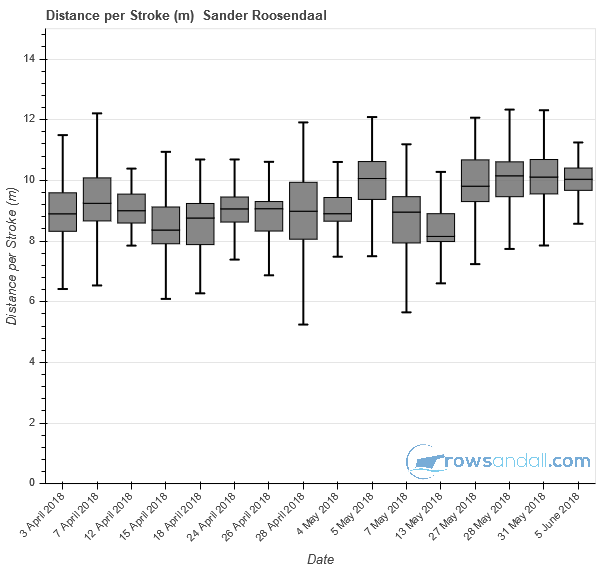 Distance per stroke is an interesting metric for many reasons. One, because it can be measured without the need of specialized equipment. All you need is pace and stroke rate. Second, because it is one of the few ways to look at check and boat run. This one seems to have jumped to consistently higher values since my illness. I guess the slow steady state gave me time to work on the recovery.
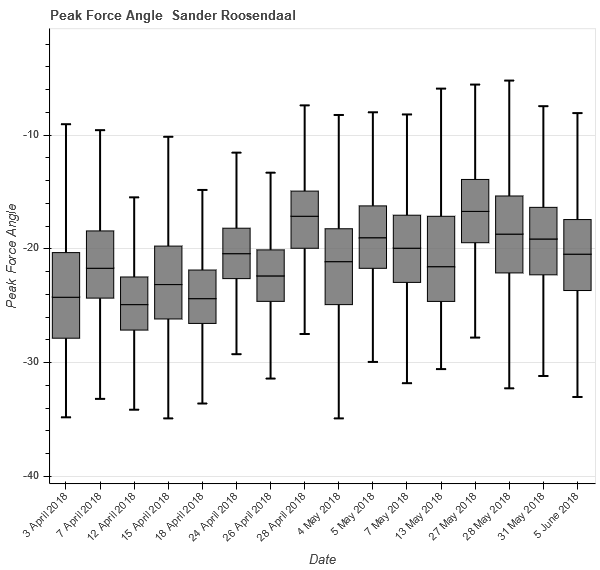 Finally, peak for angle, a good way to see where the accent of my pull lies, close to the catch or more towards the finish (better). I see improvement.
Flex Charts
Once you see some trends in the box charts, it is always good to check your theory using the Trend Flex chart. Another rarely used gem of rowsandall.com, if I may say so.
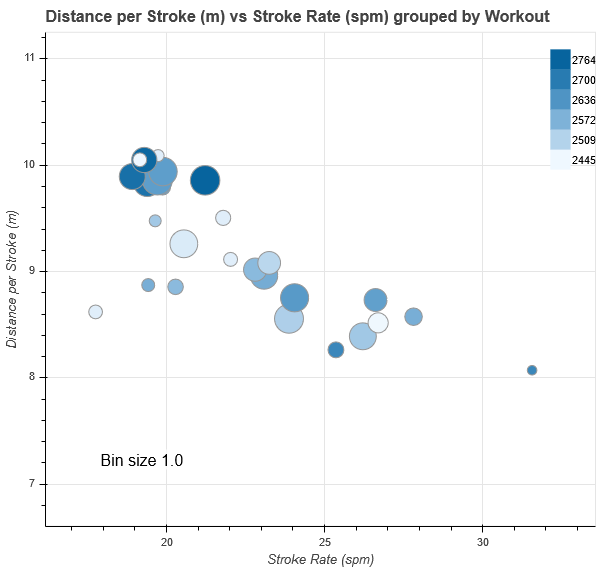
Here, for example, I am plotting the Distance per Stroke vs Stroke rate, each circle being a separate workout, with the lighter circles showing the earlier workouts and the darker ones the more recent ones. That shows that I shouldn’t claim victory too early, as most circles seem to be falling around some “natural” relationship, and all that has happened is that I have been rowing lower stroke rates recently.
Follow me in social media
Like this:
Like Loading...
Jun 7 2018
Back at old level? Lots of charts to try and figure that out
Monday
A 45 minute strength workout in the gym close to work. I went after work, which was a mistake. It was too crowded and I had to improvise the exercises because some stations were occupied. Must take breaks from work to work out here, then get back to work.
Tuesday
A long steady state session in the single, and a good one.
Wash and Slip are in decent ranges, so nothing to worry about.
Box Charts
The rowsandall.com box charts are an underestimated source of insights. Just select a date range, a boat type, and select similar workouts, and there is a lot to learn from the charts that you create. Here is a set of workouts in the single for April, May and early June.
Flex Charts
Once you see some trends in the box charts, it is always good to check your theory using the Trend Flex chart. Another rarely used gem of rowsandall.com, if I may say so.
Here, for example, I am plotting the Distance per Stroke vs Stroke rate, each circle being a separate workout, with the lighter circles showing the earlier workouts and the darker ones the more recent ones. That shows that I shouldn’t claim victory too early, as most circles seem to be falling around some “natural” relationship, and all that has happened is that I have been rowing lower stroke rates recently.
Follow me in social mediaShare this:
Like this:
By sanderroosendaal • Uncategorized • 0 • Tags: 1x, lake, OTW, rowing, single, steady state, training