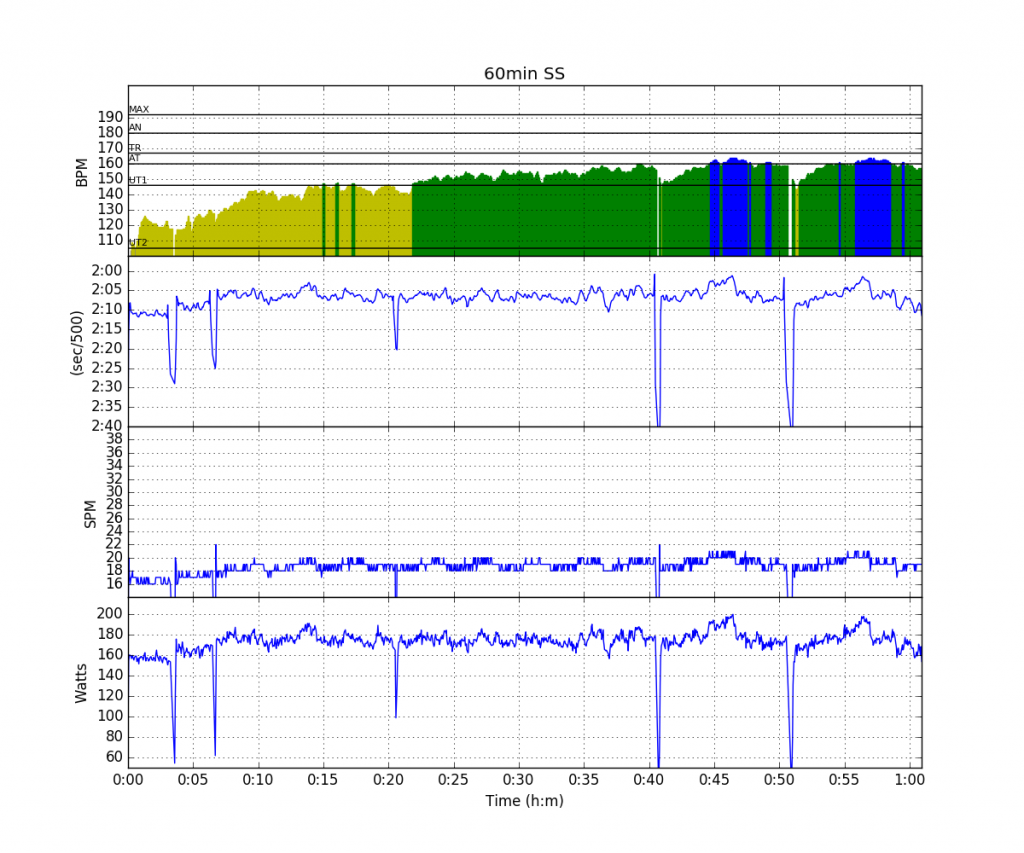
Steady State was on the menu, and in a lighter form, because this is an easy week. On my commute, I read Greg Smith’s blog about his 4×20’/1′ rest plus stroke metrics session, so I tried to show exactly the same stroke metrics plots for my 60 minutes row. I didn’t take exact 1 minute breaks, but rowed a “Just Row” and took small drinking breaks. Also, I had to interrupt my row a few times (esp in the first 10 minutes) to fiddle with the radio.
My steady state rowing is not at “10 Watt per SPM”, but roughly 15 Watts below that, so at 18SPM, I row 165-170W, etc.
Power versus stroke rate:
My plot is a bit more fuzzy than Greg’s. I seem to be driven to 19SPM at these power levels. 19SPM is like a magnet, and I lacked the concentration to try and hit the prescribed stroke rates better.
Drive length:
On this parameter, I seem to be more constant and in a narrower band than Greg. Now, a metric where I will be significantly weaker. Peak and Average Force:
Interestingly, my average force is much closer to Greg’s than my peak force. A slightly negative correlation, although not as strong as on Greg’s plot. This may be something to do with drag factor and average flywheel speed as well.
Finally, Work per Stroke:
Again, the plot is strongly influenced by me gravitating towards 19spm. This was also one of my rows where I was hitting a higher Work per Stroke than on average. Here is a plot of my rows for the month October:
Here
My October Steady State work (capped at 23SPM)
I have capped the data at 23SPM to filter out the hard distance rows. Here is the same plot with today’s data included:
To the left, and upward!
It was fun to do this. As the author of rowsandall.com, I spend more time programming additions to the site than using it for data analysis. And when I do use it for analysis, I can’t help but think of the way the data are flowing through the different pipes and filters:
There are still many good ideas to implement on the site, so the work is not done!
We use cookies to ensure that we give you the best experience on our website. If you continue to use this site we will assume that you are happy with it.Ok
Nov 1 2016
Tuesday – 60 minutes Steady State and Stroke Metrics
Steady State was on the menu, and in a lighter form, because this is an easy week. On my commute, I read Greg Smith’s blog about his 4×20’/1′ rest plus stroke metrics session, so I tried to show exactly the same stroke metrics plots for my 60 minutes row. I didn’t take exact 1 minute breaks, but rowed a “Just Row” and took small drinking breaks. Also, I had to interrupt my row a few times (esp in the first 10 minutes) to fiddle with the radio.
My steady state rowing is not at “10 Watt per SPM”, but roughly 15 Watts below that, so at 18SPM, I row 165-170W, etc.
Power versus stroke rate:
My plot is a bit more fuzzy than Greg’s. I seem to be driven to 19SPM at these power levels. 19SPM is like a magnet, and I lacked the concentration to try and hit the prescribed stroke rates better.
Drive length:
On this parameter, I seem to be more constant and in a narrower band than Greg. Now, a metric where I will be significantly weaker. Peak and Average Force:
Interestingly, my average force is much closer to Greg’s than my peak force. A slightly negative correlation, although not as strong as on Greg’s plot. This may be something to do with drag factor and average flywheel speed as well.
Finally, Work per Stroke:
Again, the plot is strongly influenced by me gravitating towards 19spm. This was also one of my rows where I was hitting a higher Work per Stroke than on average. Here is a plot of my rows for the month October:
Here
I have capped the data at 23SPM to filter out the hard distance rows. Here is the same plot with today’s data included:
To the left, and upward!
It was fun to do this. As the author of rowsandall.com, I spend more time programming additions to the site than using it for data analysis. And when I do use it for analysis, I can’t help but think of the way the data are flowing through the different pipes and filters:
There are still many good ideas to implement on the site, so the work is not done!
Follow me in social mediaShare this:
Like this:
By sanderroosendaal • Uncategorized • 2 • Tags: concept2, erg, metrics, OTE, rowing, steady state