This week is a weird week. In my preparation for the 6km head race of October 7, I plan this as an intensive week, but at the same time we are getting guests from Wednesday afternoon to Sunday morning. Therefore, I had to plan my training with all OTW and the most important sessions on Monday to Wednesday.
Originally I wanted to do a 4x2km but I changed to 8x500m in the last minute, for three reasons:
- Lack of time. With 4km vs 8km of work, the 8x500m is a faster workout
- I hoped to be able to rate up to my head race stroke rate (27-29spm) a bit easier in the shorter pieces. A good opportunity to explore these stroke rates and learn how I am fastest at these intensities
- A 2x3km (or full 6km) planned for Wednesday – too similar to 4x2km.
When I set out the lake was mirror flat, but as usual ripples started to form during the warming up. 
I used the pre-programmed 8×500/2:30 rest from the SpeedCoach, failing to remember that the speedcoach doesn’t record data during the ‘rest’ period (they say that will be fixed in the next firmware update). The weather report for my location was:
Summary for your location at 2016-09-19T05:43:09Z: Mostly Cloudy. Temperature 54.19F/12.3C. Wind: 1.27 m/s. Wind Bearing: 22 degrees
I think that is about right. Seems consistent with my own observations.
Work Details

#-|SDist|-Split-|-SPace-|-SPM-|AvgHR|MaxHR|DPS-

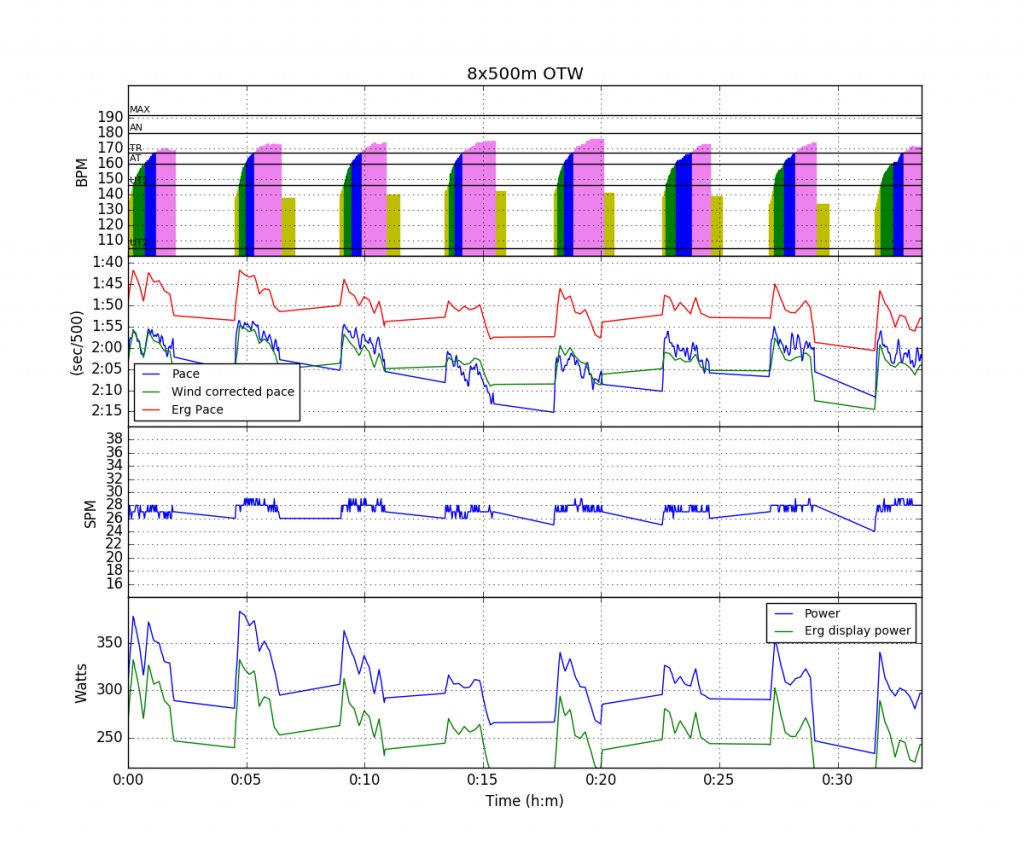
01|00500| 01:58 |01:58.7| 27.3| 160 | 170 | 9.3 - tailwind

02|00500| 01:56 |01:56.5| 28.3| 165 | 174 | 9.1 - tailwind

03|00500| 01:58 |01:58.4| 27.9| 165 | 174 | 9.1 - tailwind

04|00500| 02:06 |02:06.0| 27.1| 167 | 175 | 8.8 - headwind

05|00500| 02:04 |02:04.5| 28.0| 167 | 176 | 8.6 - headwind

06|00500| 02:00 |02:00.5| 27.9| 163 | 173 | 8.9 - tailwind

07|00500| 01:59 |01:59.0| 27.7| 162 | 174 | 9.1 - tailwind

08|00500| 02:01 |02:01.2| 28.2| 160 | 172 | 8.8 - tailwind

Workout Summary

--|04000| 16:05 |02:00.6| 27.8| 164 | 176 | 8.9
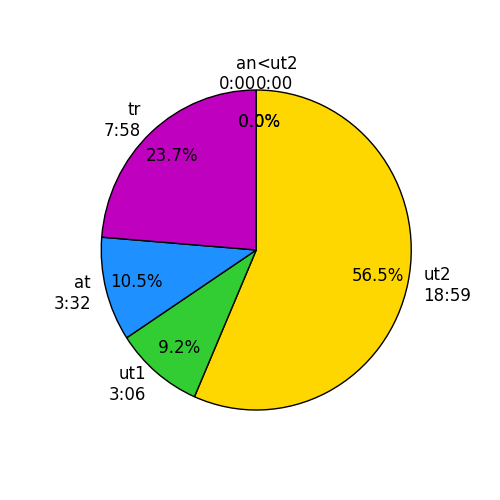
The last time I did this workout was in June. Then I managed a 1:58 average at a stroke rate of 30spm. Today was a 2:01 average at 28spm. Sounds similar to me.
Also the pie chart looks similar:

I didn’t like how I was rowing. I had difficulty rating up and somehow I didn’t manage to get in the right rhythm. In the fourth rest period I understood why. I looked at my oarshaft and noticed I was rowing with a pair of sculls from our double. I have gotten used to the low-i sculls that I use in the single, and the normal sculls are now … different.
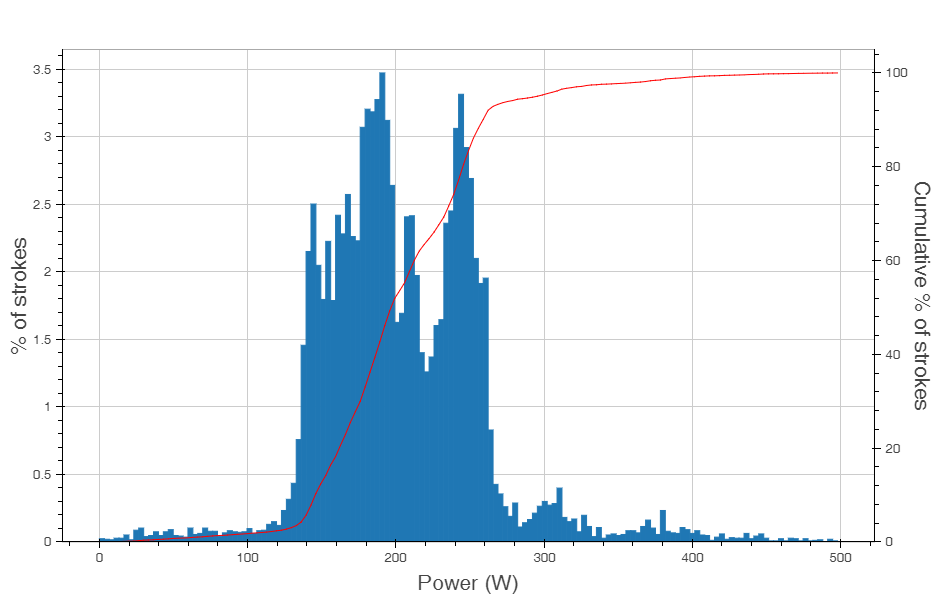
On rowsandall.com, I am working on a histogram of all erg strokes over a period of the past 12 months. Here is a prototype graph for my sessions:

The data are not really representative, because since the inception of rowsandall.com I have mainly rowed on the water, but still it’s an interesting graph to look at and see evolve over time. The beta testers had a lot of fun comparing each other’s graphs. One of the uses could be to check if you are really adhering to a polarized training plan.
Follow me in social media
Like this:
Like Loading...
Sep 20 2016
Monday: 8x500m OTW
This week is a weird week. In my preparation for the 6km head race of October 7, I plan this as an intensive week, but at the same time we are getting guests from Wednesday afternoon to Sunday morning. Therefore, I had to plan my training with all OTW and the most important sessions on Monday to Wednesday.
Originally I wanted to do a 4x2km but I changed to 8x500m in the last minute, for three reasons:
When I set out the lake was mirror flat, but as usual ripples started to form during the warming up.
I used the pre-programmed 8×500/2:30 rest from the SpeedCoach, failing to remember that the speedcoach doesn’t record data during the ‘rest’ period (they say that will be fixed in the next firmware update). The weather report for my location was:
Summary for your location at 2016-09-19T05:43:09Z: Mostly Cloudy. Temperature 54.19F/12.3C. Wind: 1.27 m/s. Wind Bearing: 22 degrees
I think that is about right. Seems consistent with my own observations.
Work Details
#-|SDist|-Split-|-SPace-|-SPM-|AvgHR|MaxHR|DPS-
01|00500| 01:58 |01:58.7| 27.3| 160 | 170 | 9.3 - tailwind
02|00500| 01:56 |01:56.5| 28.3| 165 | 174 | 9.1 - tailwind
03|00500| 01:58 |01:58.4| 27.9| 165 | 174 | 9.1 - tailwind
04|00500| 02:06 |02:06.0| 27.1| 167 | 175 | 8.8 - headwind
05|00500| 02:04 |02:04.5| 28.0| 167 | 176 | 8.6 - headwind
06|00500| 02:00 |02:00.5| 27.9| 163 | 173 | 8.9 - tailwind
07|00500| 01:59 |01:59.0| 27.7| 162 | 174 | 9.1 - tailwind
08|00500| 02:01 |02:01.2| 28.2| 160 | 172 | 8.8 - tailwind
Workout Summary
--|04000| 16:05 |02:00.6| 27.8| 164 | 176 | 8.9
The last time I did this workout was in June. Then I managed a 1:58 average at a stroke rate of 30spm. Today was a 2:01 average at 28spm. Sounds similar to me.
Also the pie chart looks similar:
I didn’t like how I was rowing. I had difficulty rating up and somehow I didn’t manage to get in the right rhythm. In the fourth rest period I understood why. I looked at my oarshaft and noticed I was rowing with a pair of sculls from our double. I have gotten used to the low-i sculls that I use in the single, and the normal sculls are now … different.
On rowsandall.com, I am working on a histogram of all erg strokes over a period of the past 12 months. Here is a prototype graph for my sessions:
The data are not really representative, because since the inception of rowsandall.com I have mainly rowed on the water, but still it’s an interesting graph to look at and see evolve over time. The beta testers had a lot of fun comparing each other’s graphs. One of the uses could be to check if you are really adhering to a polarized training plan.
Follow me in social mediaShare this:
Like this:
By sanderroosendaal • Uncategorized • 1 • Tags: 8x500, lake, OTW, rowing, single, training