Jan 22 2016
Plan, Periodise, Train, Adjust and Win Part II
On December 18th, 5 weeks ago, I did the two speed lactate test. Read my blog of 18 December about it.
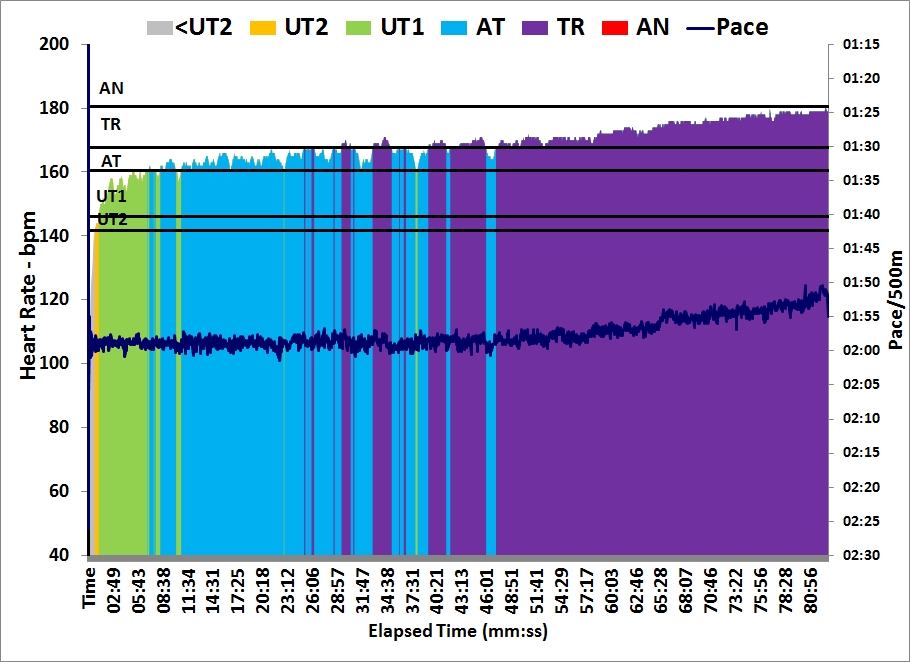
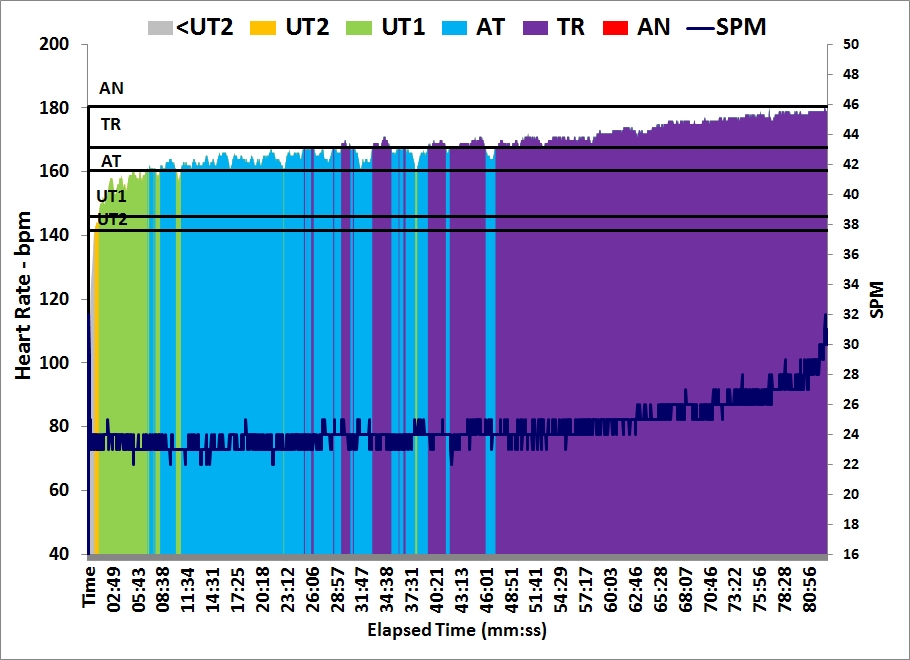
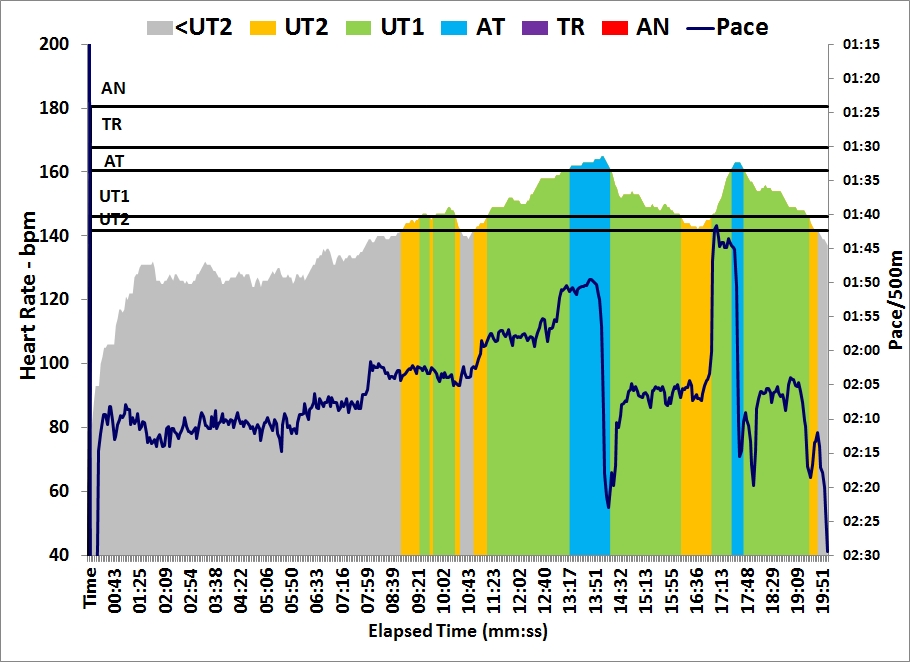
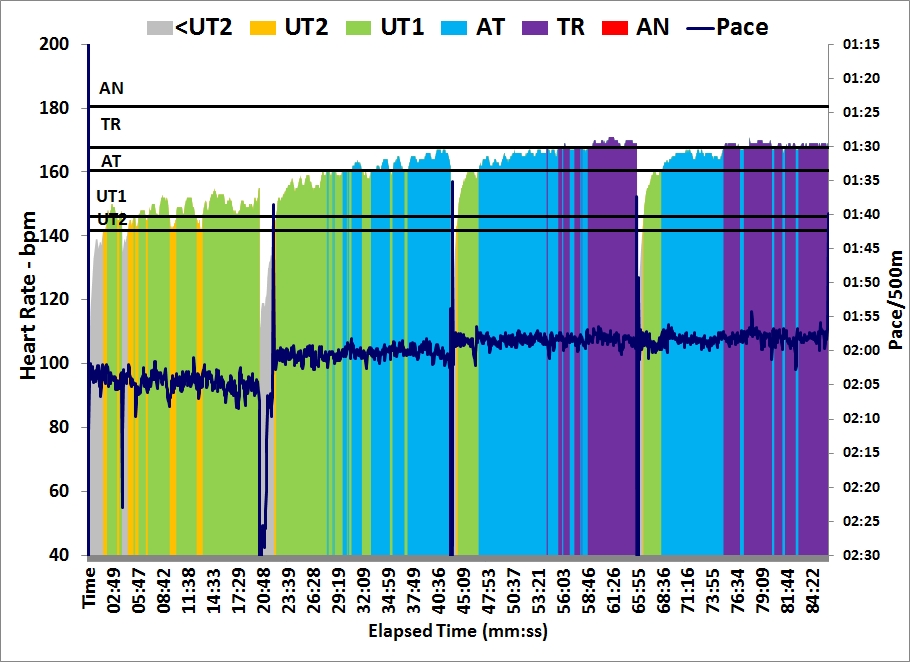
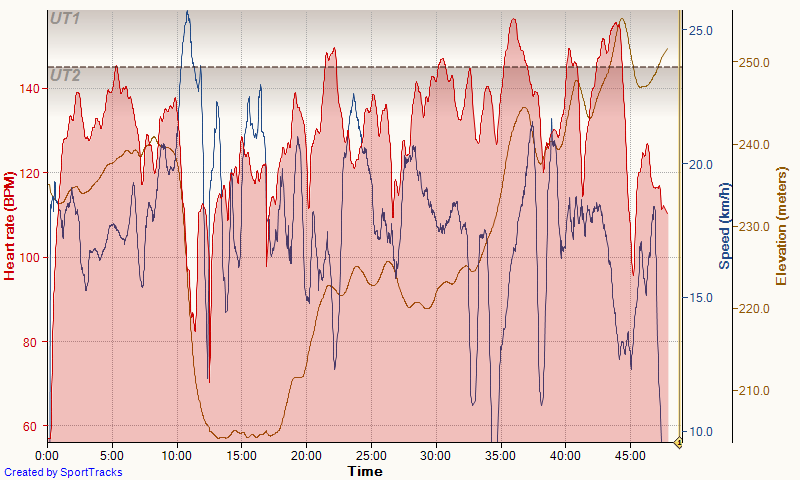
Today, I planned to repeat it. I tried to copy the protocol as much as possible. So first a Fletcher warming up:
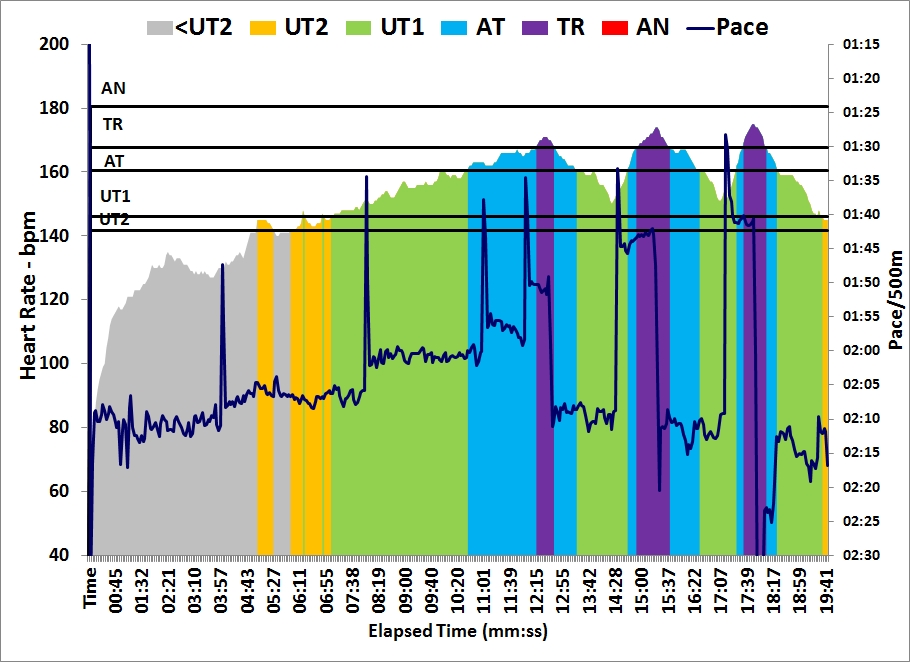
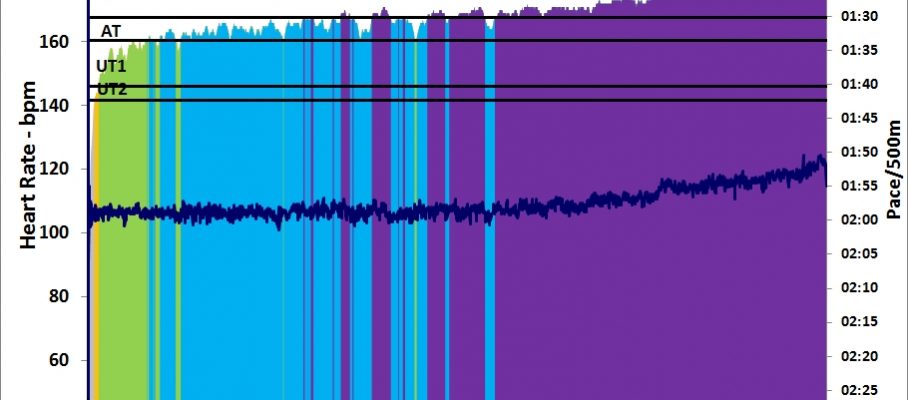
Higher heart rates than 5 weeks ago.
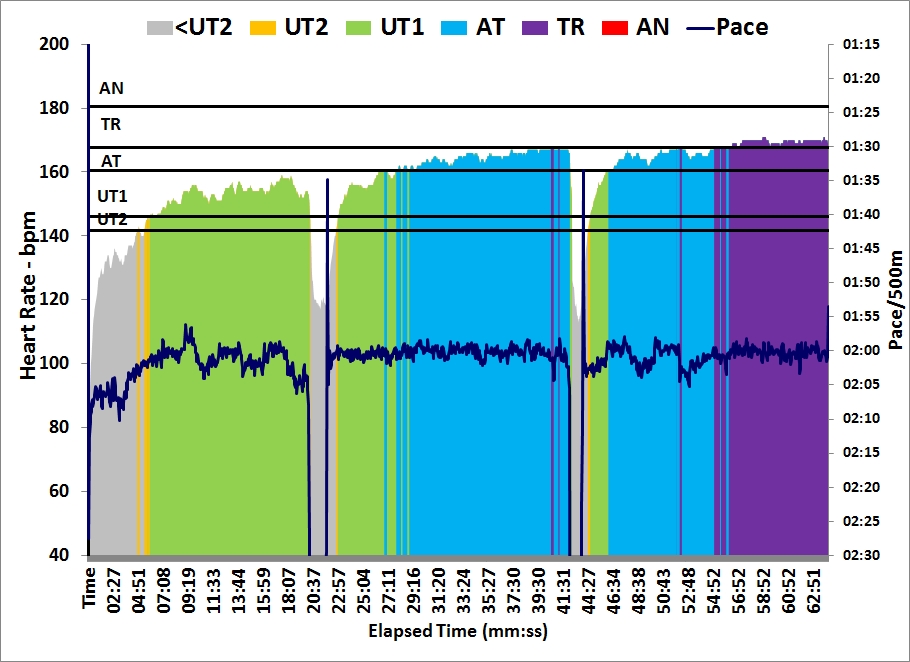
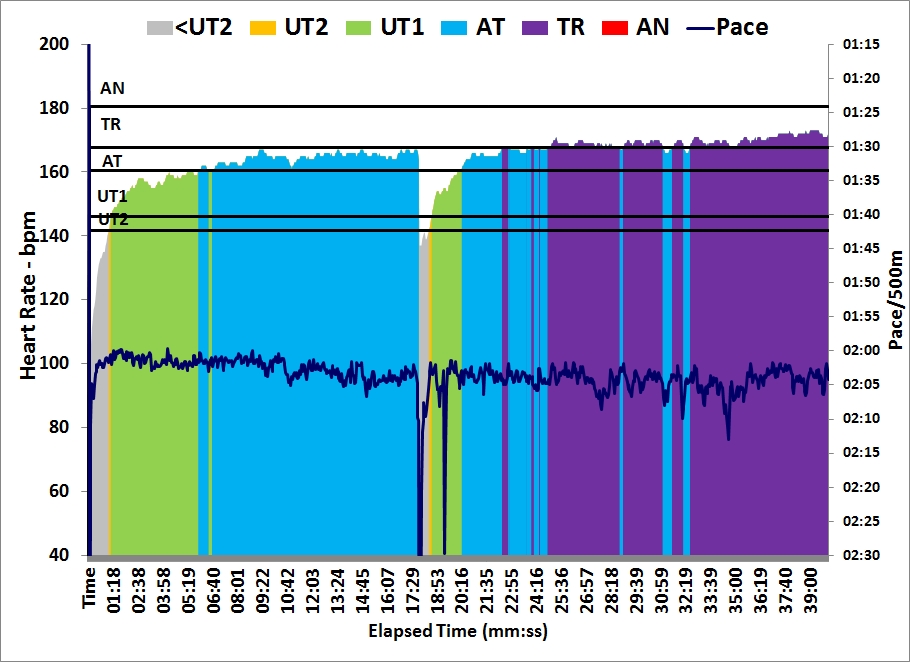
Then the main event, two 1k tests spaced 15 minutes apart. The first one at head race pace. Second one at 2k pace or faster (full out allowed). I looked up my stroke rate of 5 weeks ago. They were 27 spm for the first one and 31 spm for the second one.
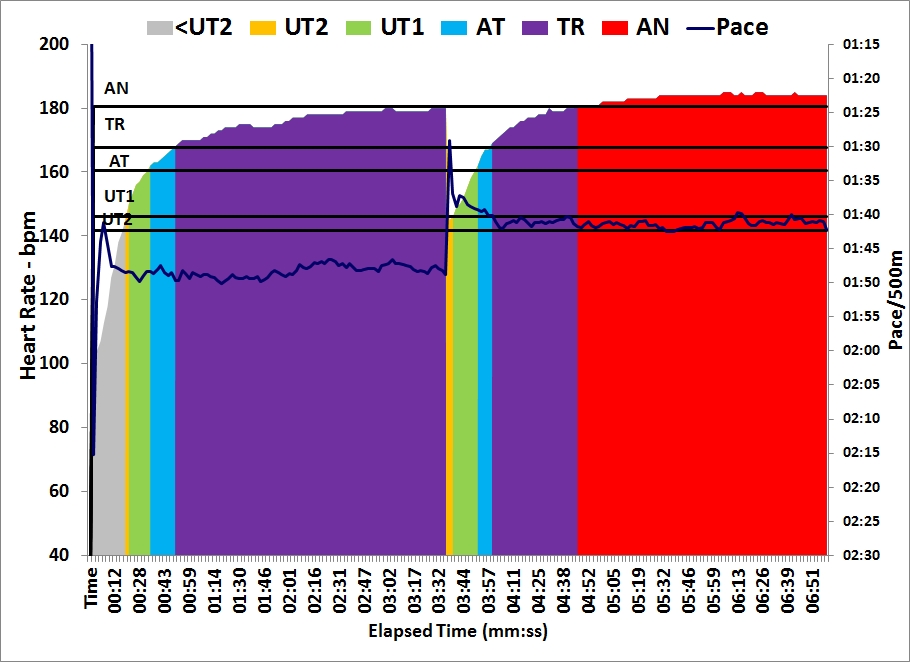
Again, a higher heart rate in the second 1k.
Workout Summary - Jan 22, 2016

--|Total|-Total-|--Avg--|-Avg-|Avg-|-Avg-|-Max-|-Avg

--|Dist-|-Time--|-Pace--|Watts|SPM-|-HR--|-HR--|-DPS

--|02000|06:58.5|01:44.6|305.6|29.5|173.9|185.0|09.7

Workout Details

#-|SDist|-Split-|-SPace-|Watts|SPM-|AvgHR|MaxHR|DPS-|Comments

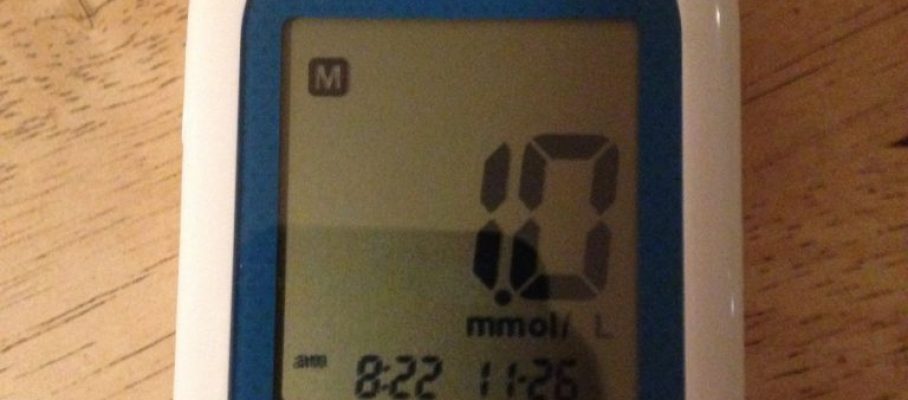
01|01000|03:36.5|01:48.3|275.8|27.4|168.7|180.0|10.1| 2.6 mmol/L (1.9)

02|01000|03:22.0|01:41.0|339.9|31.8|178.8|185.0|09.3| 4.1 mmol/L (3.2)
So, compared to 5 weeks ago, there are the following differences:
- 2 seconds faster split on the first 1k (stroke rate 0.4 spm up)
- HR 10 bpm higher on the first 1k
- Lactate 0.4 mmol/L lower after the first 1k
- 2.3 seconds faster split on the second 1k (stroke rate 1 spm up)
- HR 7 bpm higher on the 2nd 1k
- Lactate 0.4 mmol/L lower
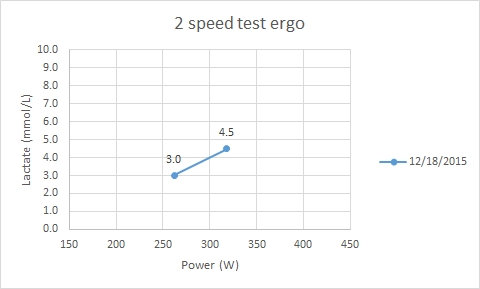
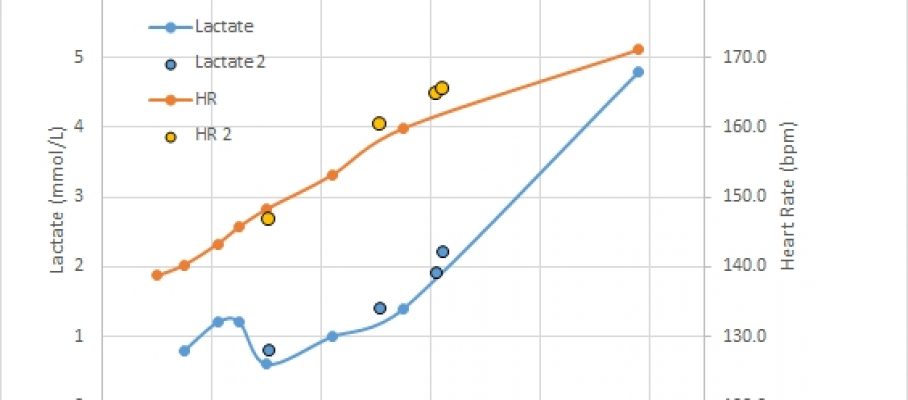
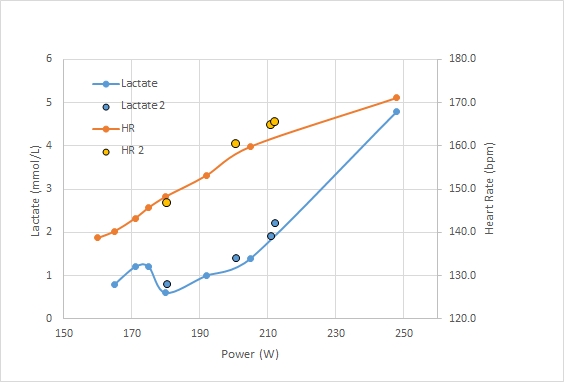
So I am faster at lower lactate but higher heart rate. This sounds plausible. For the aerobic energy path way, the heart rate has to go up when delivering higher power.
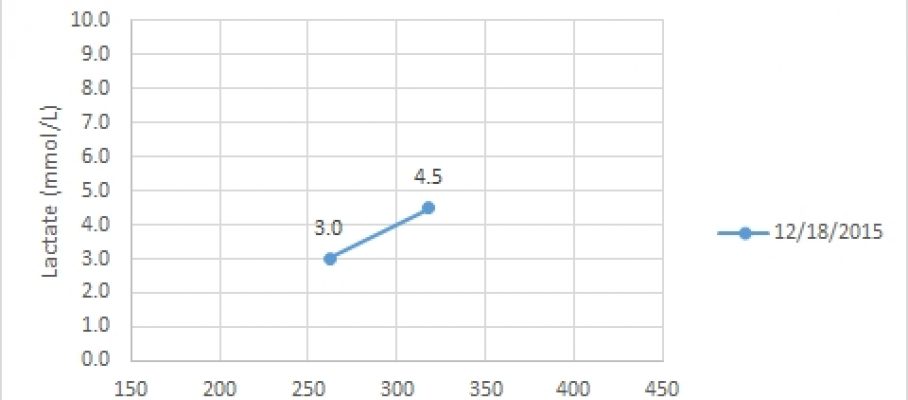
In a graph, it looks like this:
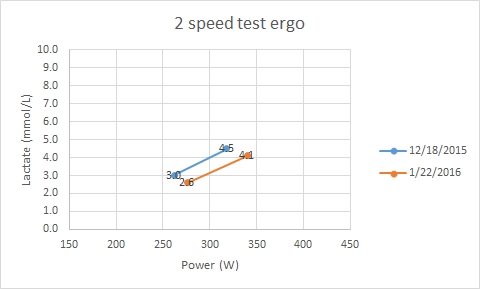
To be honest, I had hoped for a right shifted first point and a steeper curve. You can’t say I didn’t try. The second 1k is a Season’s Best.
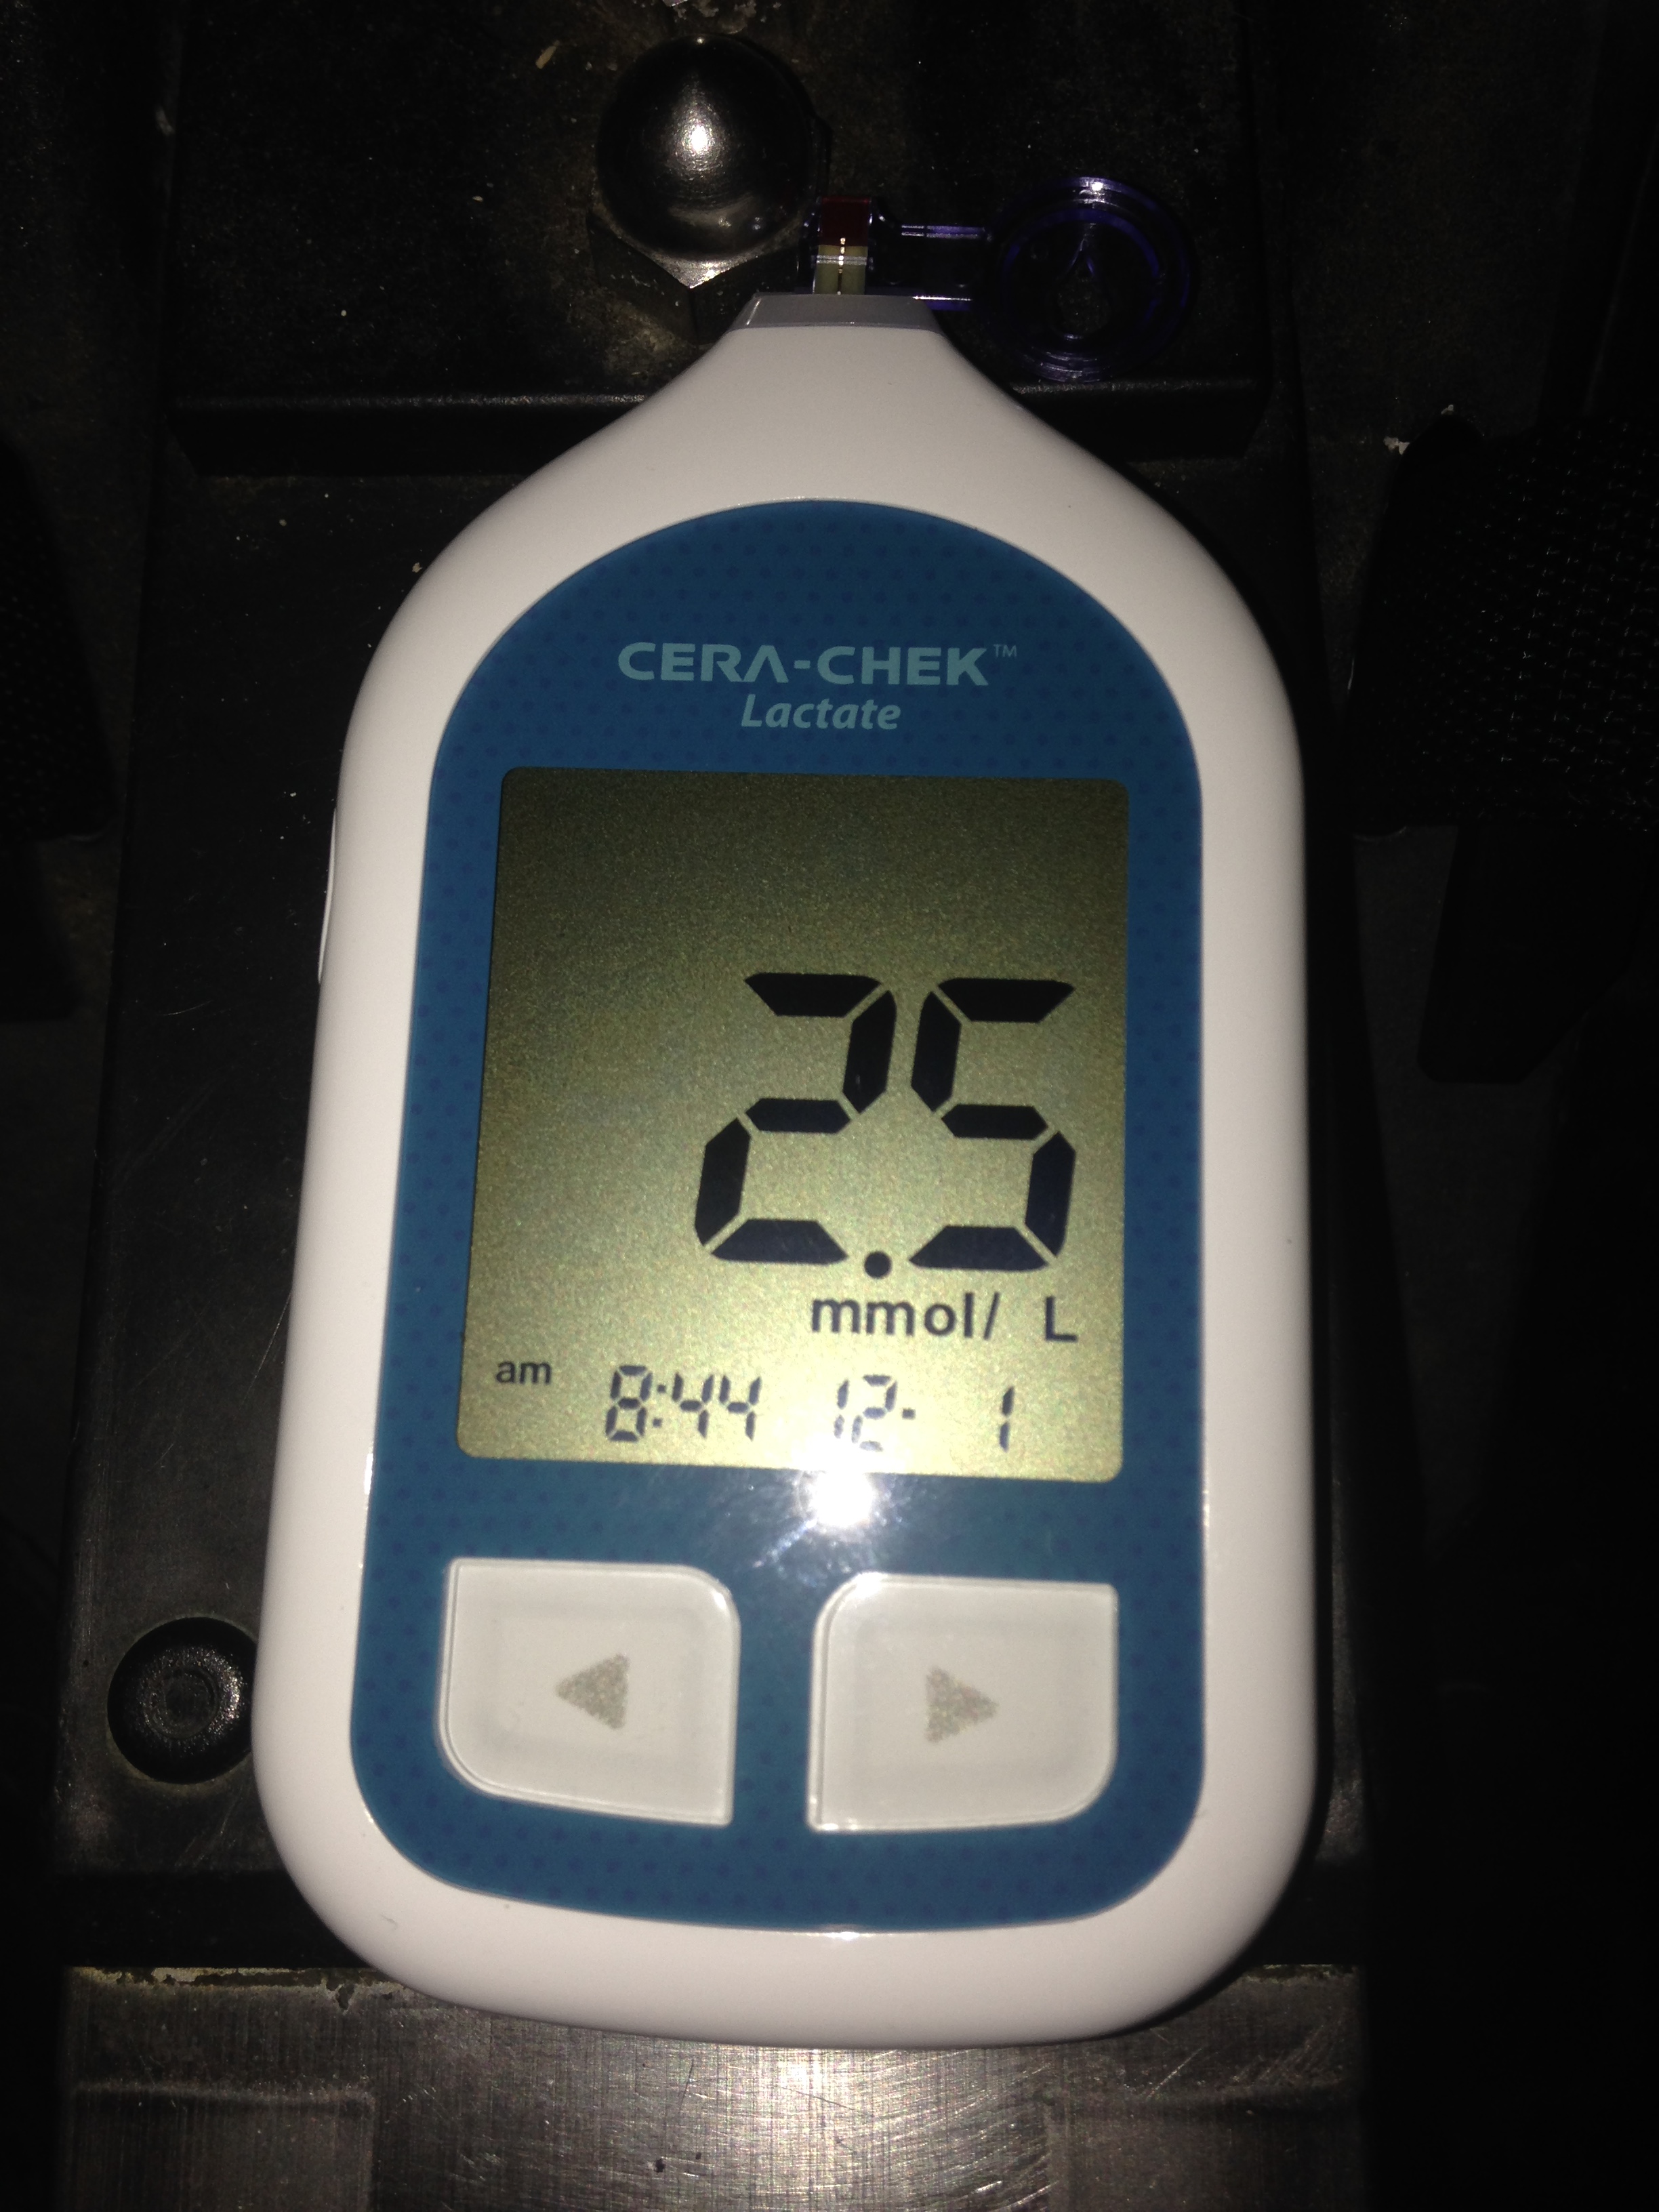
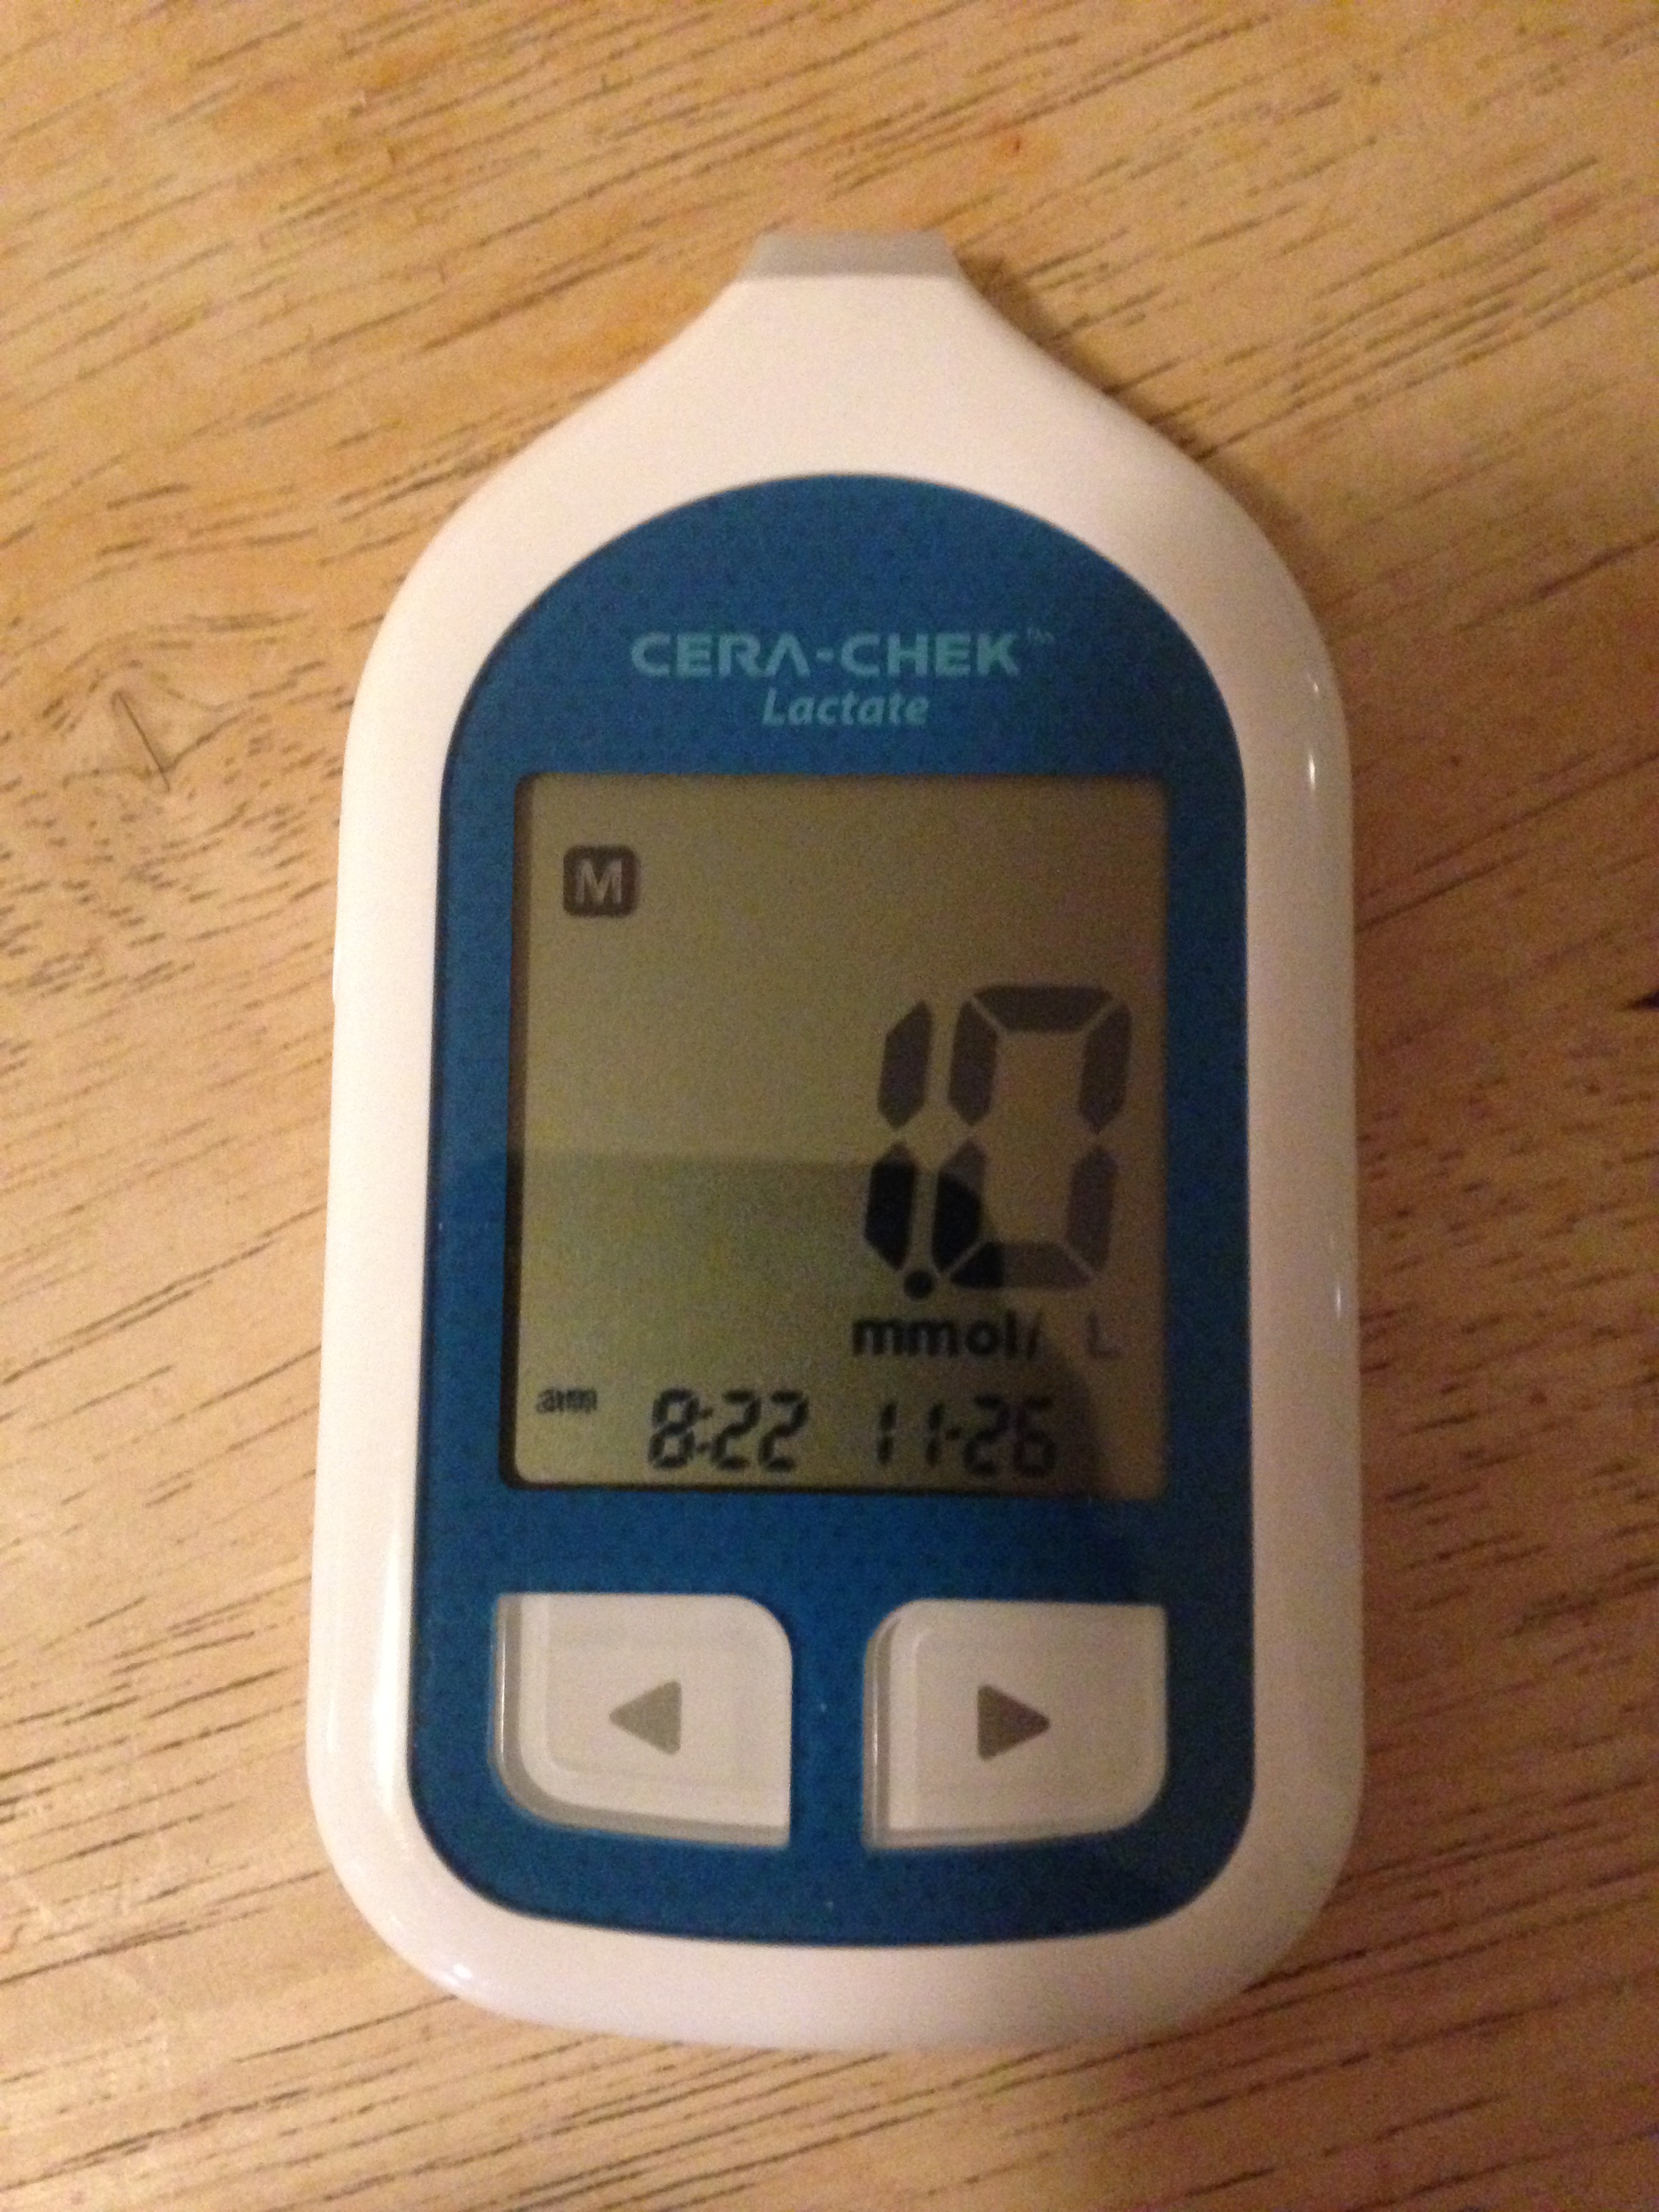
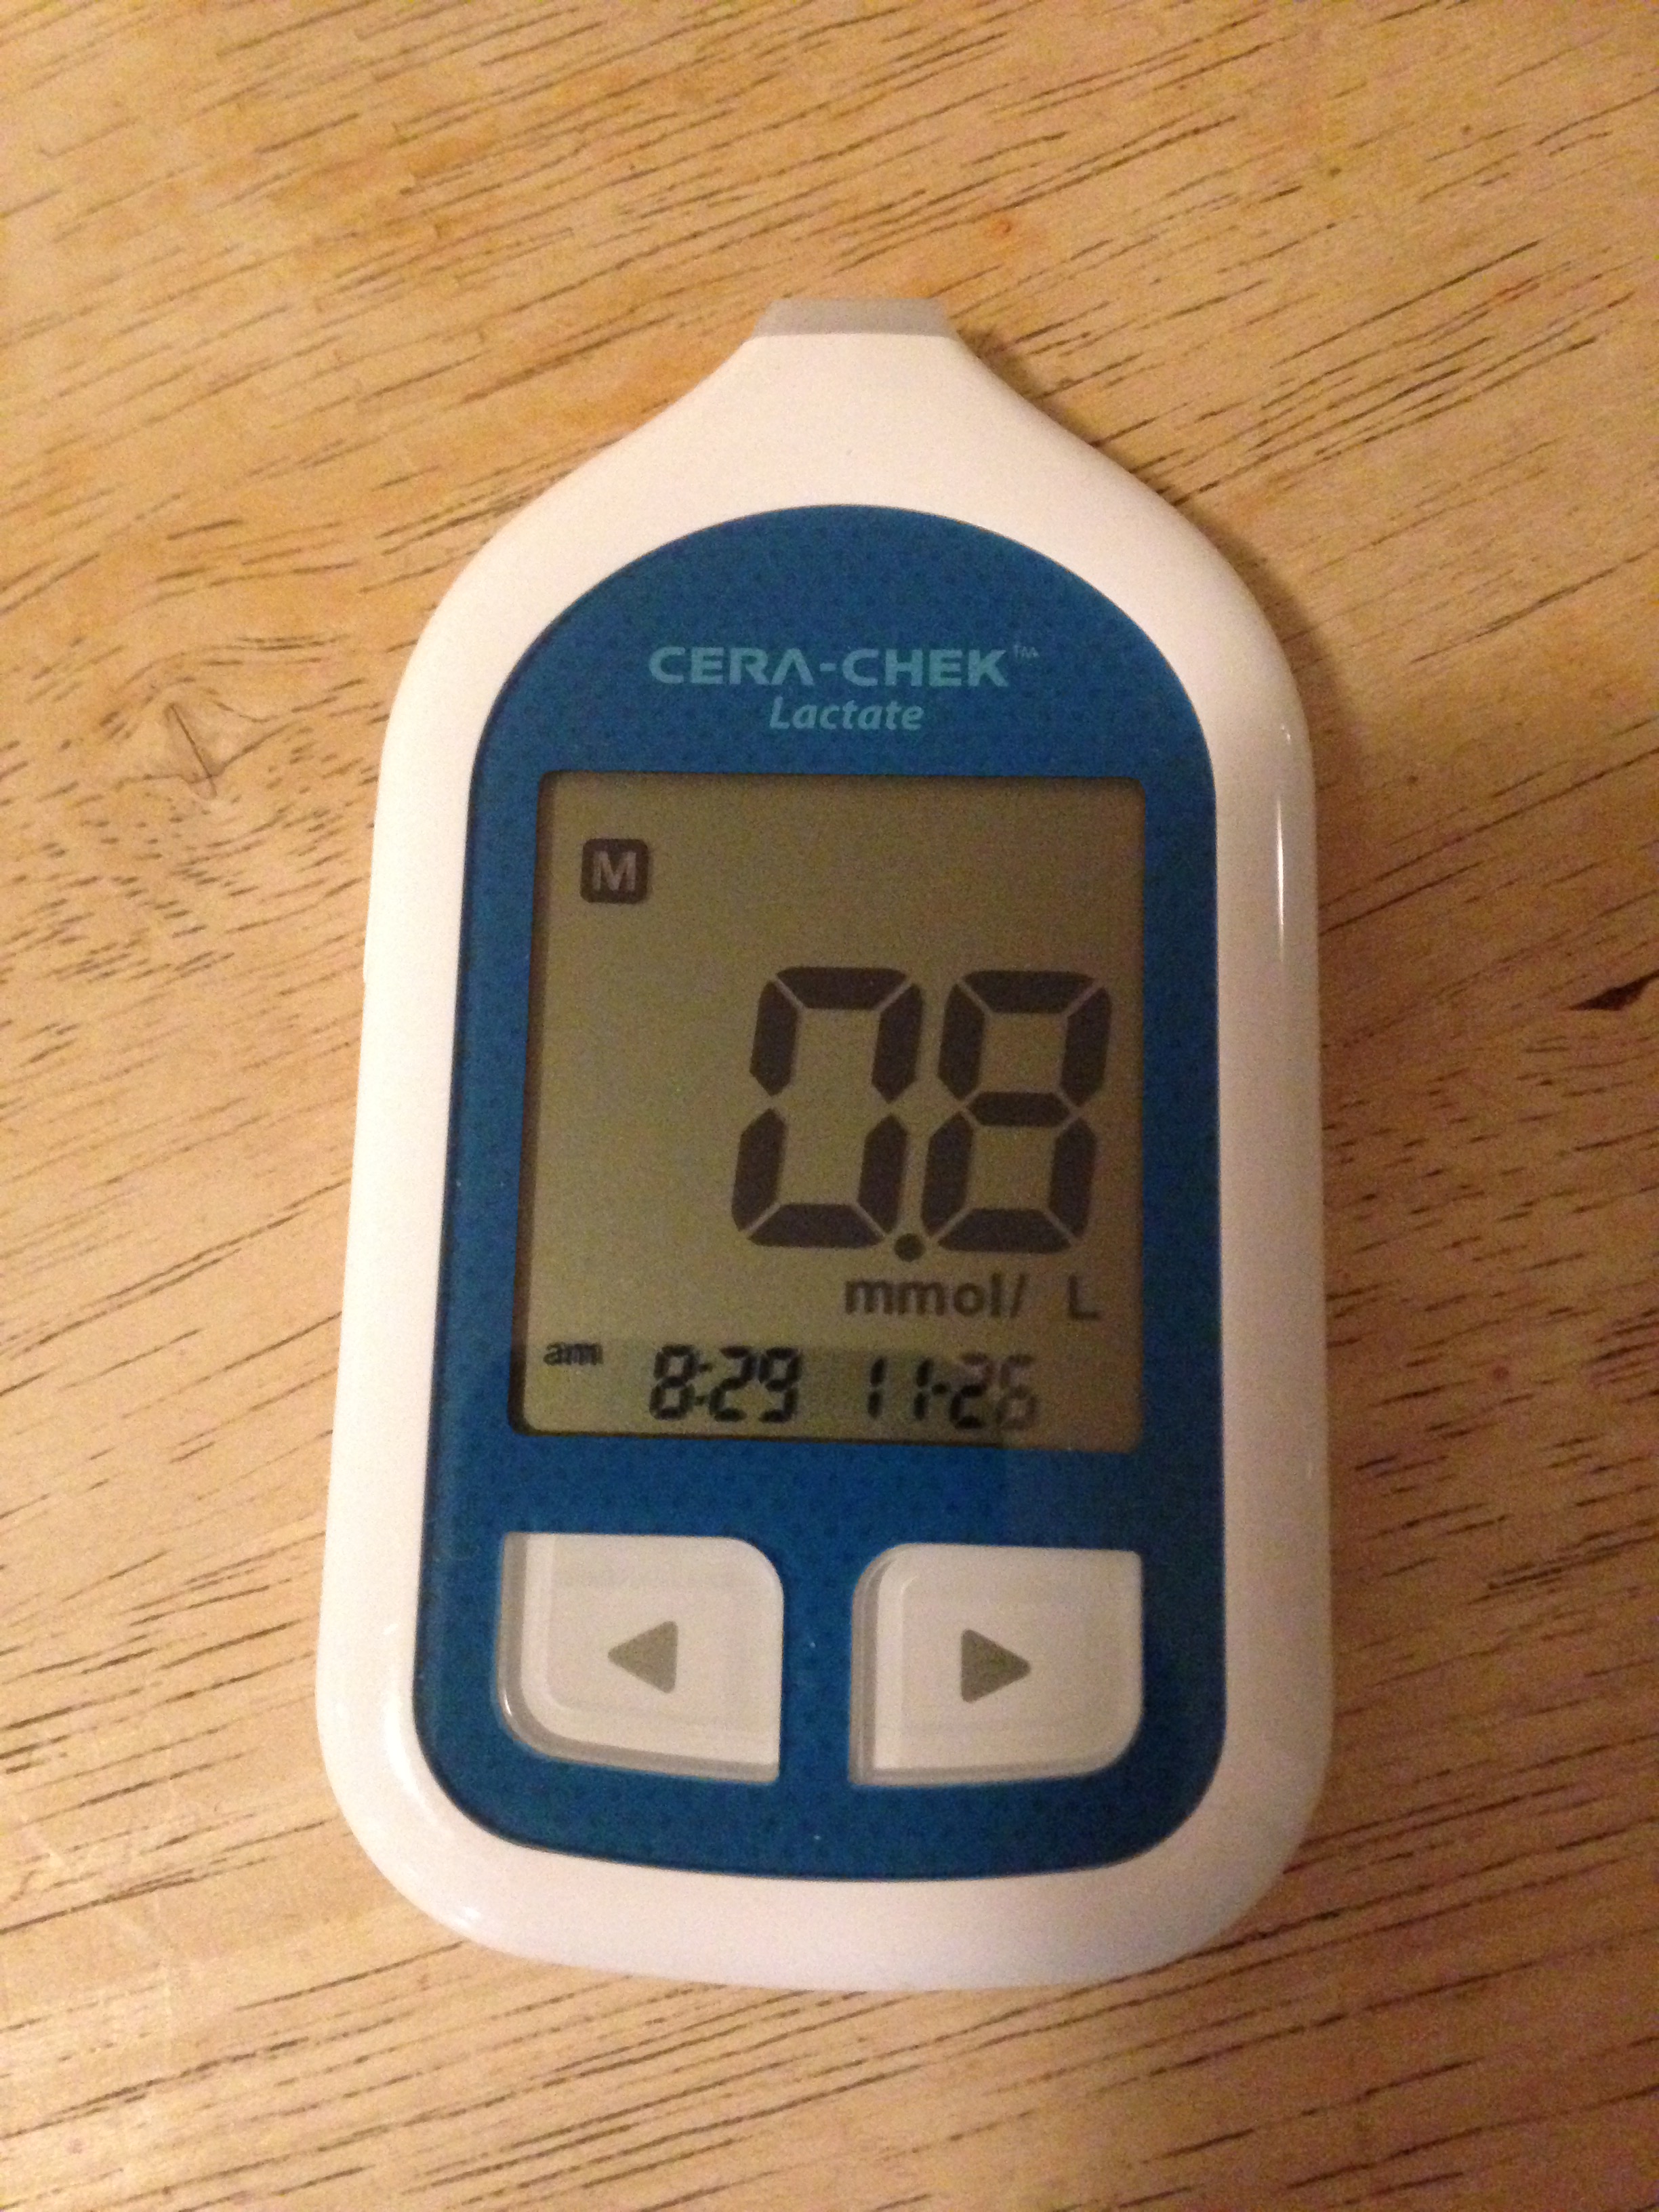
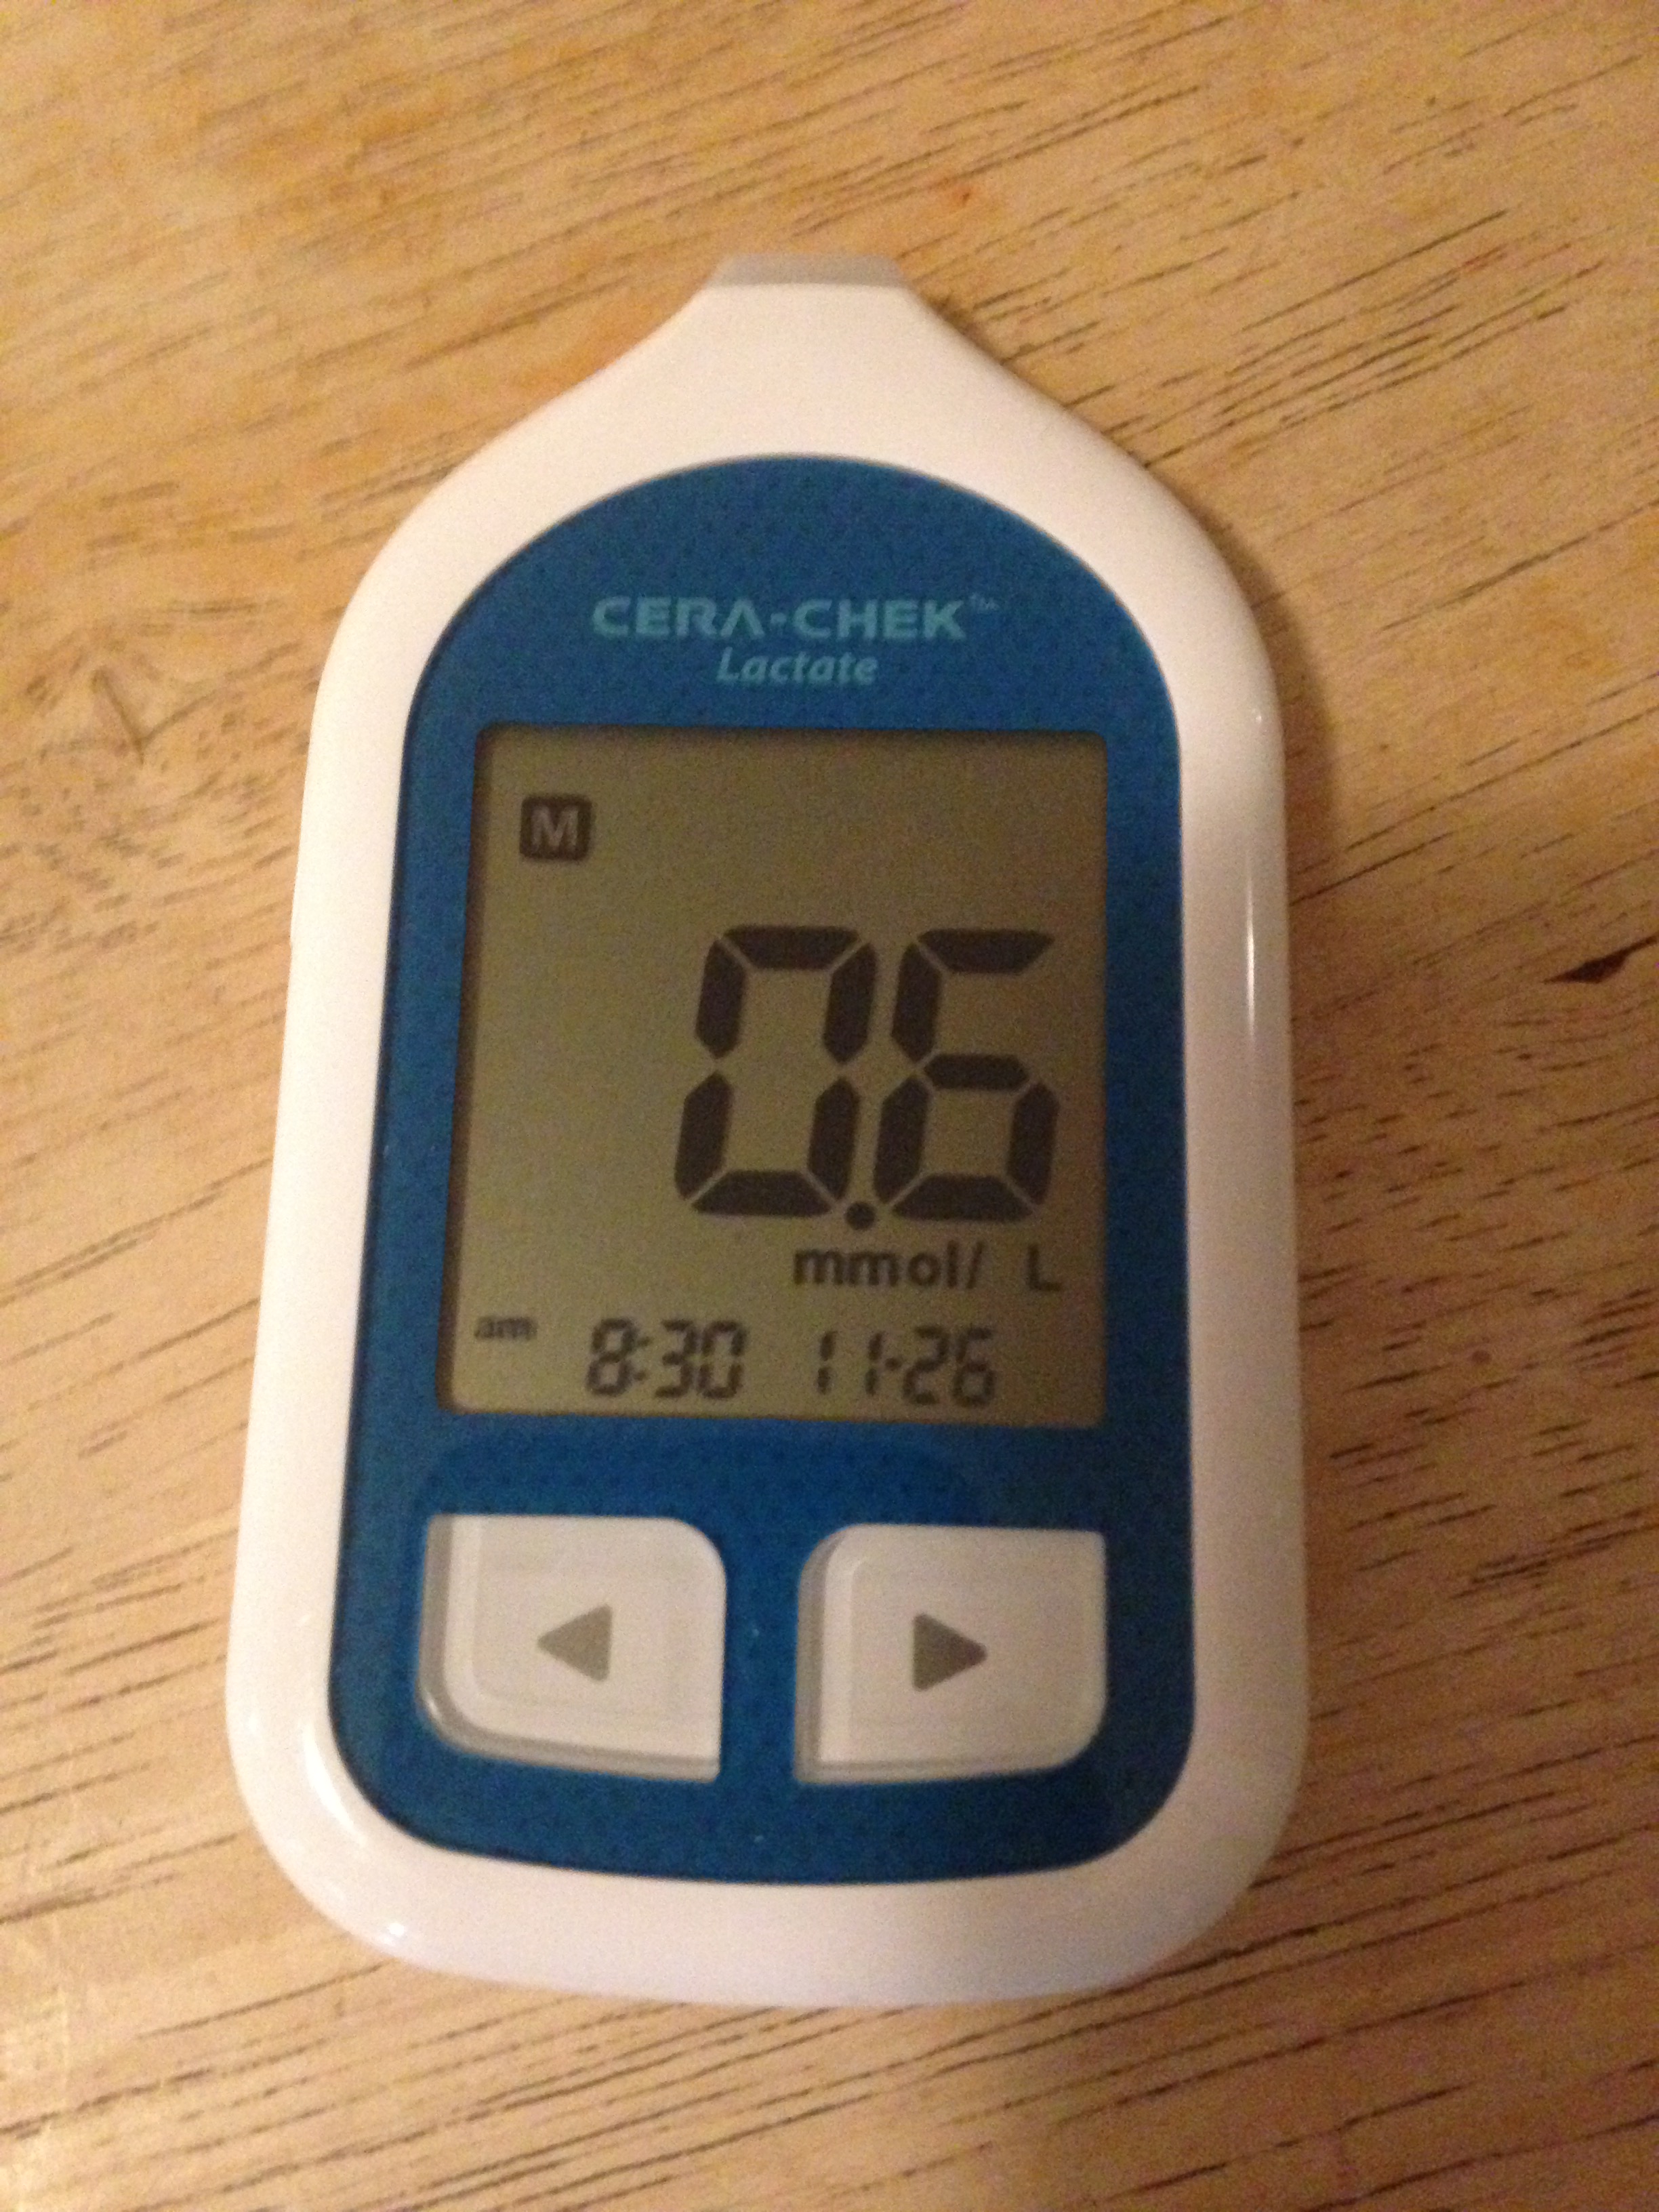
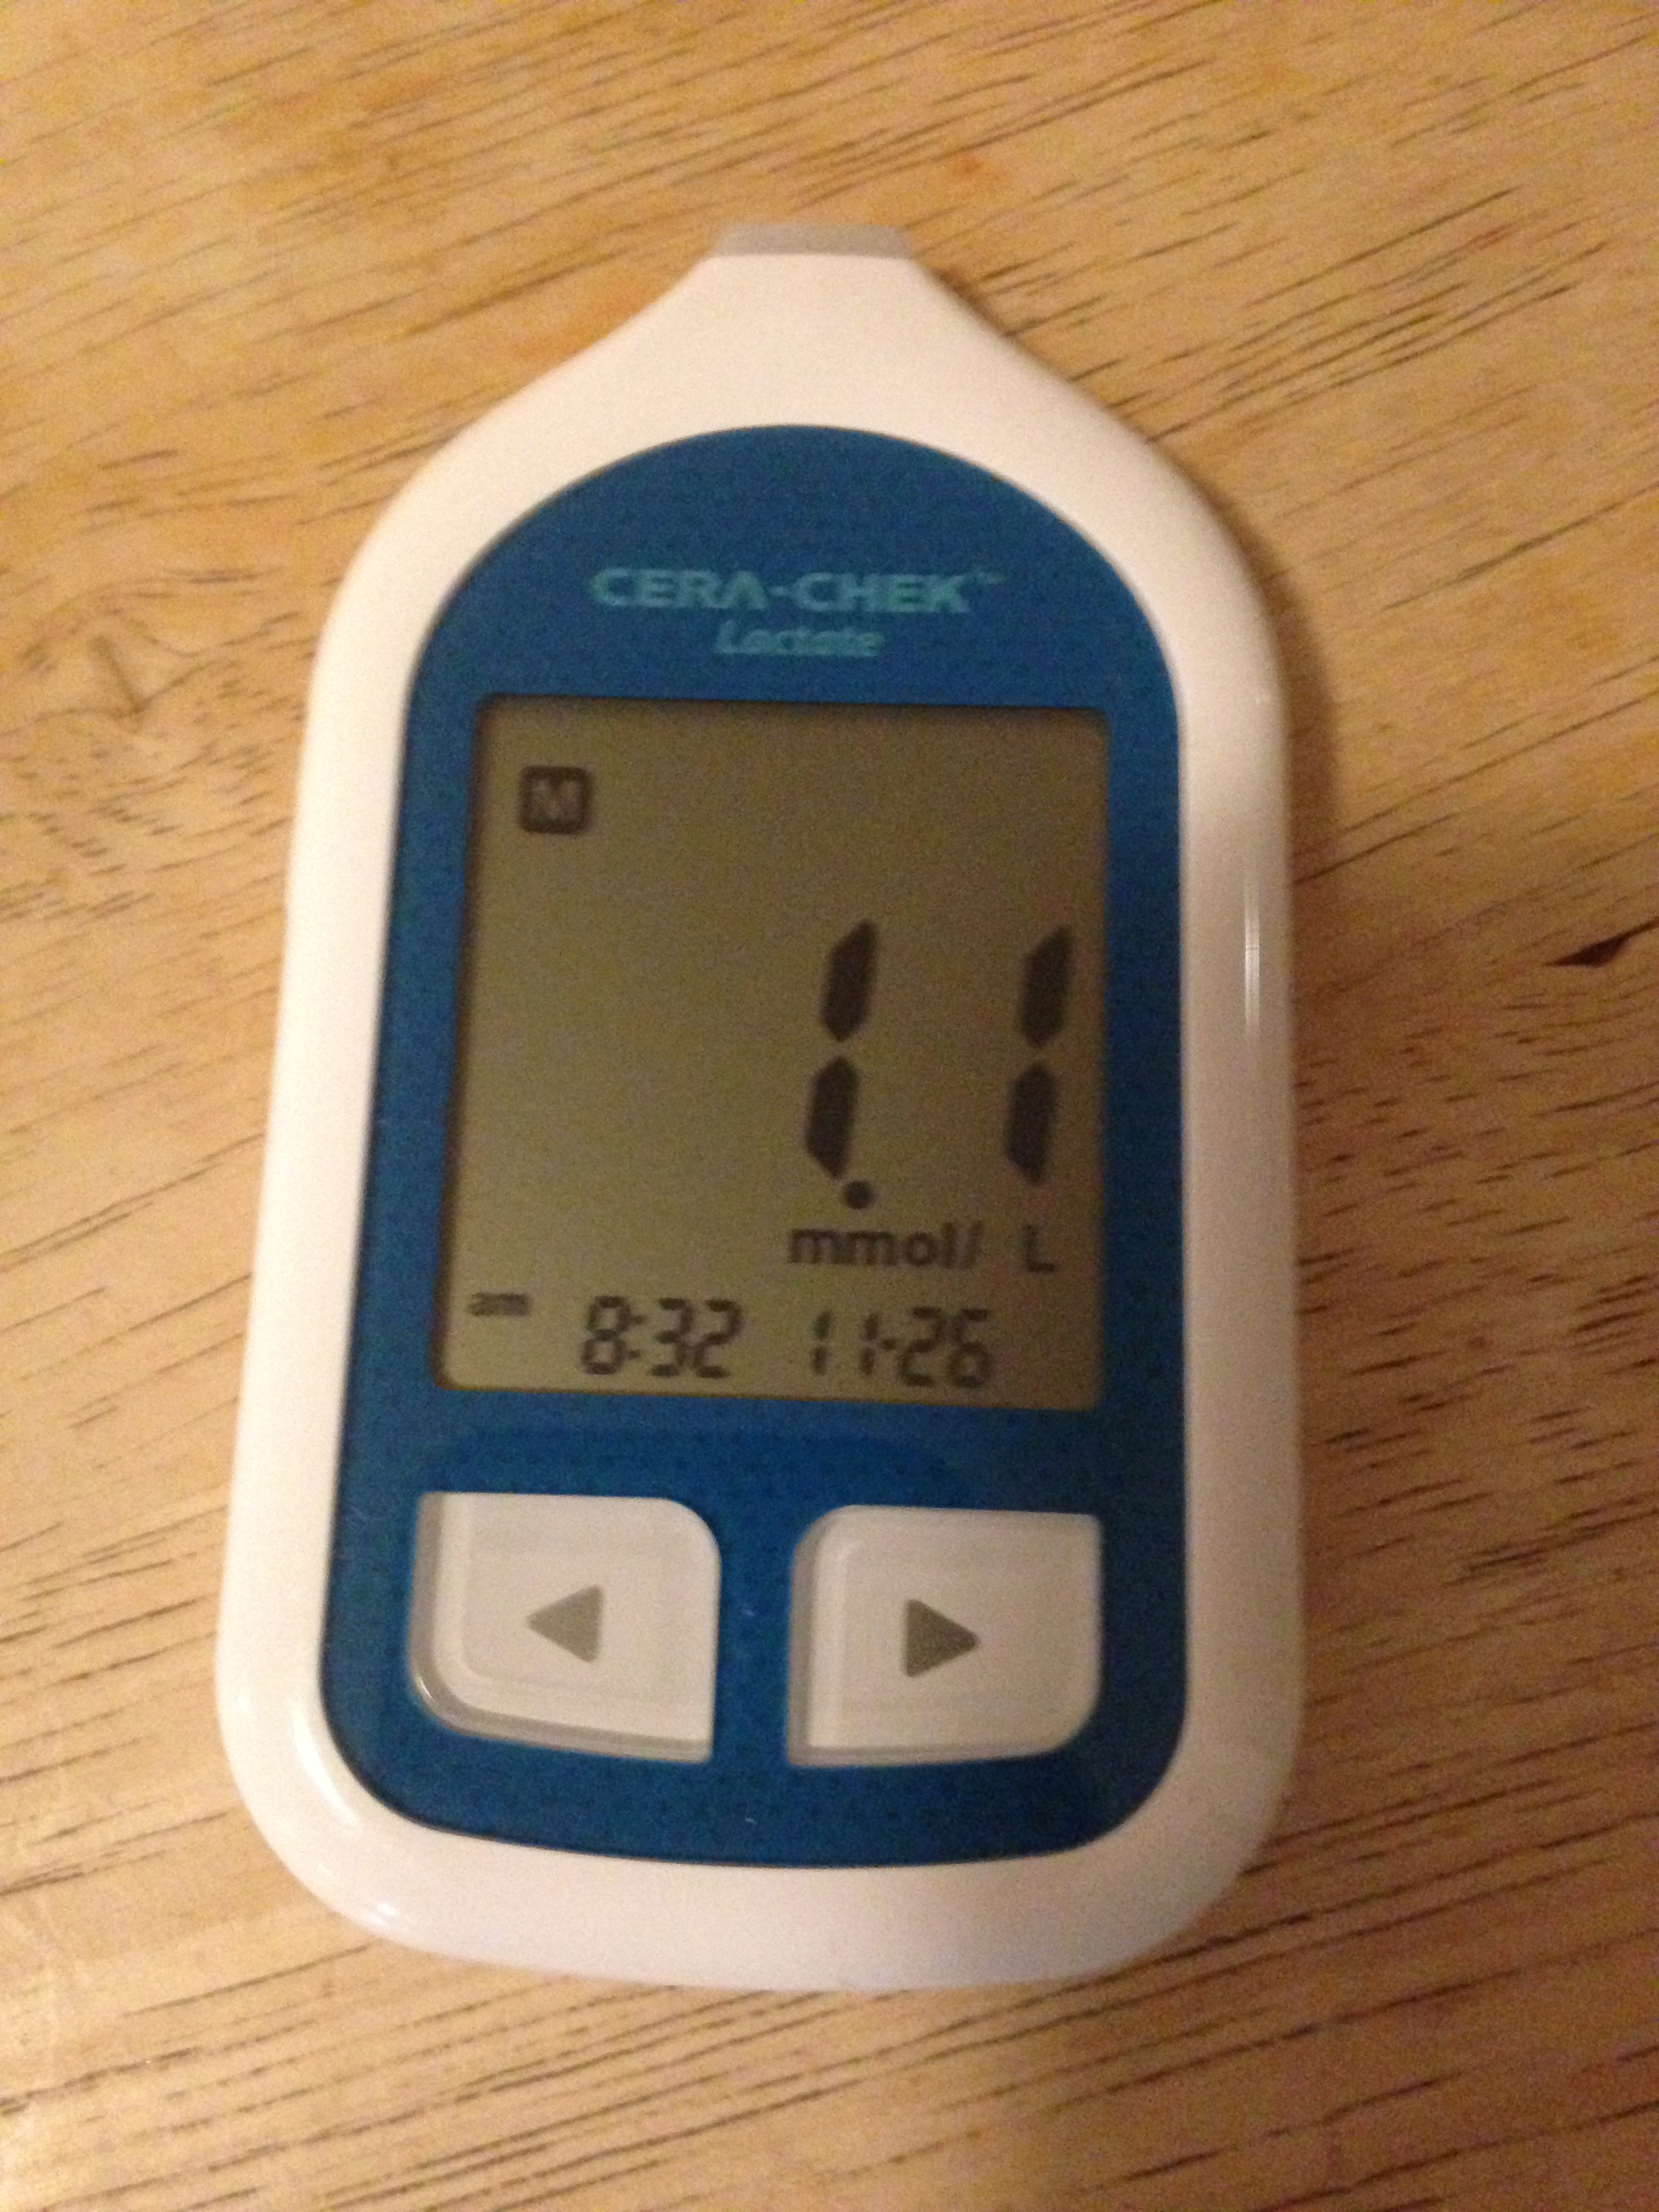
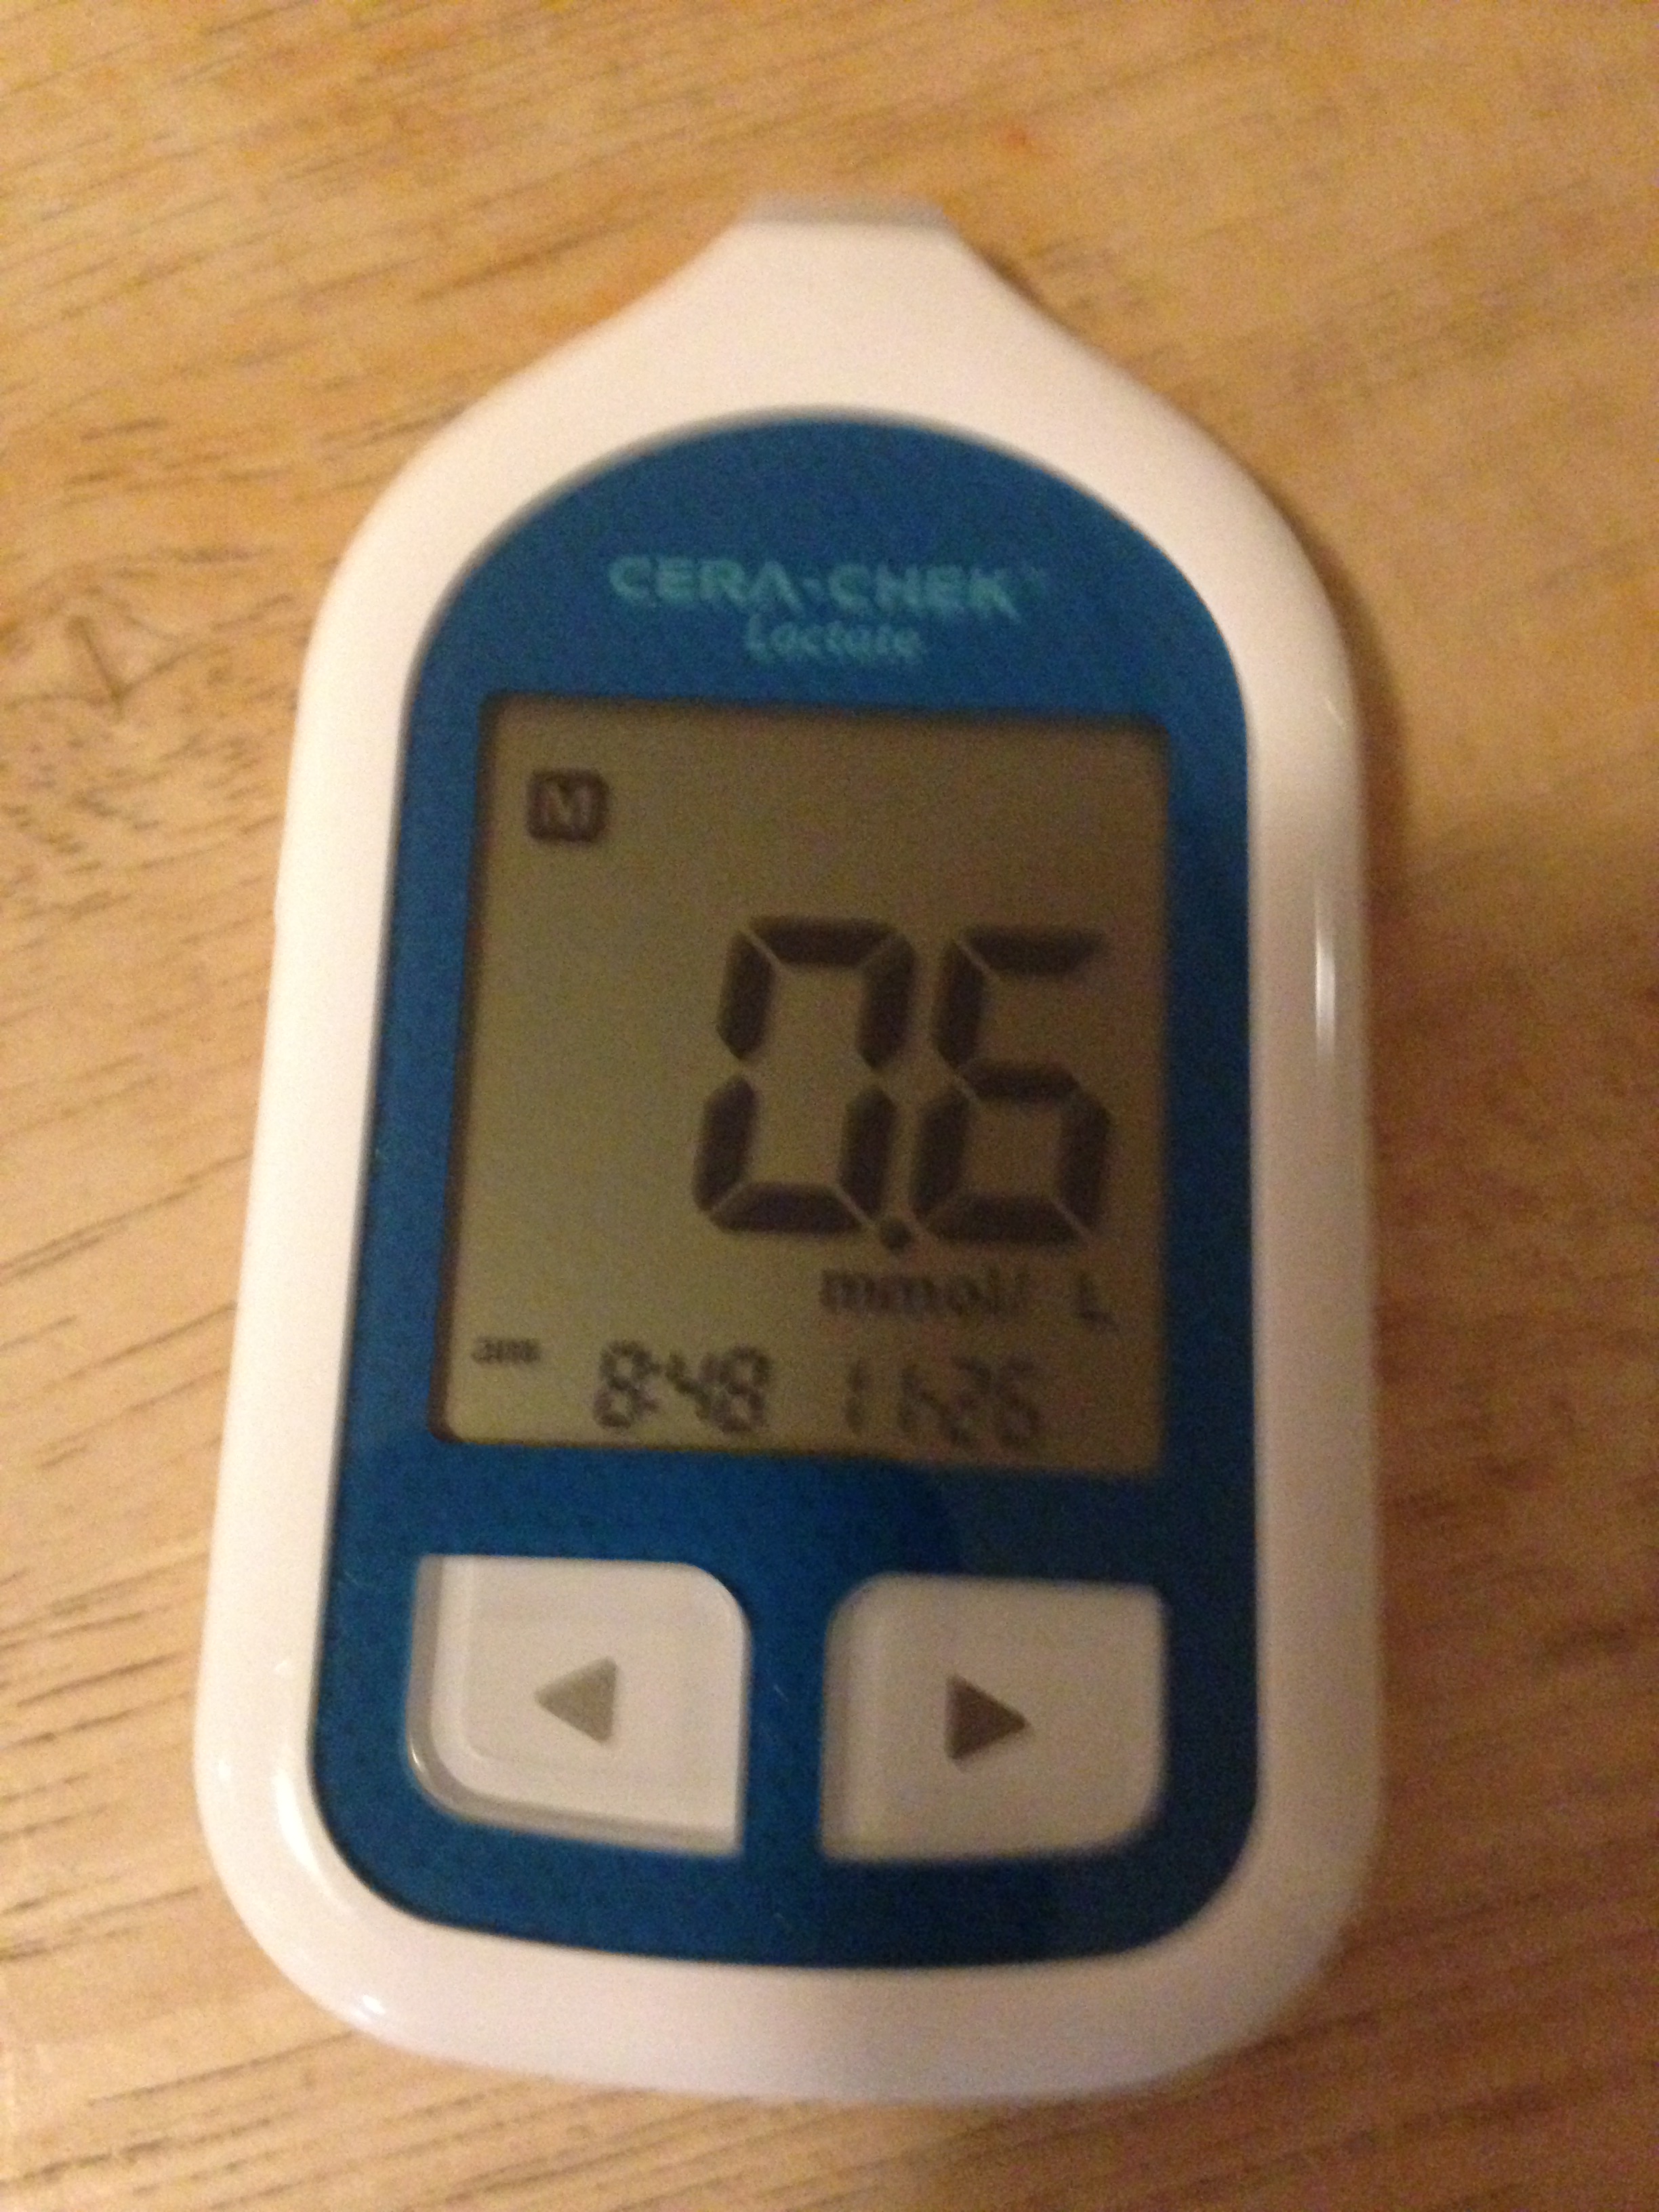
I did another lactate test after a 2k cooling down. 2.3 mmol/L
So I guess my aerobic fitness has increased. Next test in 5 weeks.

Feb 17 2016
Trabant to Ferrari part 2
Monday
Flight to Brussels. Sit in hotel room to prepare meeting. No training. Rest day.
Tuesday
Before work, I spent an hour in the hotel fitness. A thought crossed my mind: How many marathons have I run on these two treadmills in this particular hotel? Difficult to estimate. I ran for 20 minutes, then did a 40 minute strength session, partly exercise machine, partly body weight.
Tough negotiations at which I cannot say anything. Except perhaps that I personally managed to stall the negotiations for 4 hours. I won’t say what I think about the outcome. Mystery, mystery.
Dinner in Brussels with my sister. We had a good time.
Wednesday
Up at 4AM to catch the flight home. A long day.
Despite travel tiredness and noticable DOMS in shoulders, legs and arms from yesterday’s strength training, I decided that today was the day I would repeat the 1 minute test I did in november, described in this post. Here’s the graph from back then:
Here is the graph from today (blue curve today, dark green curve November):
Here is a table comparing the results:
The targets are from the “Rowing Faster” book and are an age-corrected range for lightweight male rowers. Still at the bottom of the range. Somehow my “peak power” has decreased, although I think it is more an artifact of the November test, where I basically hit 611 W in the first stroke and then dropped to 550W in the next stroke. Today, I started low (500W and then brought it up to 550 and held it for ten strokes. After about 30 seconds the two curves are suspiciously close. One could even call them “identical”.
Improved the average power by 17W. Not sure how significant that is. The drop off times and value are influenced quite a lot by the peak power. Perhaps I did the test wrong today. Not sure. Looking purely at the graphs, I think I should conclude I am slightly better in terms of “average power over first 10 seconds” and the overall level of the curve is significantly higher in the first 30 seconds.
Next test for this week: A full out 6K. Should be a PB attempt.
By sanderroosendaal • Uncategorized • 1 • Tags: anaerobic, concept2, erg, OTE, rowing, testing