Apr 15 2016
The 2 speed test again
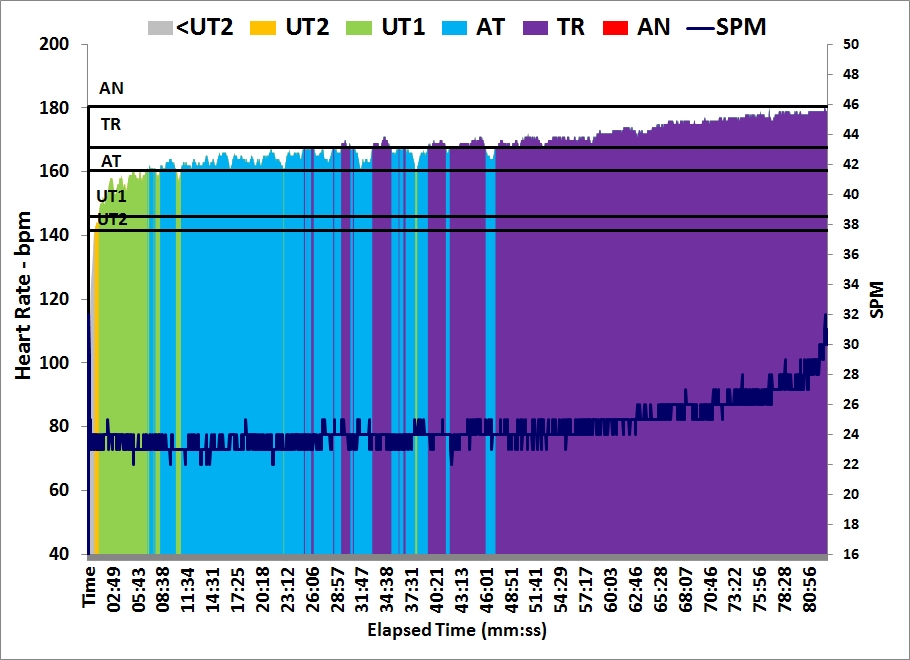
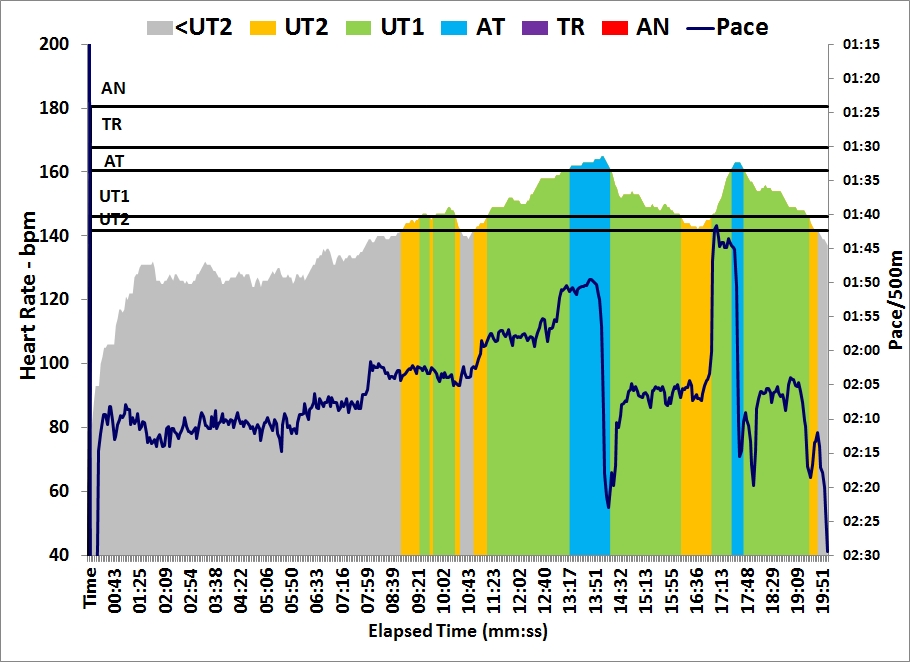
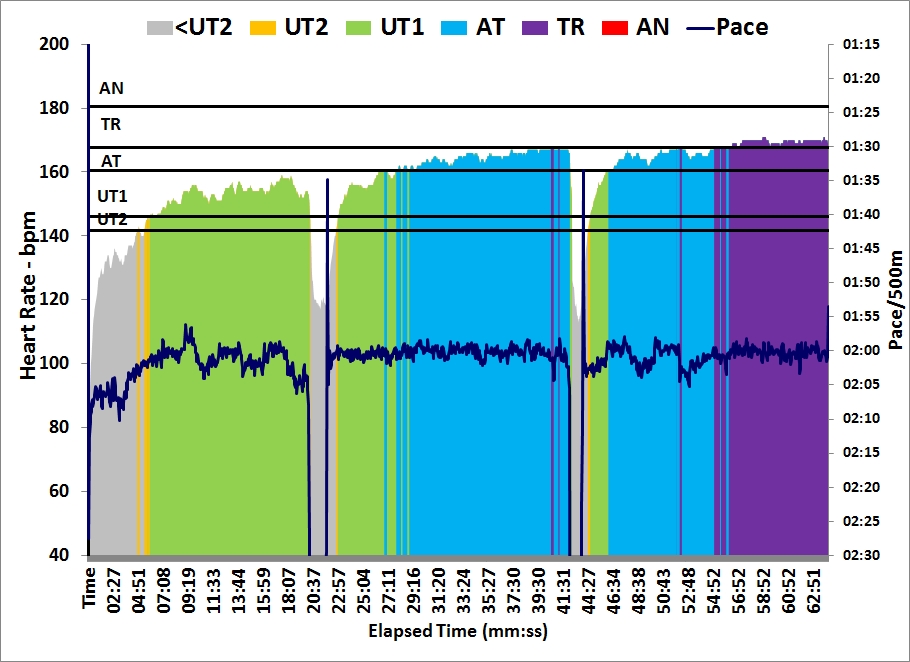
So today I did the 2 speed test again. I did it on March 17 and on February 26. First, a 20 minutes warming up:
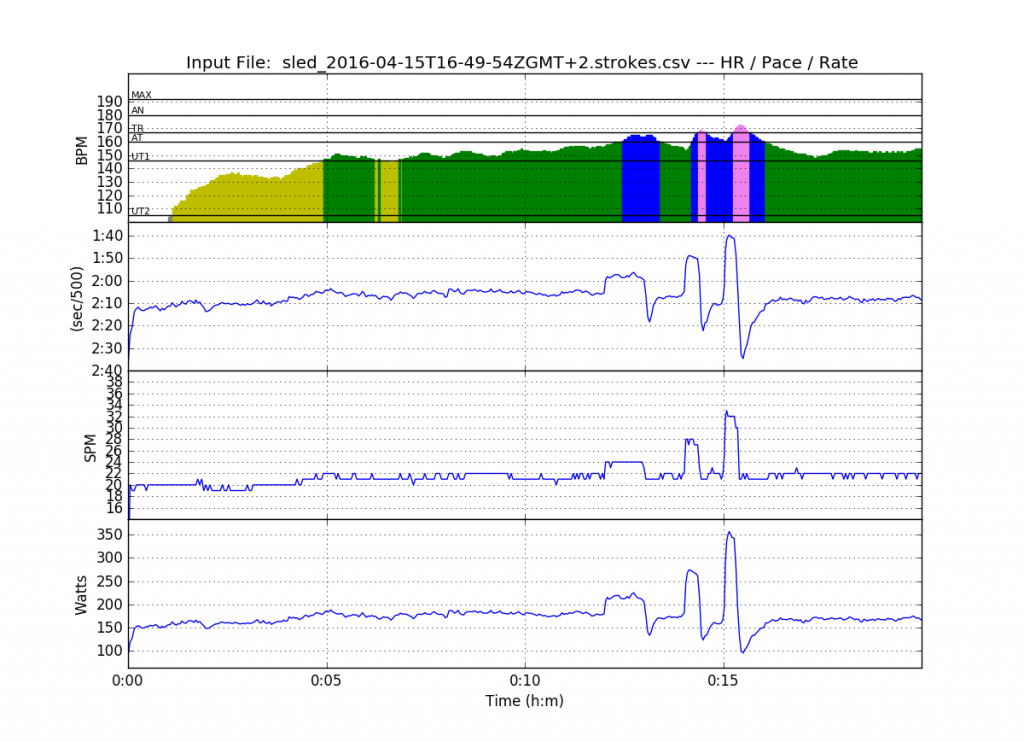
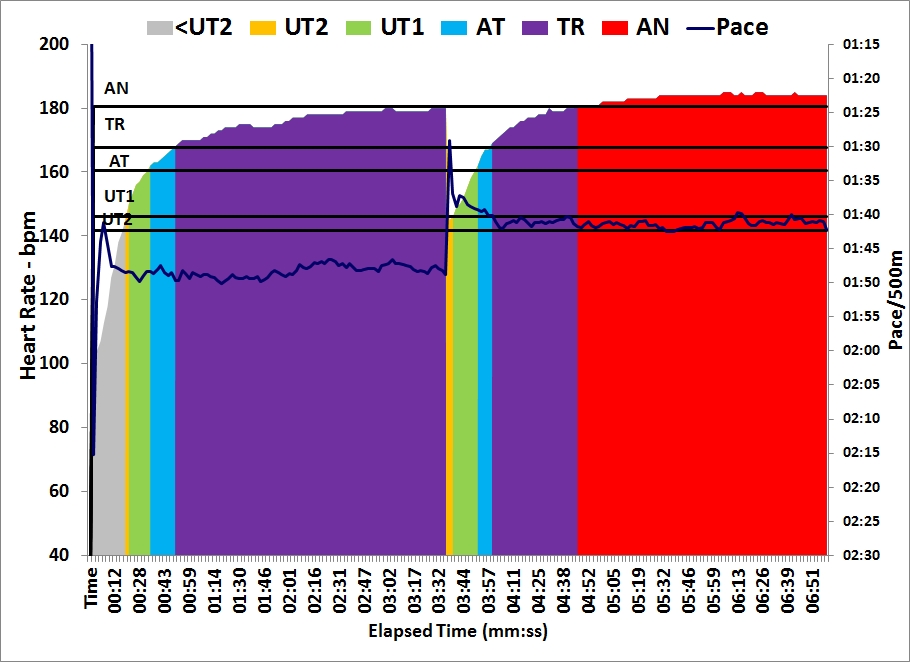
Then the first 1k, at “head race pace”:
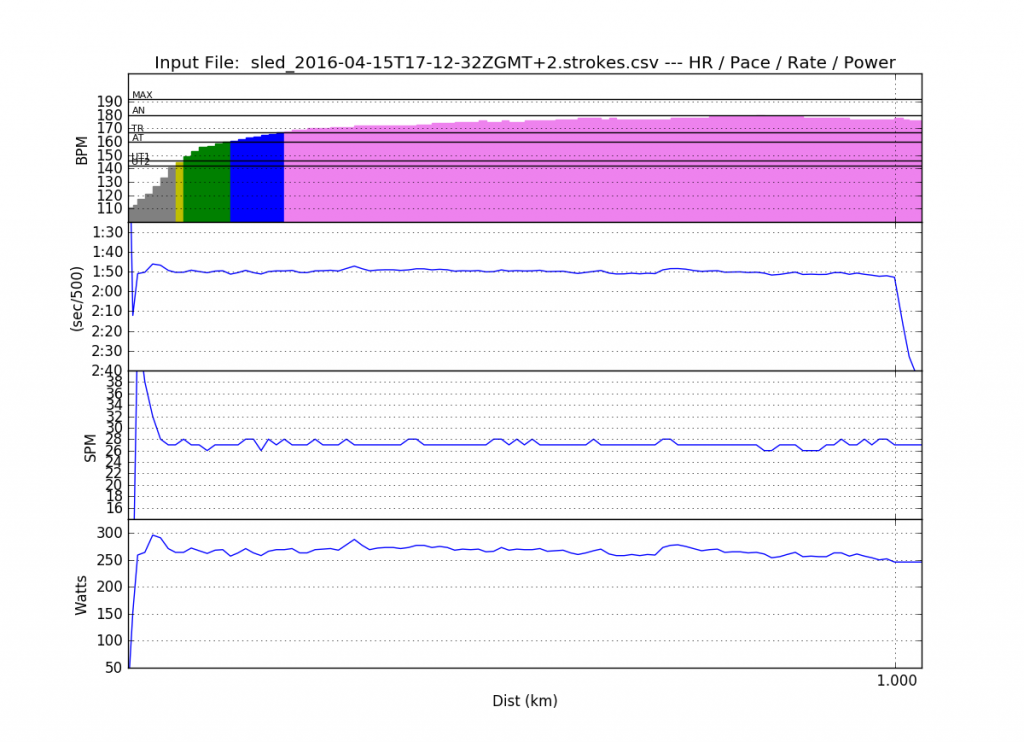
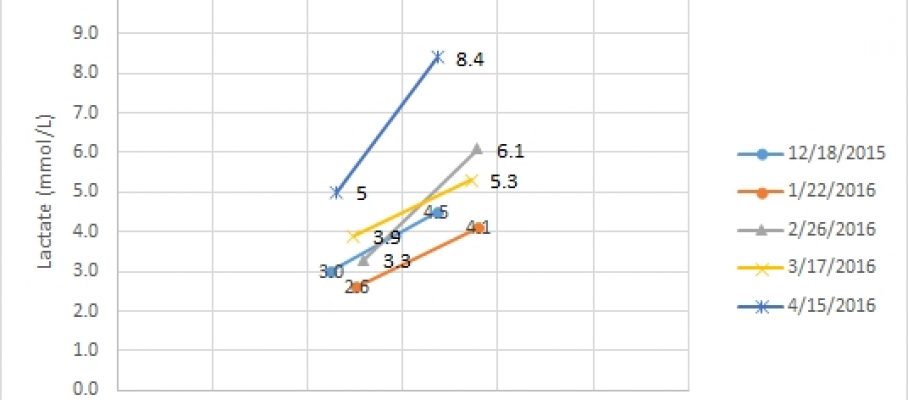
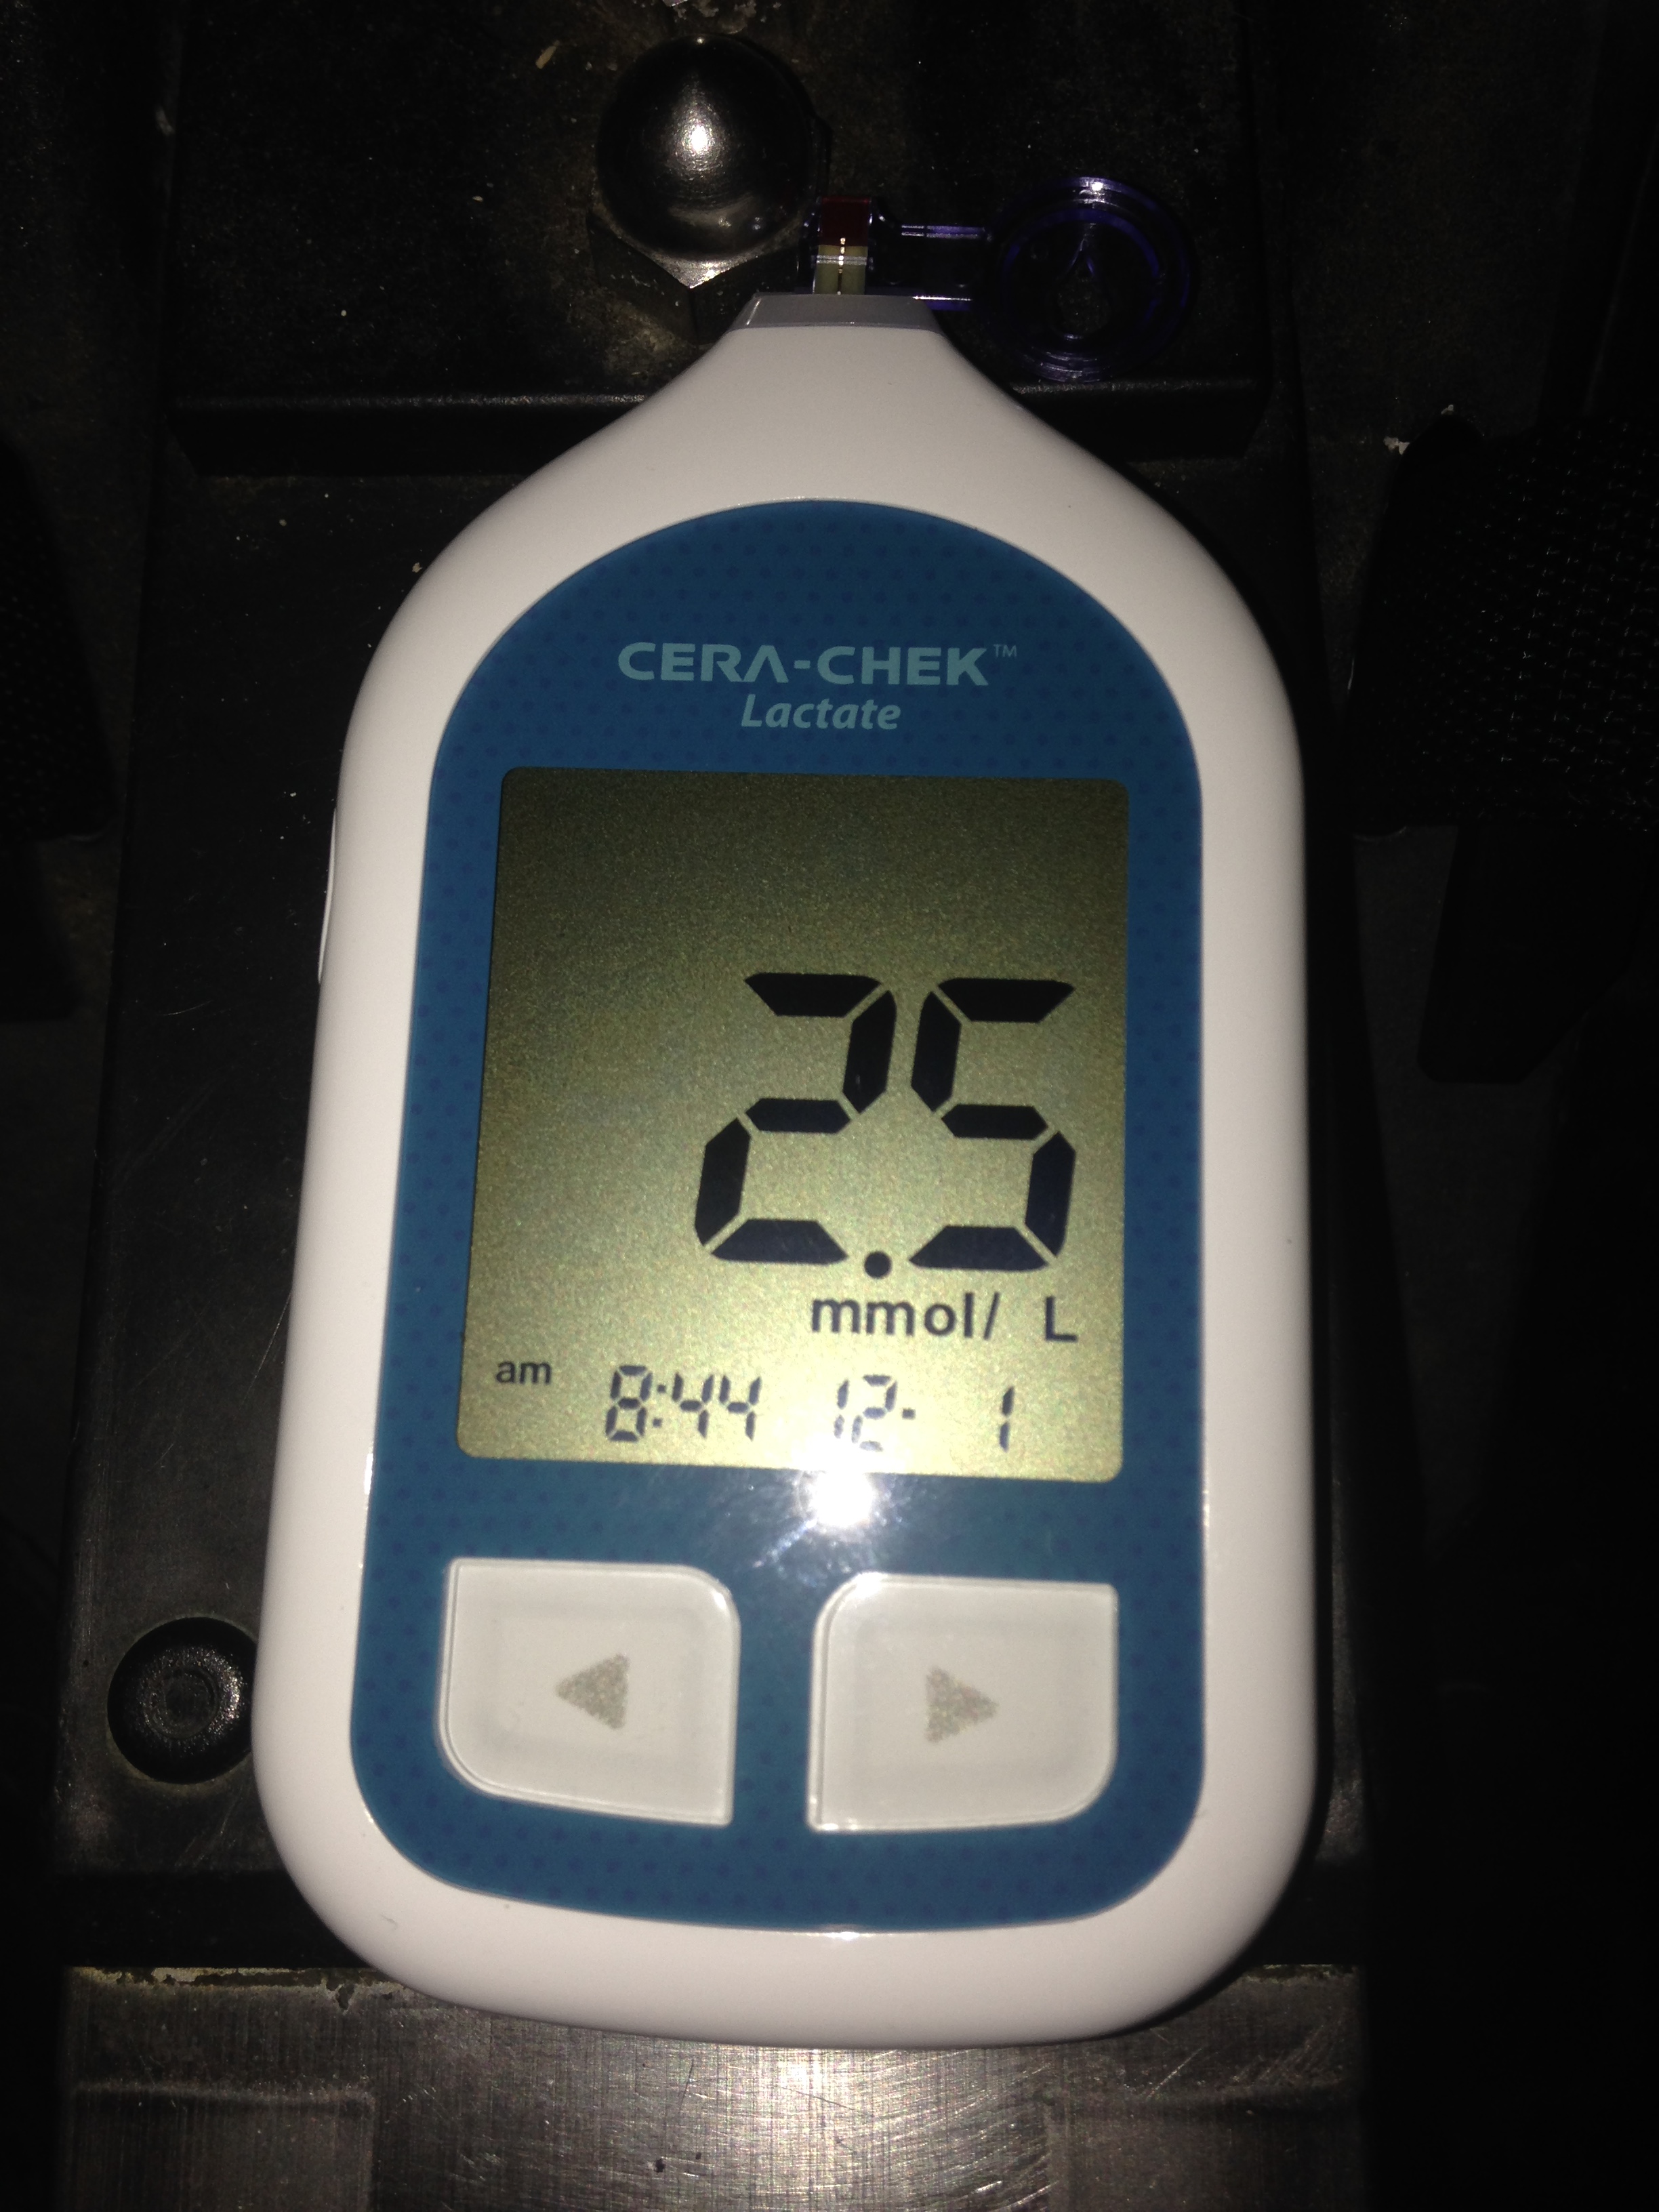
Did that in 265W, 3:39.3. Lactate was 5.0 mmol/L after one minute, 4.6 mmol/L after 3 minutes.
Twelve minutes of gentle rowing at 2:12 pace. Then the “hard” 1k.
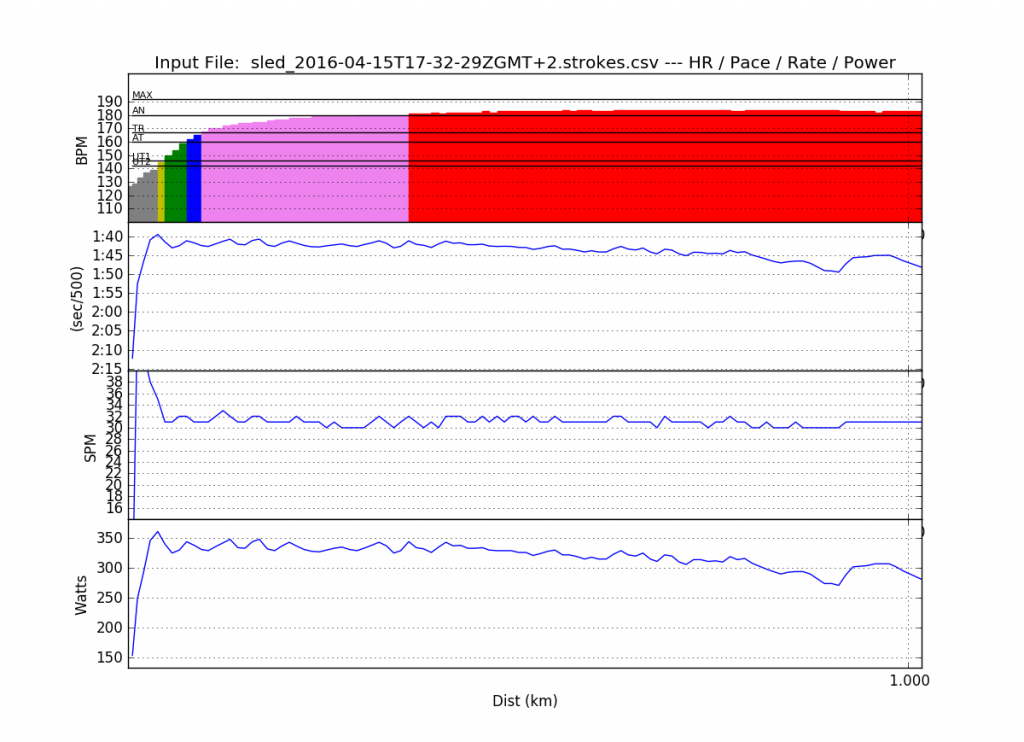
Hard it was. Max heart rate 184, average heart rate 178. My original plan was to hold 1:41 pace. I had difficulties from 600m to go and I even saw a 1:49 at one point. Lactate reading was 8.4 mmol/L, one minute after the row, and 8.6 mmol/L three minutes after the row.
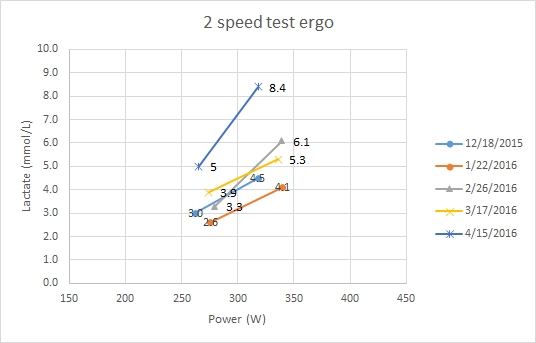
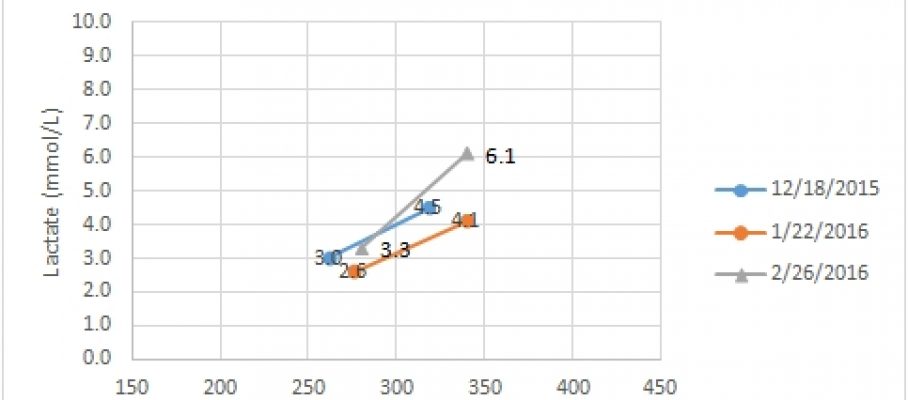
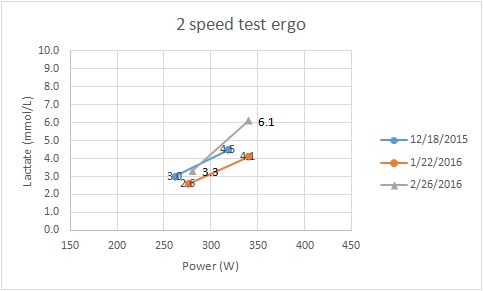
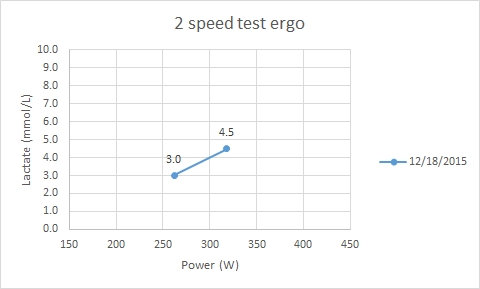
The top blue line are today’s results. No wonder I was struggling during the second 1k. I have never seen so high lactates.
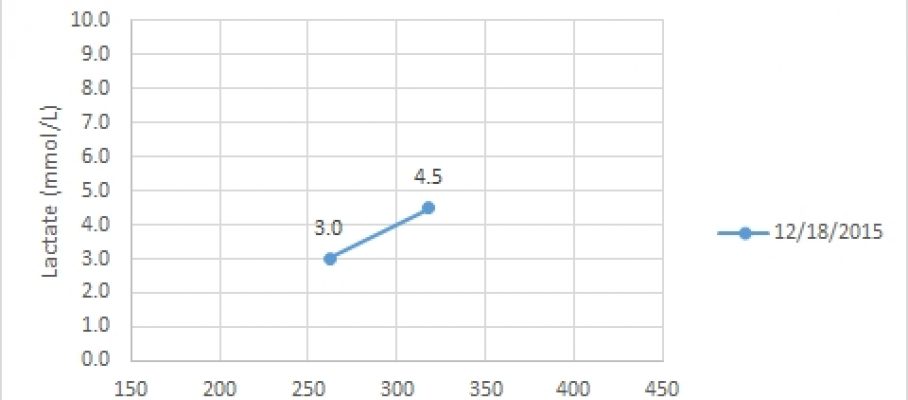
I have difficulty interpreting the lactate test results. I guess I will have to reread the lactate guru’s bible. One thing I notice is that I am working in the “elbow” of the lactate curve. Any small shift of the elbow to the left or right, or a slight increase in steepness of the right-hand side will have a very noticeable effect on the lactate curve. Here is my 10′ step test from the end of the fall:
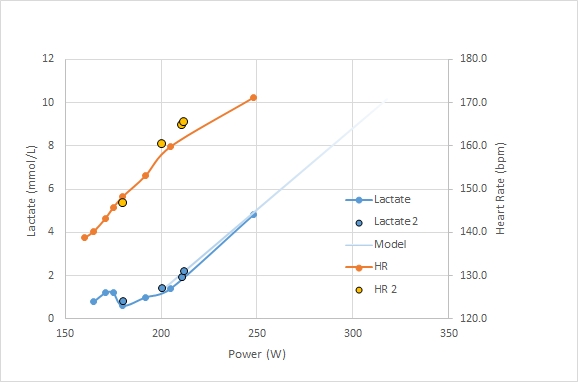
The light blue line is an extension of the >200 W points. For the 318W that I pulled today, that line is at 10 mmol/L.
Next week, I plan to do a 1k OTE erg to get a good score in for the nonathlon, before the erg season ends. I guess I will approach this 1k attempt with fear, after this result. After that 1k, I may have to think hard about the effectiveness of the training that I am doing.





Aug 31 2016
Tuesday – Bike & Lactate step test
Morning
Commute to work on the bicycle.
https://www.strava.com/activities/693940250/analysis
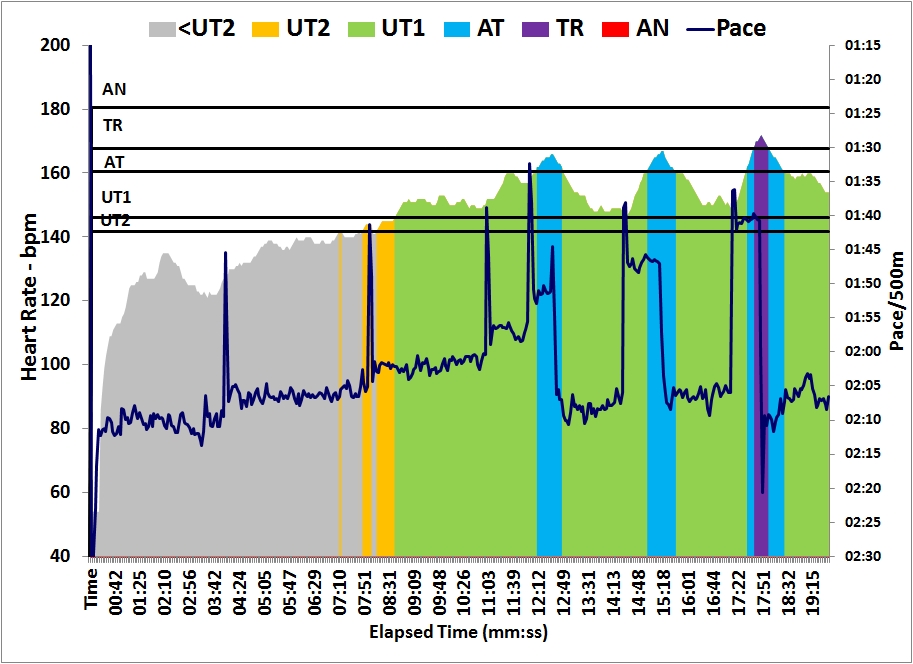
Average heart rate 132 bpm so definitely a regeneration workout. Although, at one point, at the beginning of what Strava calls the “Olomoucká I” segment, a 500m long climb of 27 meters elevation difference (5% average grade, 10% max grade), another cyclist was just behind me, and I had to push a bit harder to avoid him taking over. That pushed my heart rate up to 176 bpm.
Evening
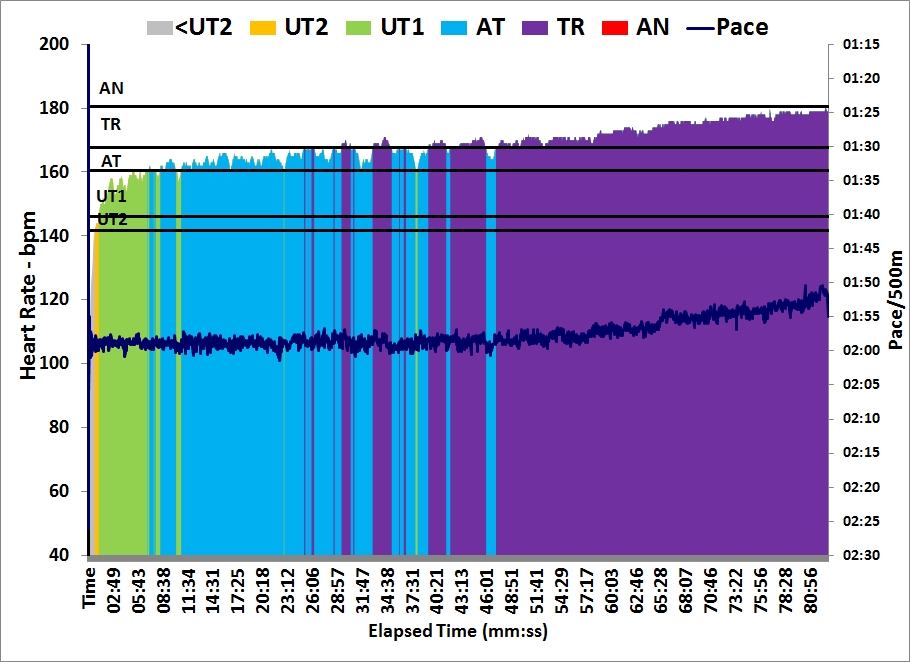
The post summer vacation / pre winter season lactate step test on the Concept2 erg. I did 6 intervals of 10 minutes at increasing power, taking a finger prick lactate measure after every step.
Workout Summary - media/20160830-194351-sled_2016-08-30T20-14-40ZGMT+2.strokes.csv

--|Total|-Total-|--Avg--|Avg-|-Avg-|-Max-|-Avg

--|Dist-|-Time--|-Pace--|SPM-|-HR--|-HR--|-DPS

--|14906|70:04.0|02:21.0|21.6|153.4|176.0|09.9
Workout Details
#-|SDist|SPM-|AvgHR|MaxHR|DPS-|Lactate|Power
00|02494|21.1|138.0|153.0|09.9| 1.7 | 170
01|02540|21.4|148.9|162.0|09.9| 1.6 | 180
02|02520|21.6|156.5|165.0|09.7| 1.7 | 190
03|02552|21.9|160.9|172.0|09.7| 2.0 | 200
04|02554|22.5|166.7|176.0|11.2| 4.6 | 210
05|02246|21.0|149.1|159.0|08.9| 3.1 | 160
I started at 170 W and increased with 10W after each interval. After reaching 4.6 mmol/L at 210W and feeling like you feel at 4.6 mmol/L, I didn’t continue to 220W but took the last interval as a cooling down.
The goal is to determine the threshold, under which lactate is flat. For me, this seems to be just under 200W, but I will confirm this next week by rowing 6x10min at a constant power of 195W, taking a lactate measurement every 10 minutes.
Here is the graph:
The “Model” line is a line that I “fitted” through last year’s data. For comparison, here is the graph that I compiled in November 2015.
So in comparison with November 2015, my steady state lactate level is higher, the step is more pronounced and seems to be shifted to the left. I guess that corresponds to being in a worse shape, fitness wise. Vacation effect, I think.
We’ll see if this is confirmed next week, but it looks like my steady state should not go above 195W.
By sanderroosendaal • Uncategorized • 1 • Tags: concept2, lactate, OTE, rowing, test, testing, training