Nov 19 2016
Saturday – more Steady State
It was rainy and dull, so no good weather to go out running. Today, I programmed 20k in the PM5 and rowed it down to zero. A few sessions ago I came up with a 750m/500m/250m sequence and Greg Smith, the quantified rower perfected that to 1000m/750m/500m/250m which gives you a nice 2500m interval. The fun part is to try and row each part of the 2500m at a prescribed stroke rate and work on consistency. It really makes long workouts fly by.
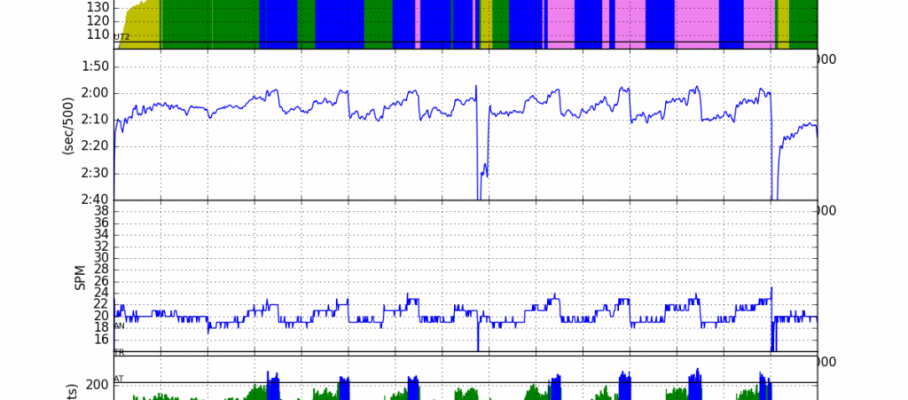
I also had a little fun with the interval editor on rowsandall.com and created these monster stats:
Workout Summary - media/20161119-1200070o.csv

--|Total|-Total-|--Avg--|-Avg-|Avg-|-Avg-|-Max-|-Avg

--|Dist-|-Time--|-Pace--|-Pwr-|SPM-|-HR--|-HR--|-DPS

--|20000|86:14.0|02:09.4|174.5|19.5|153.7|166.0|11.9

W-|20000|86:16.0|02:09.4|172.9|19.4|153.0|166.0|11.9

R-|00000|00:00.0|00:00.0|000.0|00.0|000.0|166.0|00.0

Workout Details

#-|SDist|-Split-|-SPace-|-Pwr-|SPM-|AvgHR|MaxHR|DPS-

01|01000|04:23.7|02:11.9|163.1|18.0|130.3|140.0|12.6

02|00750|03:08.6|02:05.7|176.2|19.1|142.9|149.0|12.5

03|00500|02:02.9|02:02.9|188.3|20.2|151.5|154.0|12.1

04|00250|01:00.7|02:01.5|195.4|21.4|154.3|156.0|11.6

05|01000|04:12.8|02:06.4|173.4|18.7|149.4|155.0|12.7

06|00750|03:08.9|02:05.9|175.4|19.3|148.0|151.0|12.4

07|00500|02:02.7|02:02.7|189.4|20.1|154.2|157.0|12.2

08|00250|01:00.7|02:01.4|196.5|20.9|158.9|161.0|11.8

09|01000|04:11.8|02:05.9|175.5|18.7|155.1|158.0|12.8

10|00750|03:06.9|02:04.6|180.8|19.3|156.3|158.0|12.5

11|00500|02:03.2|02:03.2|187.1|20.3|160.0|162.0|12.0

12|00250|00:58.1|01:56.2|192.4|21.1|161.7|163.0|12.3

13|01000|04:15.0|02:07.5|175.1|19.4|157.7|163.0|12.1

14|00750|03:05.4|02:03.6|185.5|20.3|160.6|163.0|11.9

15|00500|02:01.6|02:01.6|195.1|21.3|163.9|166.0|11.6

16|00250|02:43.4|05:26.7|111.2|18.0|129.3|165.0|05.1 - drink + 1.6mmol/L

17|01000|04:46.8|02:23.4|166.4|18.6|148.2|159.0|11.2 - playlist issue

18|00750|03:11.2|02:07.4|168.7|19.4|153.4|159.0|12.2

19|00500|02:04.8|02:04.8|180.2|20.4|157.2|159.0|11.8

20|00250|00:59.7|01:59.5|186.9|21.3|158.2|159.0|11.8

21|01000|04:16.7|02:08.4|169.3|18.6|156.3|160.0|12.5

22|00750|03:10.7|02:07.1|170.5|19.3|157.8|159.0|12.3

23|00500|02:05.3|02:05.3|178.1|20.5|158.5|160.0|11.7

24|00250|01:00.6|02:01.2|192.1|21.4|161.0|164.0|11.6

25|01000|04:18.0|02:09.0|163.8|18.4|157.3|163.0|12.6

26|00750|03:12.6|02:08.4|165.4|19.5|154.9|158.0|12.0

27|00500|02:05.8|02:05.8|175.5|20.2|156.3|158.0|11.8

28|00250|01:01.3|02:02.7|185.2|21.3|158.9|161.0|11.5

29|01000|04:20.8|02:10.4|159.0|18.8|154.2|160.0|12.2

30|00750|03:10.9|02:07.3|169.6|19.6|156.1|160.0|12.0

31|00500|02:04.5|02:04.5|181.5|20.7|160.3|162.0|11.7

32|00250|01:00.1|02:00.1|182.8|21.5|160.5|162.0|11.6 - 1.0 mmol/L
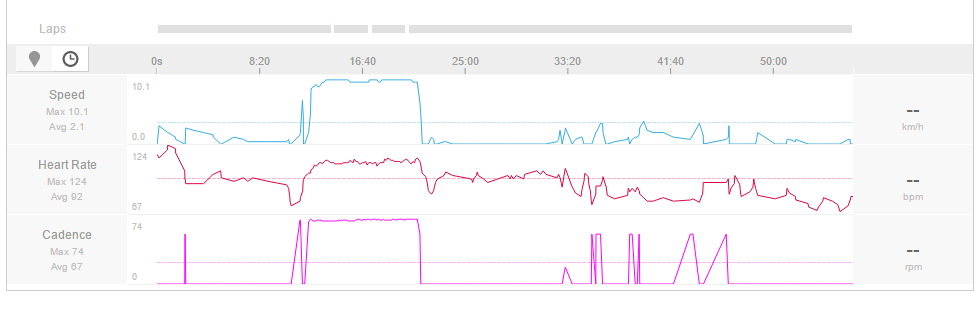
I paddled the final 250m of the fourth interval and stopped to take a lactate measurement: 1.6 mmol/L.
Then in the first 1000m of the second 10k, my playlist stopped, so I had to get off the erg and restart it.
At the end of the row, I measured lactate again. By now, that was very tricky because sweat was dripping from all my body parts. I was wearing a moisture wicking long-sleeved shirt. The moisture wicking combined with the high humidity in my rowing cave resulted in me being covered in “dew”, which steadily dripped off the sleeve ends. Hard to not contaminate the lactate strip. Anyway, I measured a low value of 1.0 mmol/L. I think it is time to man up and go 10W higher.


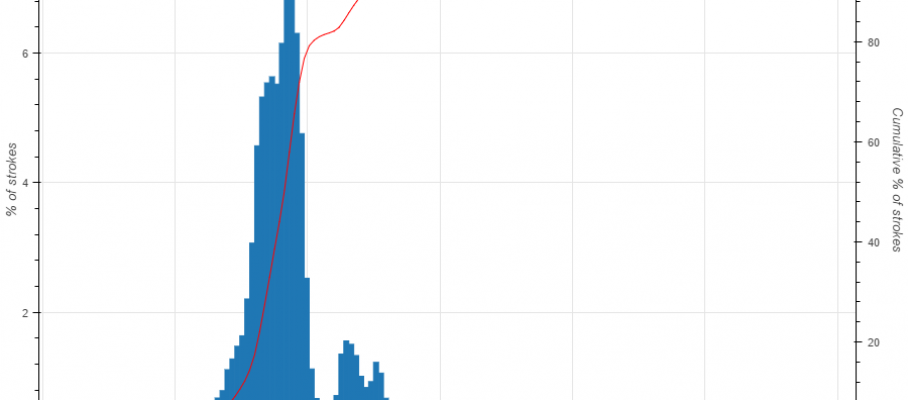
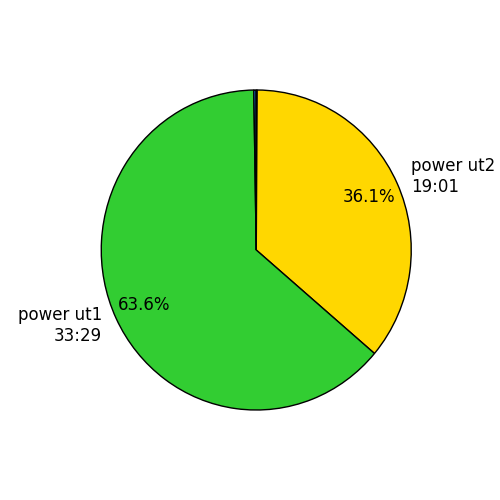
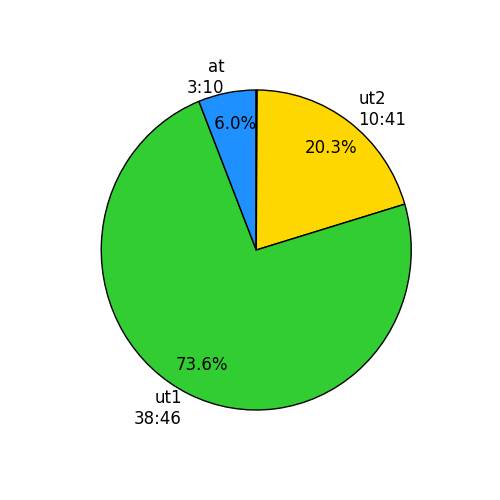
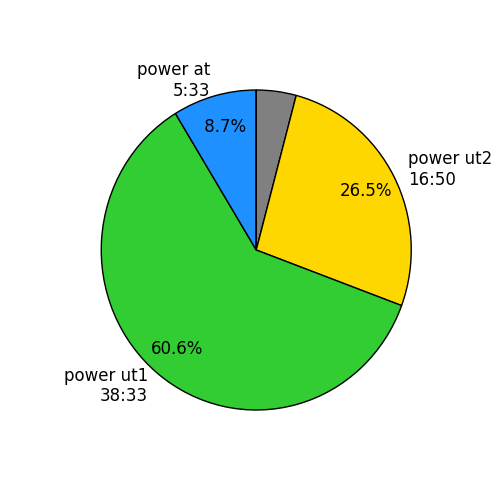
For the period between September 1 and today, my Power histogram on the erg looks like this:
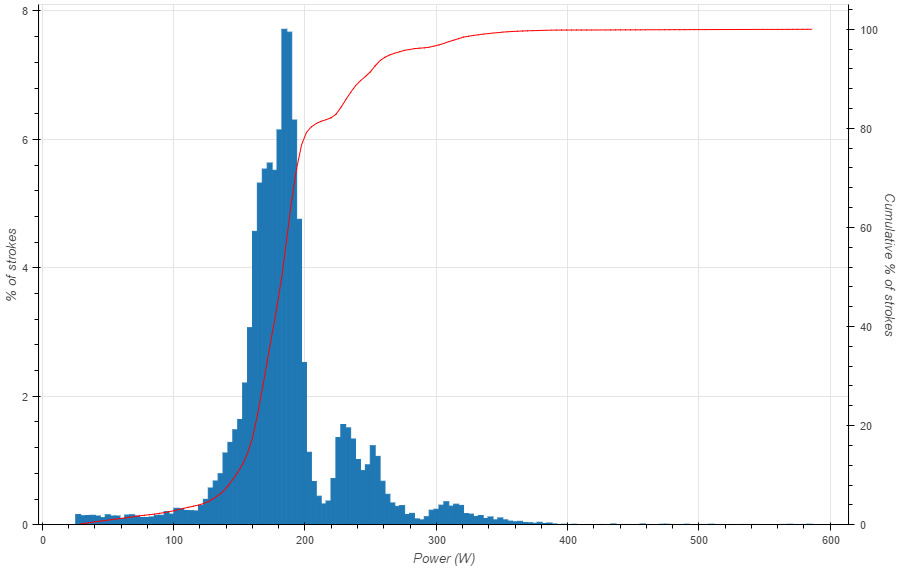
So 80% of my strokes below 200W (which is steady state). The peak is around 185W, and 50% of the strokes are at a lower power.
Also this interesting plot is available for everybody who uses rowsandall.com.


Nov 20 2016
More Steady State & Bad Technique
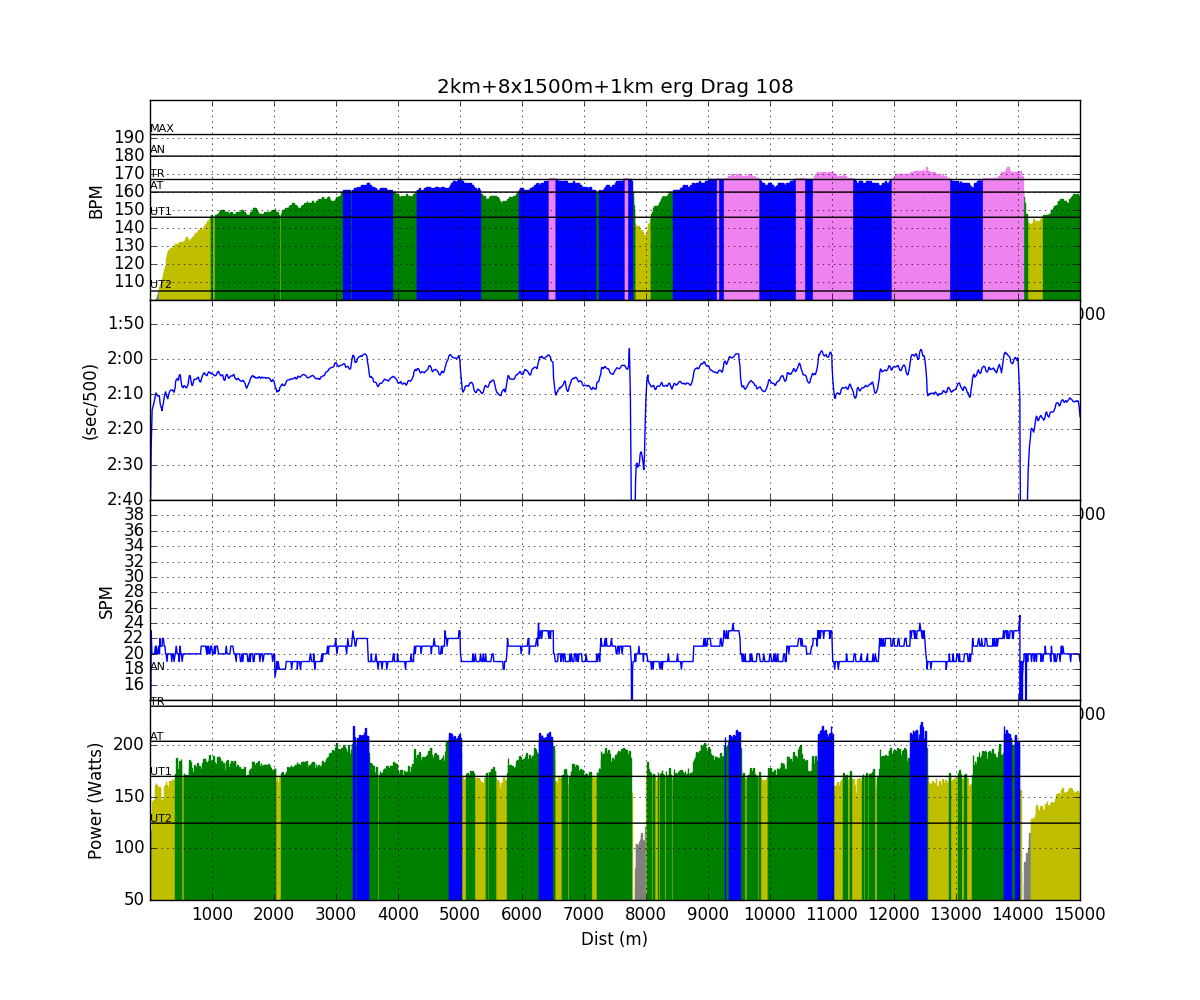
Just a 15km Steady State row, partitioned as 6x2500m, with the first 3 intervals rowed as 1000/750/500/250, and the final three intervals as 250/500/750/1000. In the first interval, I rowed at 18/19/20/21spm, in the second one 19/20/21/22spm, and in the third one 20/21/22/23spm. In the second half of the row I climbed down those same ladders in reverse order.
This slideshow requires JavaScript.
Bad Technique
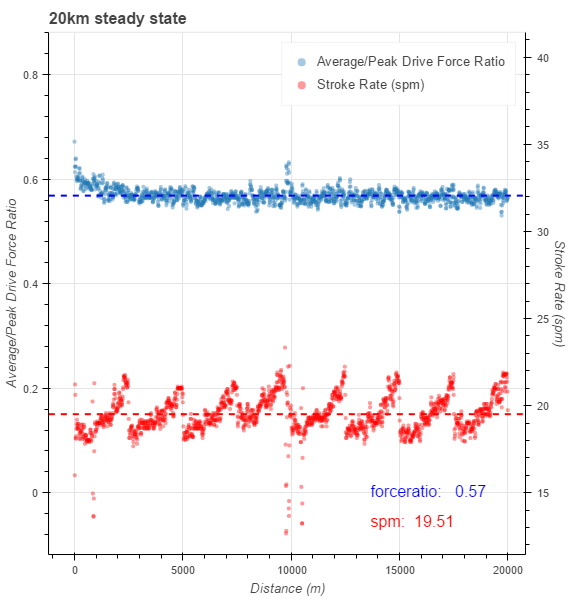
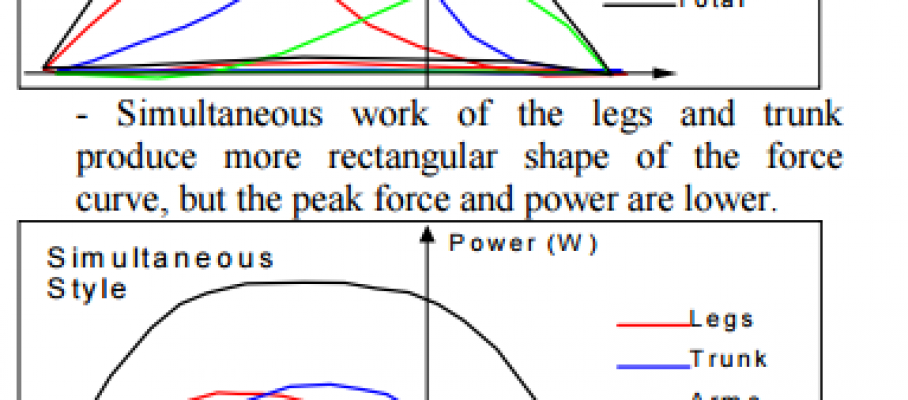
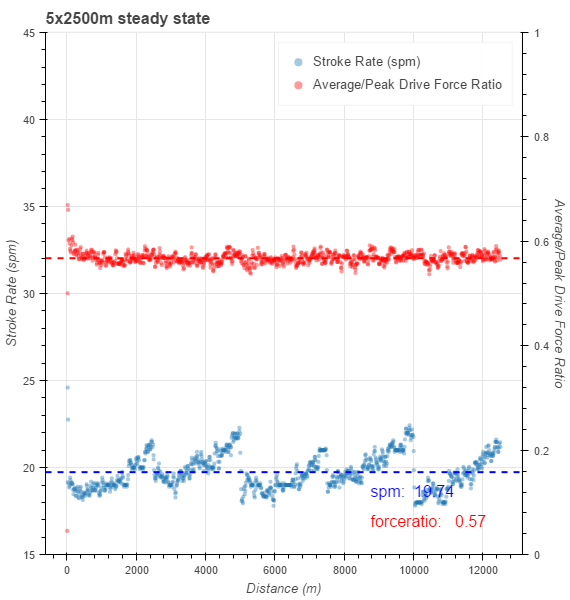
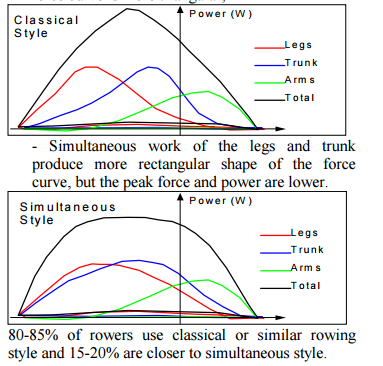
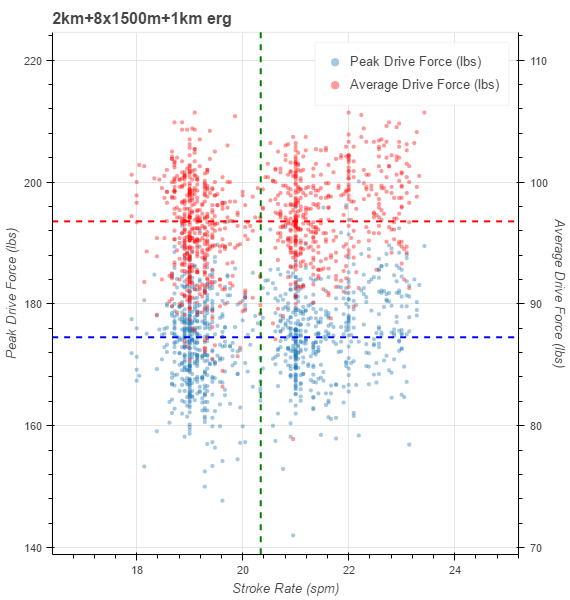
On Friday, I introduced a new parameter, the ratio of the average and peak drive force, and I found a study by Kleshnev that links this parameter to rowing style. Going one step further, I wanted to know if the value could be used to fingerprint bad technique. I set up a 250m intervals with 20 seconds rest and rowed. In the first and final intervals, I rowed my “normal” stroke, which I believe is decent, technique-wise.
In the other intervals I rowed exaggerated versions of common examples of bad technique. Here is the resulting table. I don’t see a correlation.
By sanderroosendaal • Uncategorized • 3 • Tags: concept2, erg, OTE, rowing, steady state, technique, training