
Monday
No training.
Tuesday
A weights session. Pretty heavy on the squats, and finishing off the legs with leg press.
Wednesday
Arrived at the club for a session in the eight. Four people turned up. One decided to go home because of the chop. The three others (including me) sat down for an erg session: 4x2km at 24spm. First two at high drag. I didn’t record the session in any digital way. Didn’t even have my phone with me to take a screenshot.
I did the first two high drag intervals at 1:56 pace and didn’t find it difficult. I was very surprised to find that I couldn’t hold 1:58 in the last two intervals (at normal drag factor). I think my legs were just getting very empty.
Thursday
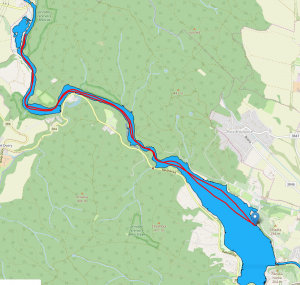 I decided to do a steady state row up the gorge towards and beyond the castle. I had a sip of water every 3.5km and turned around after 7km. The first 10km of the workout were very pleasant rowing. I did record my steady state stroke using the Quiske app. I recorded my 20spm stroke on the straight 1km just before the castle, both on the way there and on the way back.
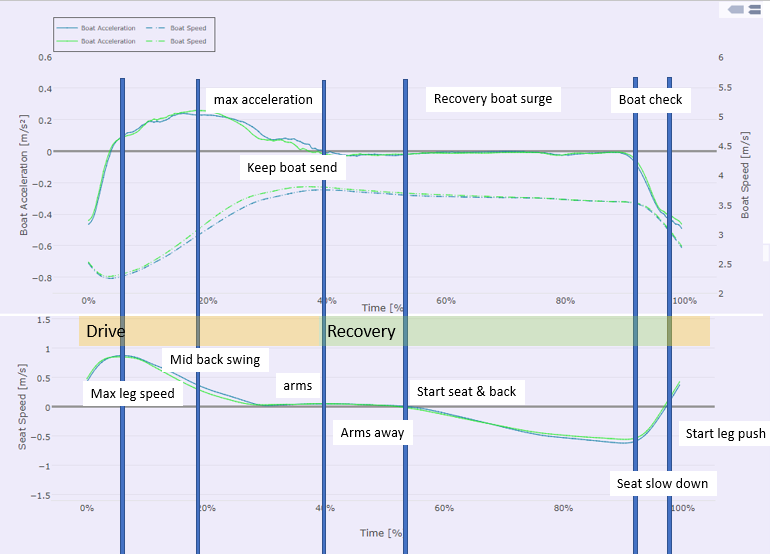
The top chart is boat speed (dashed lines) and acceleration (solid lines). The bottom chart is seat speed with respect to the boat. Here’s a walk through the chart. If you take the time to read it in detail, you will appreciate the differences later in this post, when I discuss 30spm:
- The drive phase is indicated by the orange part of the bar (marked “Drive”). This is where the blade is in the water and you are putting in work to increase the speed of the system
- The recovery phase is where the blades are not in the water. The only force that is working on the system is the drag of the water (and a slight contribution from air drag). As I am moving my 75kg body sternwards and then slowing down on the slides, there are some inertial forces that affect boat speed as well.
- Actually, the moment the blade enters the water is all the way to the right end of the chart. It’s hard to give evidence without video, but I am almost certain that the blades enter the water very close to the point where my seat changes direction. It may even be slightly before, at the moment where the acceleration curve starts has an inflection point. Why do I believe that, because the blades entering the water immediately create a lift force on the blades which will propel the boat forward. However, the boat keeps slowing down, because I am starting to push on the footstretcher to change the direction of my body.
- During the first half of the drive, my seat speed achieves it’s maximum value around the first blue bar from the left side of the chart (“max leg speed”). This is also the point at which the boat acceleration starts to hit positive numbers (speeding up).
- The second blue bar from the left shows the point where I believe is the middle point of my back swing. This point coincides with the maximum boat acceleration. The legs are still working, the back is adding its force, and all’s well.
- Going further to the right is the point I call “keep boat send”. This is what I tell myself, to remind me of the need to finish strong and have a strong arms part of the stroke. Acceleration is low, but the important point is that it’s positive. I am able to keep the boat accelerating all the way until tap-down.
- Arms away. This may be a bit slow, because the boat is losing some speed here.
- Start seat and back. I am not extremely sequential with this. The moment my arms are away, I start rolling up the slide as well as getting my back to catch position. Because of the transfer of momentum, I am now able to stop the boat speed drop and keep the boat at constant speed. I am actually pretty much able to manage my seat speed to keep the boat from slowing down.
- Until the moment where I have to start slowing down my seat speed to prepare for the catch.
Thank you for reading the Quiske chart explanation in detail. Here’s the row chart:
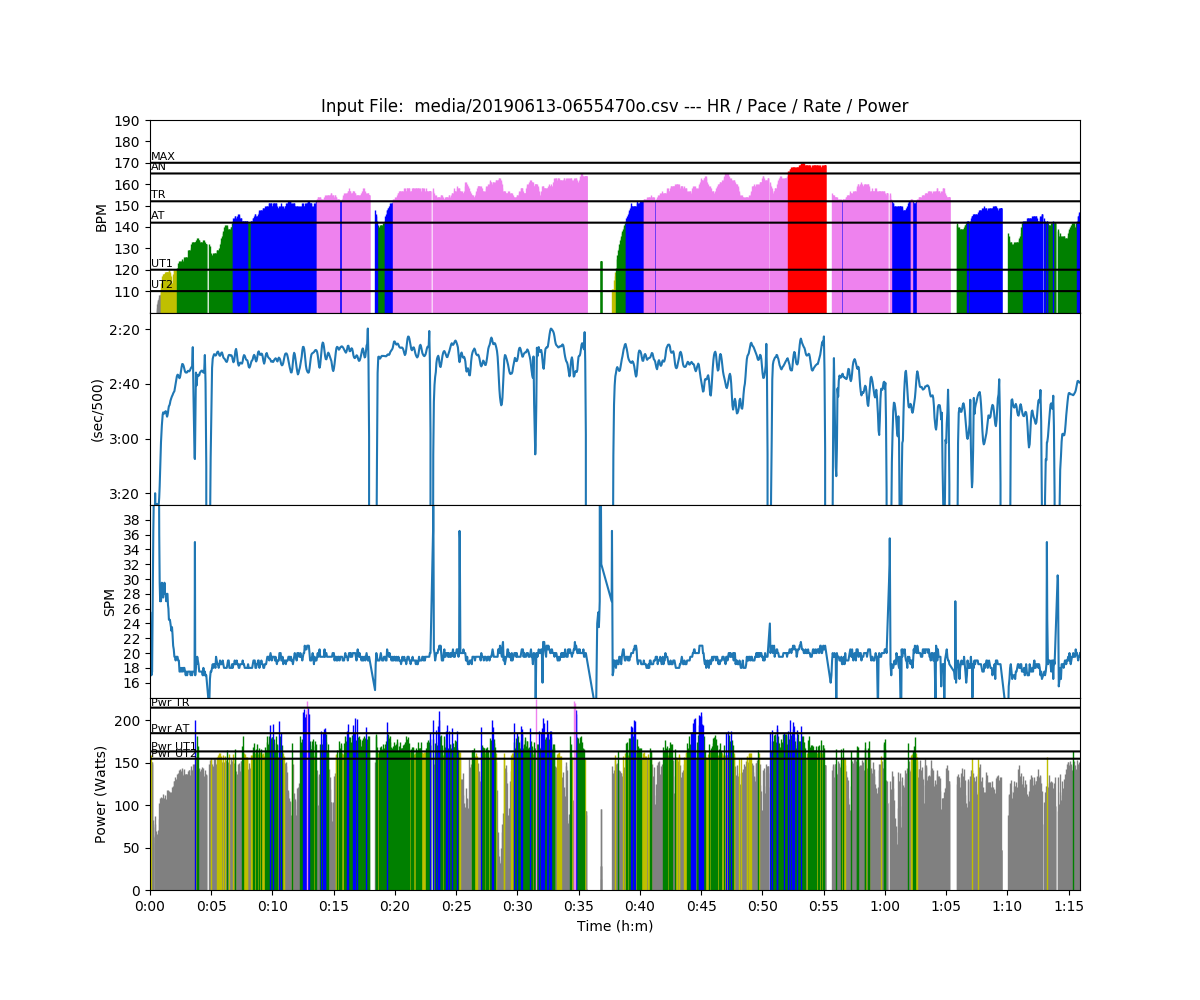
During that second straight kilometer, at around 52 minutes into the row, I was catching up with another sculler, and that gave me just enough motivation to ignore the signals from my legs and keep pushing. Only later did I see that I actually pushed my heart rate into the red. I paid a price for that.
After the squats in the weights room on Tuesday, the heavy drag 2ks at 24spm on Wednesday, and 10km of steady state on Thursday, my legs started to refuse service. They just had enough.
I was fast enough to stay in front of the other sculler and even create a bit of distance between us, but my power gradually went down and in the last 10 minutes I was just wishing I was already back at the dock.
Friday
I decided to skip a session to give myself some rest.
Saturday
A fun session in the double. The only problem was that it was a very hot day.
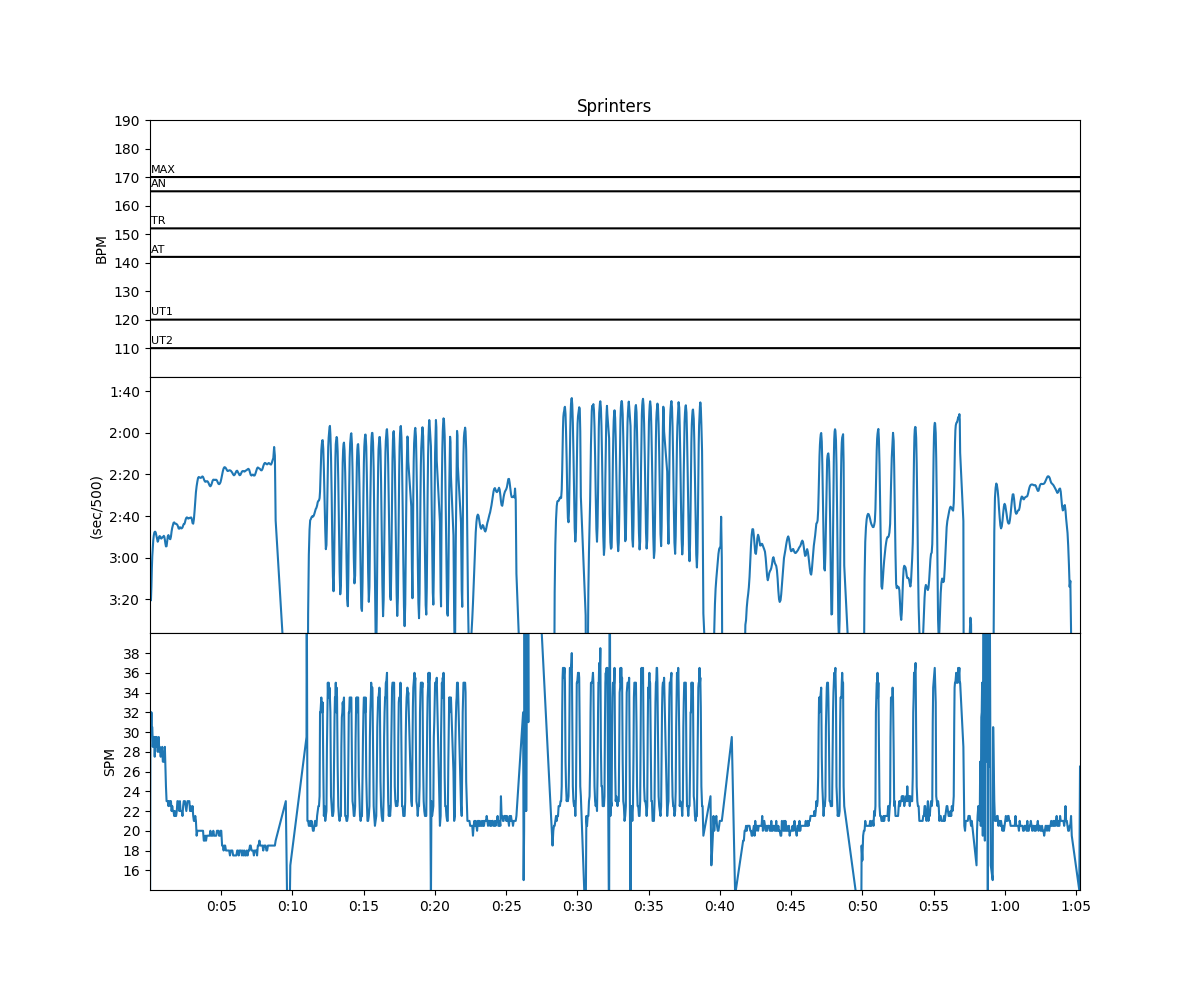
Romana and I did the following session:
2km warming up
3x10min of 15″ on, 15″ off, at 34-36spm.
First series into headwind. I lost count, and it looks like we did one 15 second interval more than we were supposed to do. We rowed to the end of the lake, turned around, and did the second series. I had to skip the fourth to wipe the sweat off my hands. All was good, until we turned around again at the end of the lake to do the third and last series, into the headwind. After 4 intervals I stopped because I just had enough. After a brief break, we got rowing again and we did a few more 8 stroke intervals, but with longer breaks. We extended the last one to 30 seconds.
Sunday
I was hesitating being the planned session (8x500m/500m) or just a steady state. The lake was pretty choppy and windy. Romana was out in a mixed coxless four and they were doing the 500s, so in the end I decided to do them.
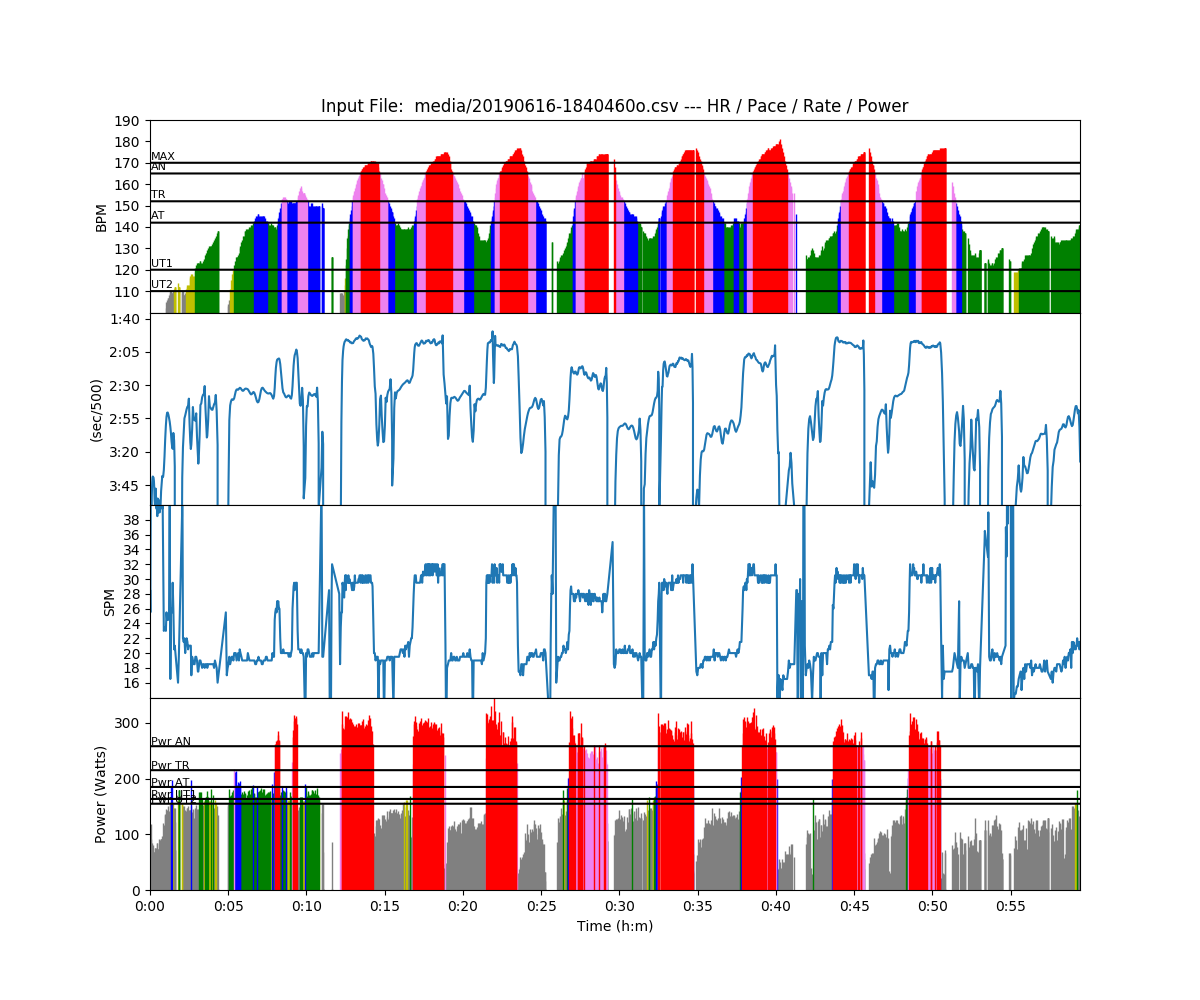
Workout Summary - media/20190616-1840460o.csv

--|Total|-Total----|--Avg--|-Avg-|Avg-|-Avg-|-Max-|-Avg

--|Dist-|-Time-----|-Pace--|-Pwr-|SPM-|-HR--|-HR--|-DPS

--|10812|00:59:25.9|02:44.9|164.2|23.4|146.7|181.0|07.8

W-|04215|00:17:46.4|02:06.5|276.8|29.3|161.2|179.0|08.1

R-|06605|00:41:40.4|03:09.3|116.2|20.9|140.6|179.0|07.2

Workout Details

#-|SDist|-Split-|-SPace-|-Pwr-|SPM-|AvgHR|MaxHR|DPS-

03|00509|02:00.1|01:58.1|294.3|29.5|151.8|171.0|08.6 - tailwind

04|00497|01:57.4|01:58.1|291.0|30.6|164.1|174.0|08.3 - tailwind

05|00498|02:00.4|02:00.9|280.0|30.4|160.6|176.0|08.2 - tailwind + chop

06|00510|02:26.5|02:23.7|253.8|27.3|163.7|174.0|07.6 - headwind + chop

07|00500|02:16.8|02:16.8|280.4|28.4|162.9|176.0|07.7 - headwind + chop

08|00510|02:14.1|02:11.4|283.6|29.9|166.2|179.0|07.6 - headwind

09|00489|01:57.2|01:59.8|270.5|30.2|160.0|174.0|08.3 - tailwind

10|00521|02:05.3|02:00.2|268.3|30.1|164.5|176.0|08.3 - tailwind
I ended up doing all of them. There was quite a lot of chop on the south end of the lake, which severely slowed me down in the third to the fifth interval.
I “Quisked” all the intervals and here is the summary slide:
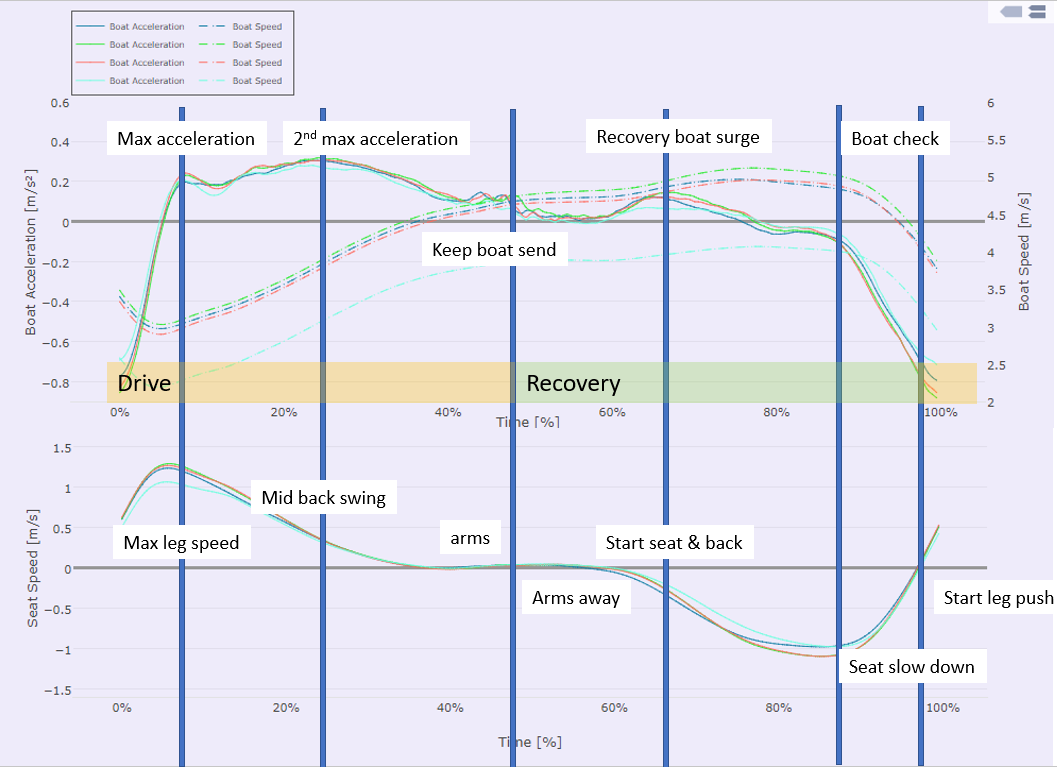
I am showing only the first four intervals here, three tailwind ones and one choppy headwind one. It shows that despite the significantly lower boat speed, the choppy headwind interval wasn’t too bad.
Let me talk you through the chart.
- Again, the “blades enter water” moment is actually the last blue bar on the right of the chart. That is when the legs start to push.
- Boat is still slowing down (negative acceleration) but at the maximum seat (leg) speed it flips to a positive acceleration peak.
- I am a little less smooth around the catch than on the 20spm steady state stroke. The acceleration dips slightly before it peaks again during the middle of my back swing.
- At around 35% of the stroke duration, the seat stops and it’s back and arms, finishing with arms only. Happy to see that I keep accelerating the boat.
- Compared to my 20spm session, I am more dynamic with the arms away and the boat doesn’t slow down in the first part of the recovery
- When I start rolling up the back and the seat starts moving, I am creating a little boat surge. This is normal at higher stroke rates.
- At higher boat speeds, drag is increased compared to my 20spm pace. When I stop accelerating on the slide, the boat starts to slow down. I might want to try to keep this accelerating almost all the way to just before the catch. I am doing this better at lower rates.
- When the seat has to slow down, I have to push on the footstretcher and the boat acceleration goes to negative.
The “best” line seems to be the green one, but I am not sure if that was due to wind or me rowing better. Otherwise, no conclusion. I know what I am working on, and I am glad I see the evidence of that in the curves. I need to keep monitoring.
Follow me in social media
Like this:
Like Loading...
Jun 17 2019
Legs? Emptied.
Monday
No training.
Tuesday
A weights session. Pretty heavy on the squats, and finishing off the legs with leg press.
Wednesday
Arrived at the club for a session in the eight. Four people turned up. One decided to go home because of the chop. The three others (including me) sat down for an erg session: 4x2km at 24spm. First two at high drag. I didn’t record the session in any digital way. Didn’t even have my phone with me to take a screenshot.
I did the first two high drag intervals at 1:56 pace and didn’t find it difficult. I was very surprised to find that I couldn’t hold 1:58 in the last two intervals (at normal drag factor). I think my legs were just getting very empty.
Thursday
The top chart is boat speed (dashed lines) and acceleration (solid lines). The bottom chart is seat speed with respect to the boat. Here’s a walk through the chart. If you take the time to read it in detail, you will appreciate the differences later in this post, when I discuss 30spm:
Thank you for reading the Quiske chart explanation in detail. Here’s the row chart:
During that second straight kilometer, at around 52 minutes into the row, I was catching up with another sculler, and that gave me just enough motivation to ignore the signals from my legs and keep pushing. Only later did I see that I actually pushed my heart rate into the red. I paid a price for that.
After the squats in the weights room on Tuesday, the heavy drag 2ks at 24spm on Wednesday, and 10km of steady state on Thursday, my legs started to refuse service. They just had enough.
I was fast enough to stay in front of the other sculler and even create a bit of distance between us, but my power gradually went down and in the last 10 minutes I was just wishing I was already back at the dock.
Friday
I decided to skip a session to give myself some rest.
Saturday
A fun session in the double. The only problem was that it was a very hot day.
Romana and I did the following session:
First series into headwind. I lost count, and it looks like we did one 15 second interval more than we were supposed to do. We rowed to the end of the lake, turned around, and did the second series. I had to skip the fourth to wipe the sweat off my hands. All was good, until we turned around again at the end of the lake to do the third and last series, into the headwind. After 4 intervals I stopped because I just had enough. After a brief break, we got rowing again and we did a few more 8 stroke intervals, but with longer breaks. We extended the last one to 30 seconds.
Sunday
I was hesitating being the planned session (8x500m/500m) or just a steady state. The lake was pretty choppy and windy. Romana was out in a mixed coxless four and they were doing the 500s, so in the end I decided to do them.
Workout Summary - media/20190616-1840460o.csv
--|Total|-Total----|--Avg--|-Avg-|Avg-|-Avg-|-Max-|-Avg
--|Dist-|-Time-----|-Pace--|-Pwr-|SPM-|-HR--|-HR--|-DPS
--|10812|00:59:25.9|02:44.9|164.2|23.4|146.7|181.0|07.8
W-|04215|00:17:46.4|02:06.5|276.8|29.3|161.2|179.0|08.1
R-|06605|00:41:40.4|03:09.3|116.2|20.9|140.6|179.0|07.2
Workout Details
#-|SDist|-Split-|-SPace-|-Pwr-|SPM-|AvgHR|MaxHR|DPS-
03|00509|02:00.1|01:58.1|294.3|29.5|151.8|171.0|08.6 - tailwind
04|00497|01:57.4|01:58.1|291.0|30.6|164.1|174.0|08.3 - tailwind
05|00498|02:00.4|02:00.9|280.0|30.4|160.6|176.0|08.2 - tailwind + chop
06|00510|02:26.5|02:23.7|253.8|27.3|163.7|174.0|07.6 - headwind + chop
07|00500|02:16.8|02:16.8|280.4|28.4|162.9|176.0|07.7 - headwind + chop
08|00510|02:14.1|02:11.4|283.6|29.9|166.2|179.0|07.6 - headwind
09|00489|01:57.2|01:59.8|270.5|30.2|160.0|174.0|08.3 - tailwind
10|00521|02:05.3|02:00.2|268.3|30.1|164.5|176.0|08.3 - tailwind
I ended up doing all of them. There was quite a lot of chop on the south end of the lake, which severely slowed me down in the third to the fifth interval.
I “Quisked” all the intervals and here is the summary slide:
I am showing only the first four intervals here, three tailwind ones and one choppy headwind one. It shows that despite the significantly lower boat speed, the choppy headwind interval wasn’t too bad.
Let me talk you through the chart.
The “best” line seems to be the green one, but I am not sure if that was due to wind or me rowing better. Otherwise, no conclusion. I know what I am working on, and I am glad I see the evidence of that in the curves. I need to keep monitoring.
Follow me in social mediaShare this:
Like this:
By sanderroosendaal • Uncategorized • 0