Today was Lactate Day at our rowing club. The kids who are in a performance program get this paid by the federation, and for us Masters and other less promising rowers there is the opportunity to pay and participate. I happily did that, because it is much more convenient than doing it myself.
The tests were done by two ladies from the university. We had 6 ergs lined up and the testing protocol was 5 intervals of 5 minutes, with 2 minutes rest. The second erg started 1:10 minutes after the first, and so forth, so the ladies had 1:10 to collect the data after each interval and they were continuously occupied.
You finish an interval, the two ladies come to you. One writes down your heart rate, and the other takes some blood from your ear lobe. The only thing I had to focus on was rowing at the prescribed Power values.
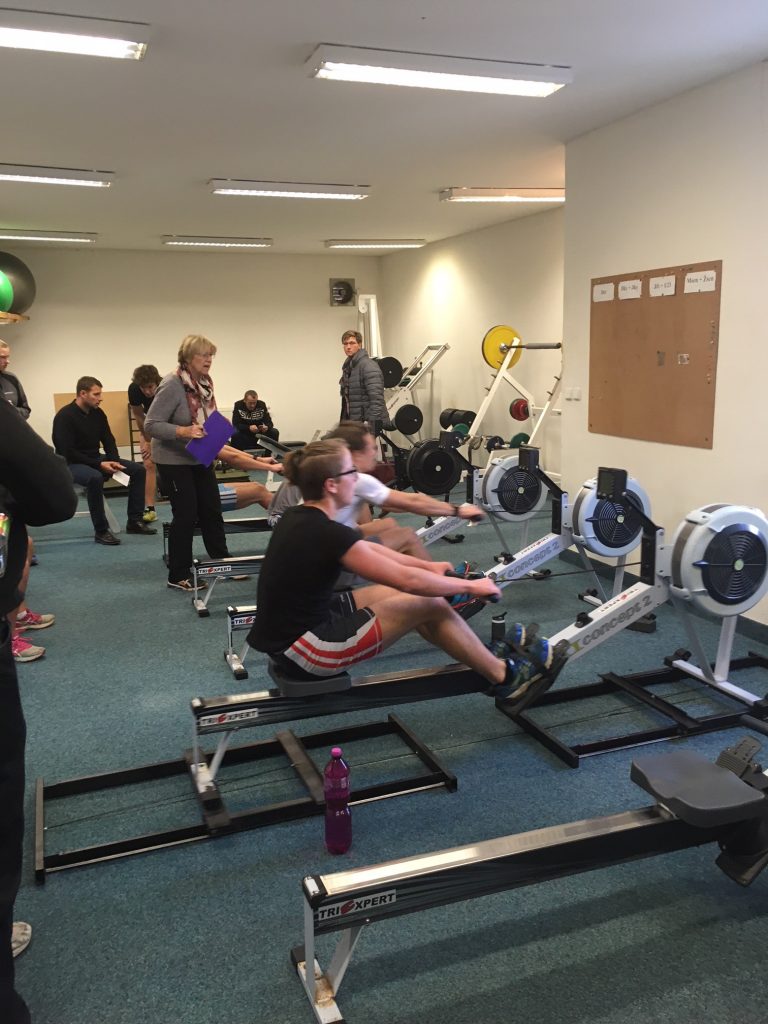
Here is a picture I took after my row, of the last group. Notice that we had participation from the other club in town, who do these tests on sliders. We row on static ergs.
For me, the levels were 160, 190, 220, 250, and >280 Watt.
Workout Summary - media/df_20171111-100732.csv
--|Total|-Total-|--Avg--|-Avg-|Avg-|-Avg-|-Max-|-Avg
--|Dist-|-Time--|-Pace--|-Pwr-|SPM-|-HR--|-HR--|-DPS
--|07846|41:12.0|02:37.5|223.7|22.7|154.4|184.0|08.4
W-|06419|25:00.0|01:56.8|223.6|24.1|160.8|184.0|10.7
R-|01433|16:12.0|05:39.2|210.2|16.1|131.6|184.0|02.8
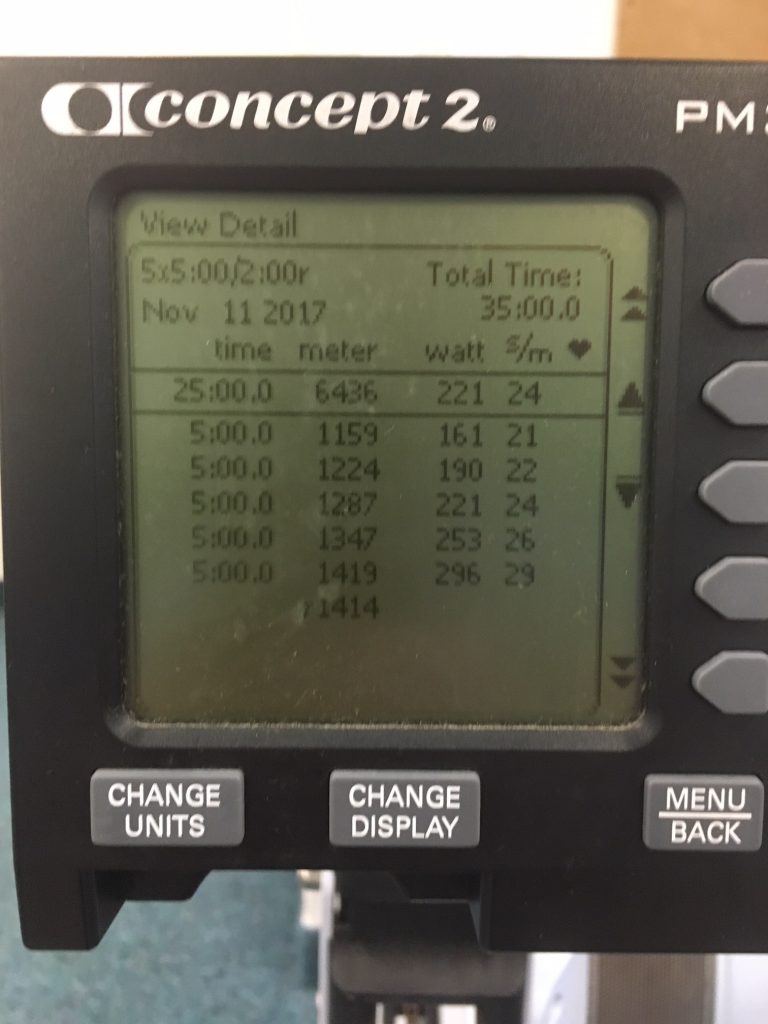
Workout Details
#-|SDist|-Split-|-SPace-|-Pwr-|SPM-|AvgHR|MaxHR|DPS-
01|01156|05:00.0|02:09.7|162.1|21.0|139.5|151.0|11.0
02|01222|05:00.0|02:02.8|189.8|21.9|154.1|160.0|11.2
03|01287|05:00.0|01:56.6|221.2|23.5|163.5|170.0|11.0
04|01346|05:00.0|01:51.4|251.2|25.7|170.4|177.0|10.5
05|01408|05:00.0|01:46.6|293.7|28.2|176.3|184.0|10.0
I had to do some data fusion to merge the heart rate data measured with the Garmin and the other parameters measured with PainSled, connected through USB cable to the PM3.
I am pretty happy with the power achieved in the final interval.
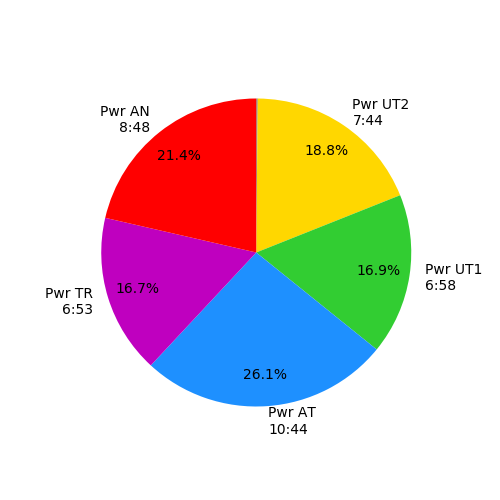
The power pie chart is a beauty. I have to share it:
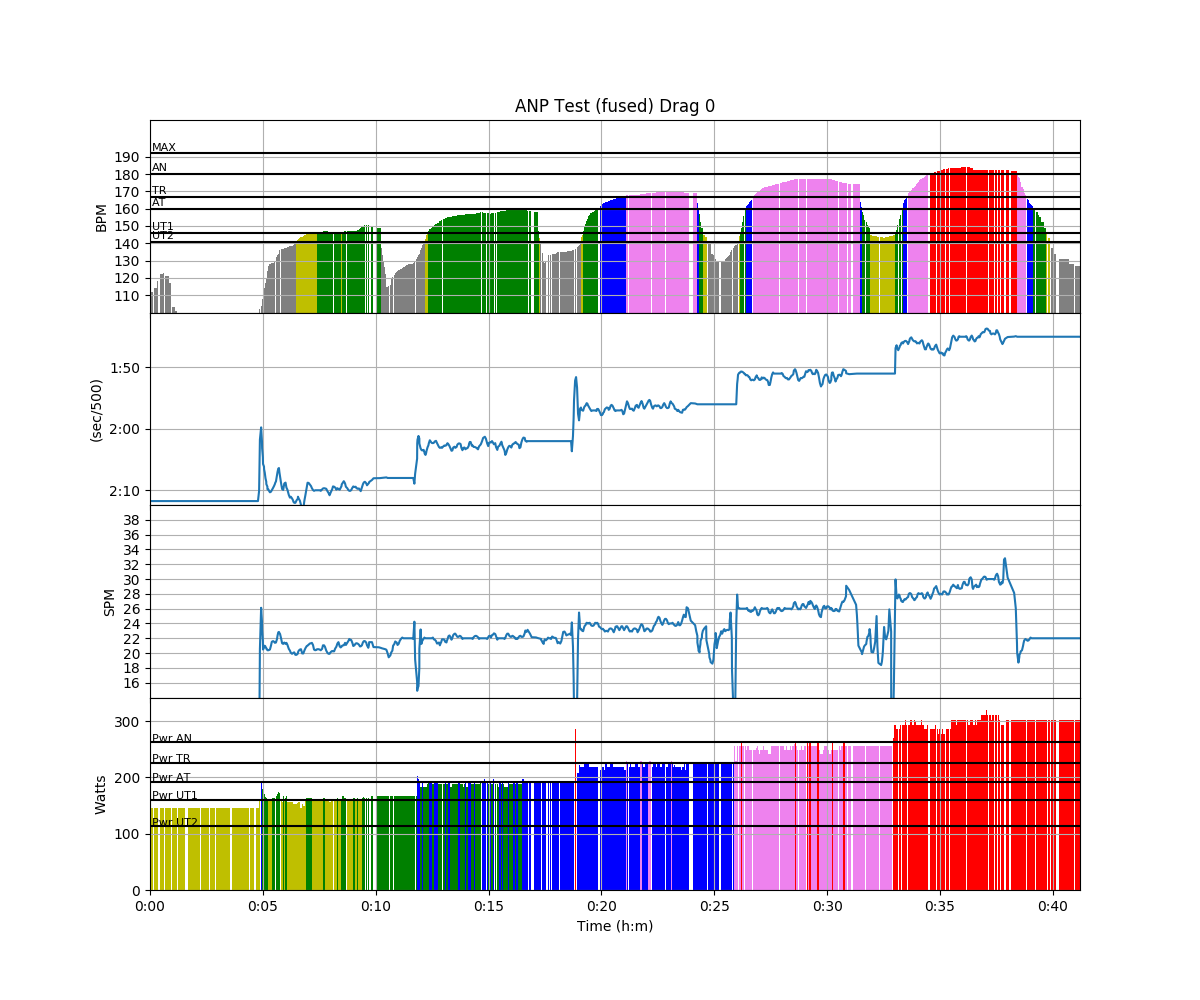
Not sure what to think of the following chart:
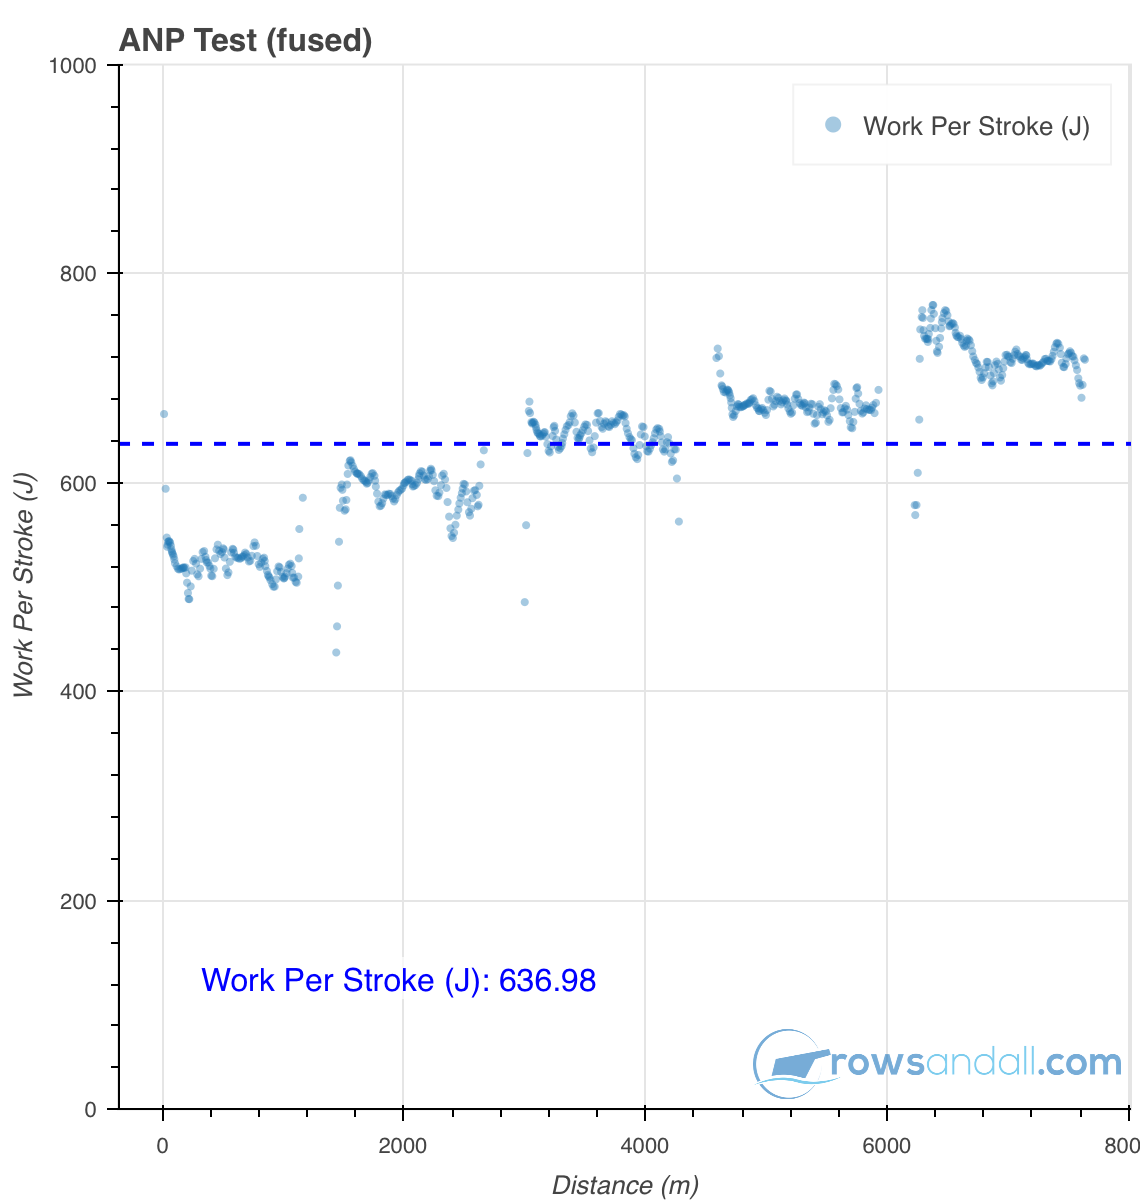
I was quite constant in stroke length, so I obviously varied the force from interval to interval. I am wondering if the Lactate values would be different with constant drive force, varying the stroke rate more.
Anyway, the blood samples are now traveling to the lab, and I will know the results on Tuesday. That is the only advantage of doing Lactate tests yourself: you can play with the data immediately.
Follow me in social media
Like this:
Like Loading...
Nov 11 2017
Lactate Step Test
Today was Lactate Day at our rowing club. The kids who are in a performance program get this paid by the federation, and for us Masters and other less promising rowers there is the opportunity to pay and participate. I happily did that, because it is much more convenient than doing it myself.
The tests were done by two ladies from the university. We had 6 ergs lined up and the testing protocol was 5 intervals of 5 minutes, with 2 minutes rest. The second erg started 1:10 minutes after the first, and so forth, so the ladies had 1:10 to collect the data after each interval and they were continuously occupied.
You finish an interval, the two ladies come to you. One writes down your heart rate, and the other takes some blood from your ear lobe. The only thing I had to focus on was rowing at the prescribed Power values.
Here is a picture I took after my row, of the last group. Notice that we had participation from the other club in town, who do these tests on sliders. We row on static ergs.
For me, the levels were 160, 190, 220, 250, and >280 Watt.
I had to do some data fusion to merge the heart rate data measured with the Garmin and the other parameters measured with PainSled, connected through USB cable to the PM3.
I am pretty happy with the power achieved in the final interval.
The power pie chart is a beauty. I have to share it:
Not sure what to think of the following chart:
I was quite constant in stroke length, so I obviously varied the force from interval to interval. I am wondering if the Lactate values would be different with constant drive force, varying the stroke rate more.
Anyway, the blood samples are now traveling to the lab, and I will know the results on Tuesday. That is the only advantage of doing Lactate tests yourself: you can play with the data immediately.
Follow me in social mediaShare this:
Like this:
By sanderroosendaal • rowing • 0 • Tags: concept2, erg, lactate test, rowing