Nov 11 2016
6k Season’s Best
My wife Romana told my I was crazy to plan a 6k full out attempt for a Friday. I agree that being tired at the end of the working week is not the ideal preparation. On the other hand, Friday is the only day where I have a chance of getting home early enough to do the 6k before dinner.
The (ambitious) plan was to try and row a 1:51.5 average pace.
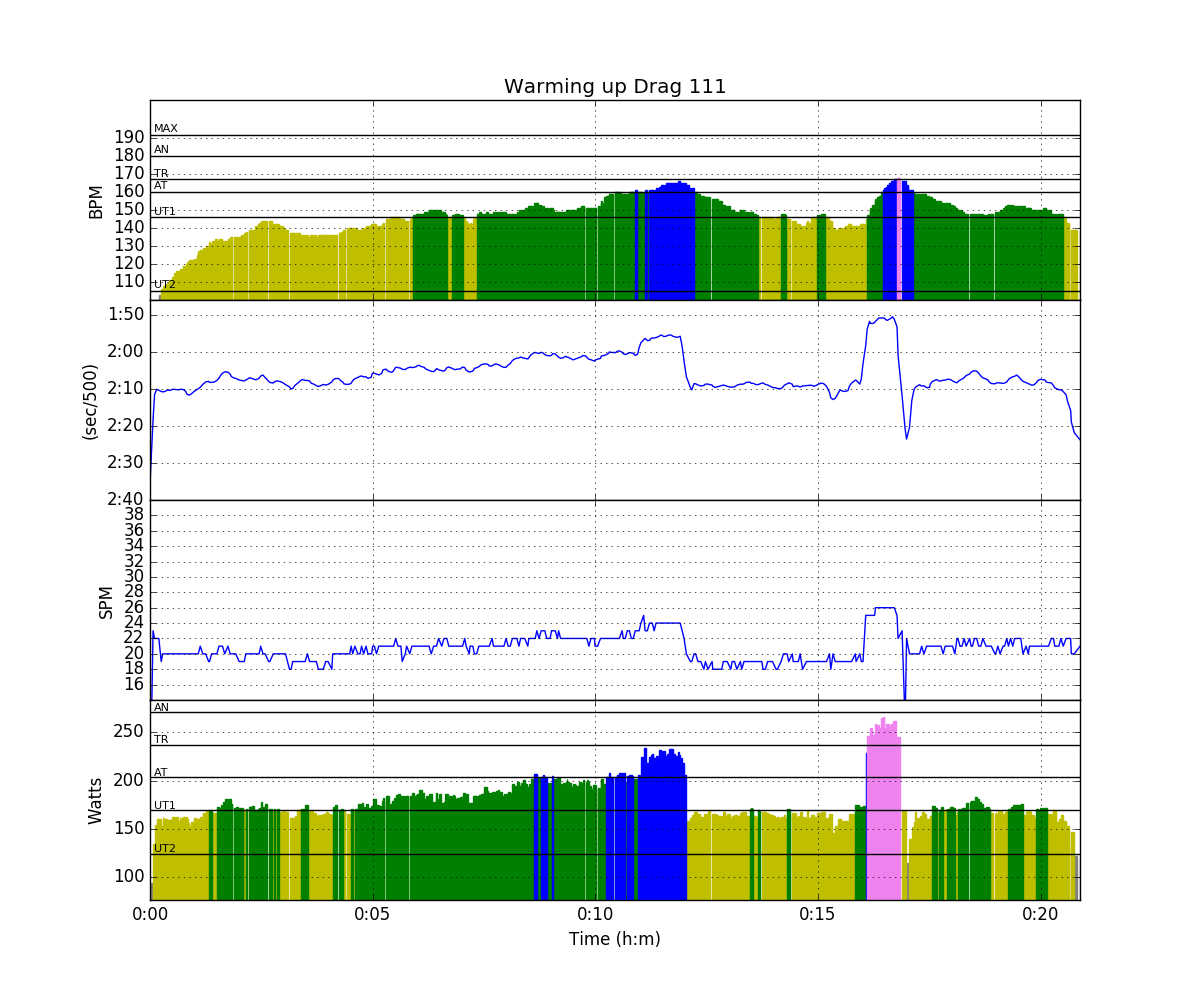
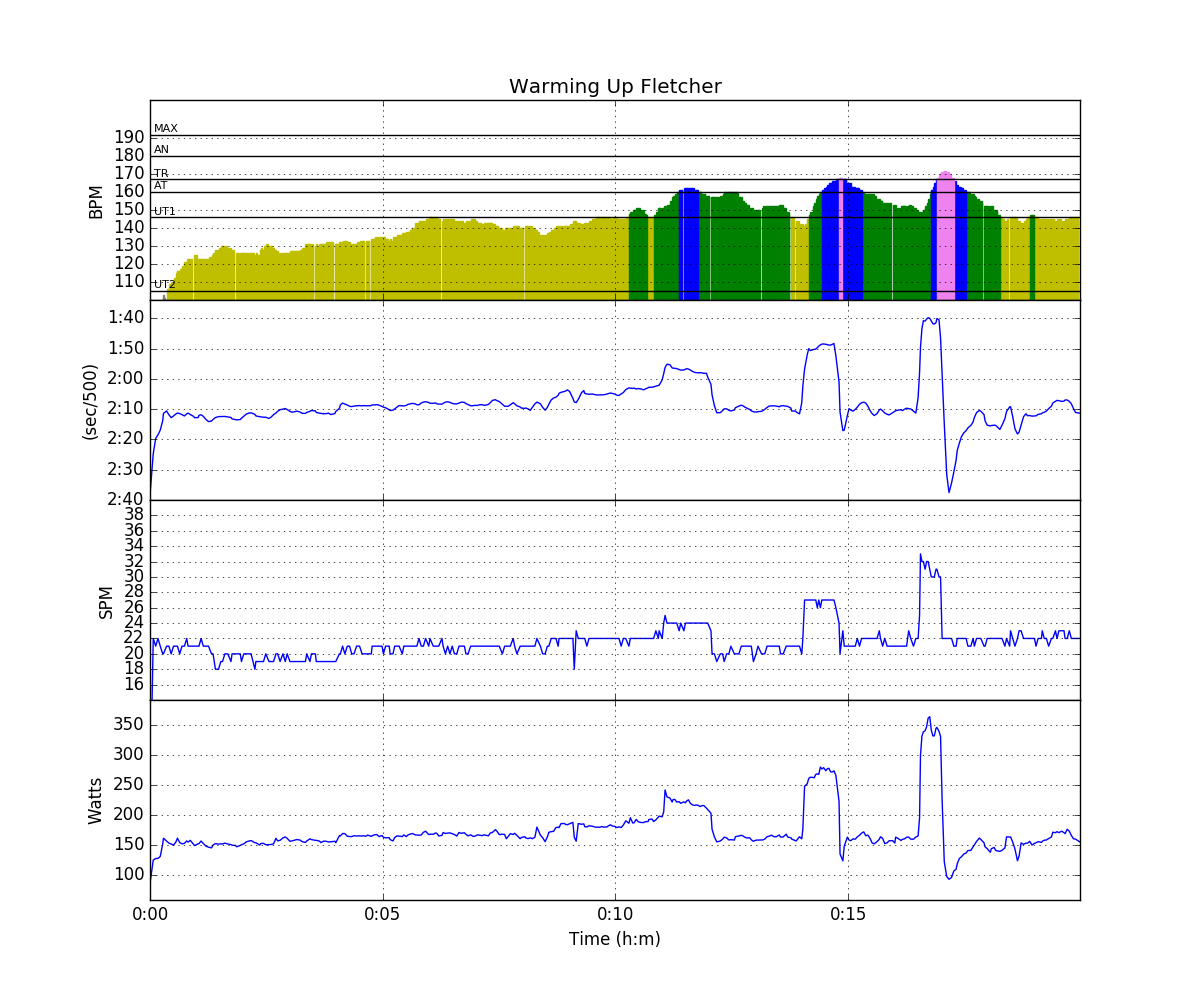
First, I did a thorough warming up:
Then on to the main event. The plan was to start conservatively and hold the average pace at 1:52 until I reached 1800m to go.
Of course, trying to hold 1:52, I pulled 1:51 and even 1:50 more frequently than 1:53, and so I reached the half way point with an average pace of 1:51.5. Still, it seemed to take ages to reach 4500m to go. I went by 300m intervals. They go by fast enough to see progress, and there’s “just” twenty of them.
I tried to remind myself to remain conservative, but a few times in the 4500m to 1500m interval I got carried away and started pulling 1:50 strokes.
In the end, I paid for that. With 900m to go I started counting sets of 12 strokes. With 600m to go I was convinced I wouldn’t make the end without going above 2:00 pace. In the end I limped home with 1:54 pace.
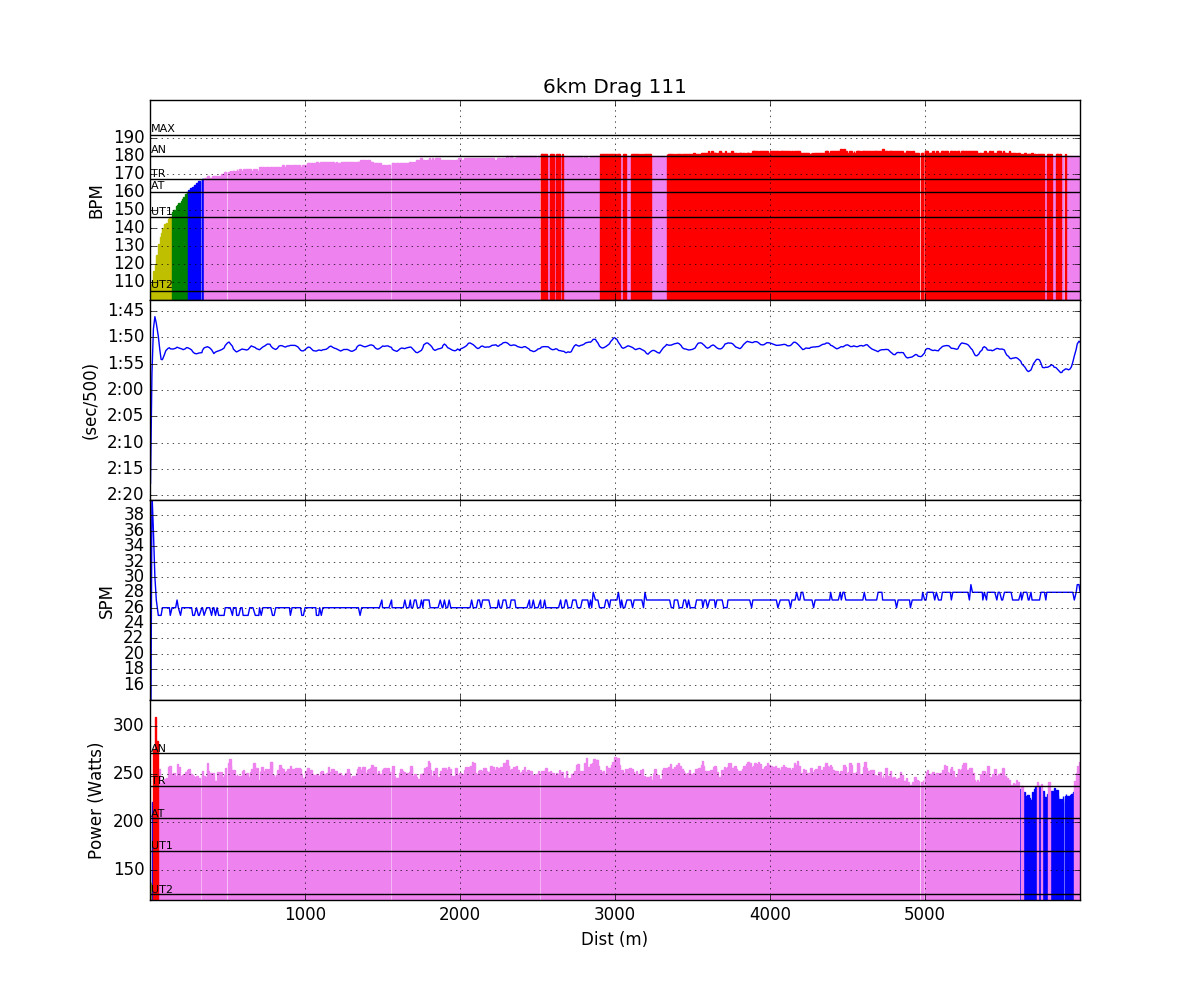

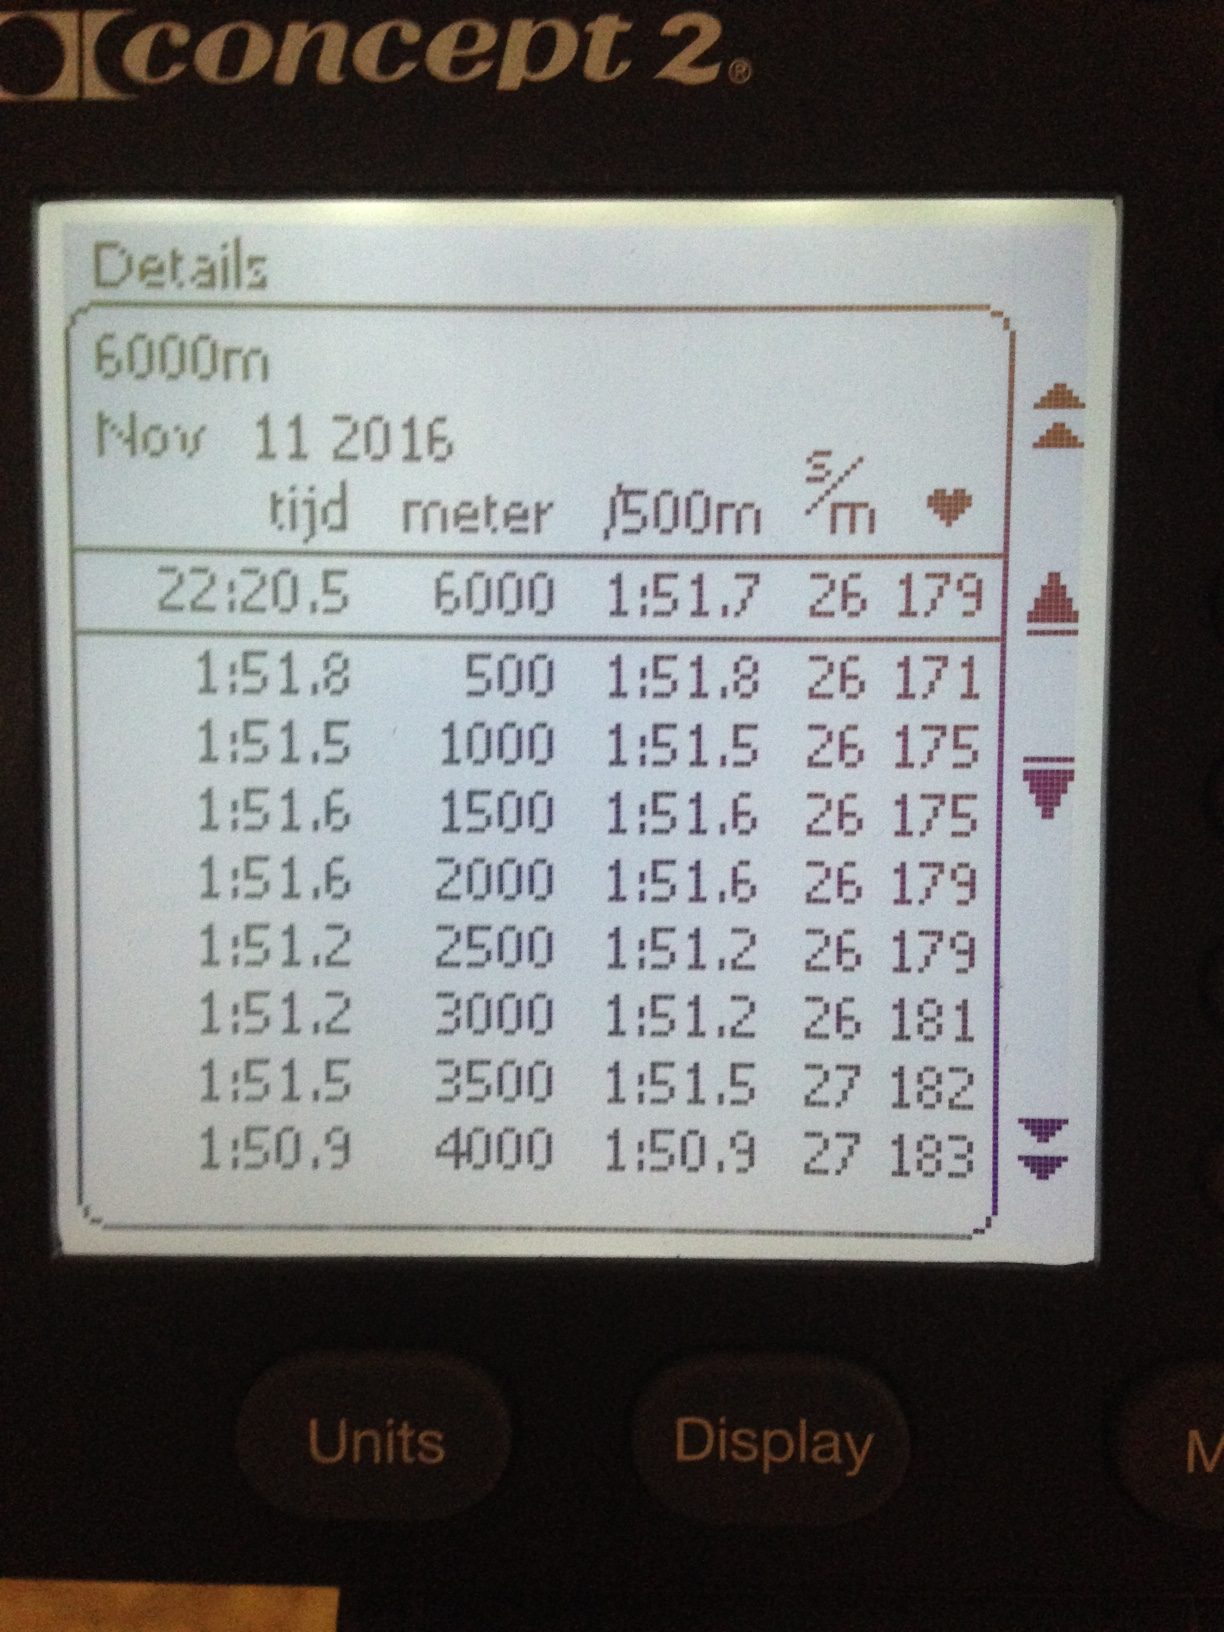
Summary:
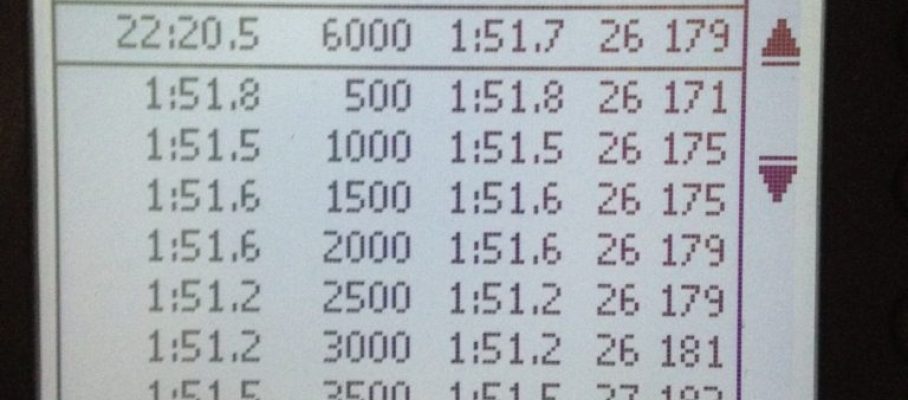
Workout Summary - media/20161111-17100719o.csv

--|Total|-Total-|--Avg--|Avg-|-Avg-|-Max-|-Avg

--|Dist-|-Time--|-Pace--|SPM-|-HR--|-HR--|-DPS

--|06000|22:20.5|01:51.7|26.7|177.9|184.0|10.1

W-|06000|22:20.5|01:51.7|26.6|177.8|184.0|10.1

R-|00000|00:00.0|00:00.0|00.0|000.0|184.0|00.0

Workout Details

#-|SDist|-Split-|-SPace-|SPM-|AvgHR|MaxHR|DPS-

01|00500|01:51.8|01:51.8|25.8|154.6|171.0|10.4

02|00500|01:51.5|01:51.5|25.7|173.6|175.0|10.5

03|00500|01:51.6|01:51.6|25.9|176.8|178.0|10.4

04|00500|01:51.6|01:51.6|26.3|177.3|179.0|10.2

05|00500|01:51.2|01:51.2|26.3|179.2|180.0|10.3

06|00500|01:51.2|01:51.2|26.5|180.4|181.0|10.2

07|00500|01:51.5|01:51.5|26.8|180.6|181.0|10.0

08|00500|01:50.9|01:50.9|26.8|182.2|183.0|10.1

09|00500|01:51.1|01:51.1|27.1|182.7|184.0|10.0

10|00500|01:52.2|01:52.2|27.1|182.8|184.0|09.9

11|00500|01:51.6|01:51.6|27.8|182.6|183.0|09.7

12|00500|01:54.3|01:54.3|27.7|180.9|183.0|09.5
I did this “beginning of the winter” 6k exactly a year ago, on November 11, 2015.
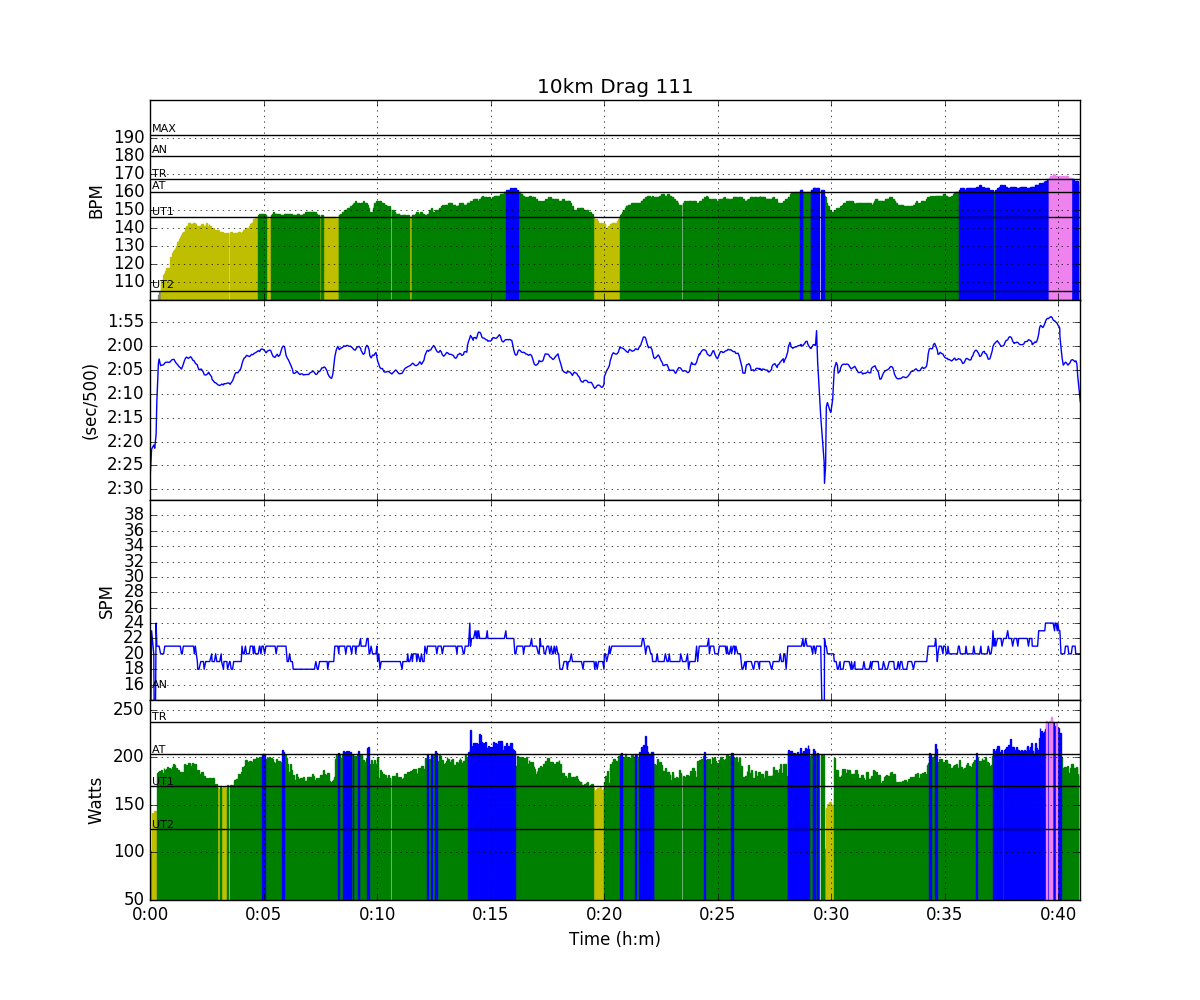
Then, I did a 22:28 time with an average heart rate of 177 bpm. Today it was 22:20, with an average heart rate of 178bpm. A year ago, I used a spreadsheet to analyze the row. Today, I can use the power of rowsandall.com and have additional interesting graphs:


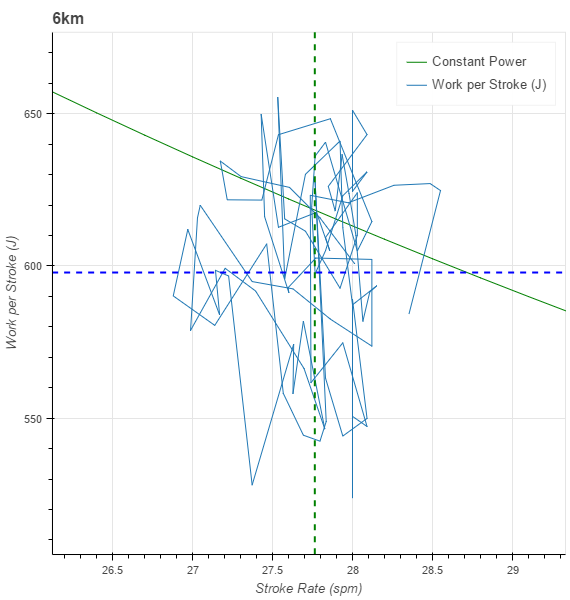
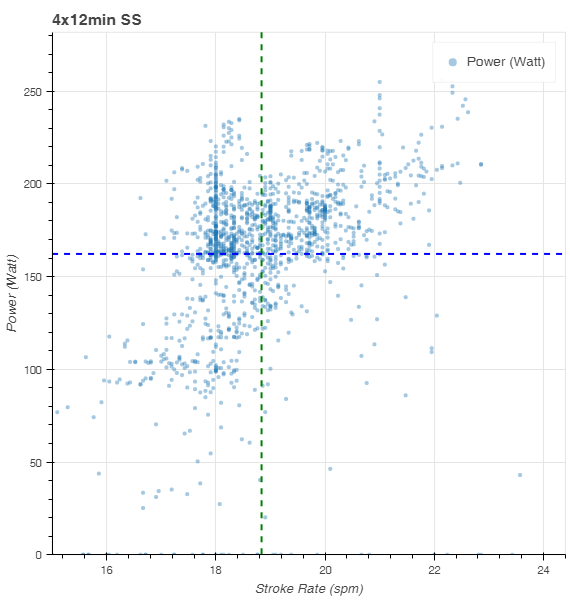
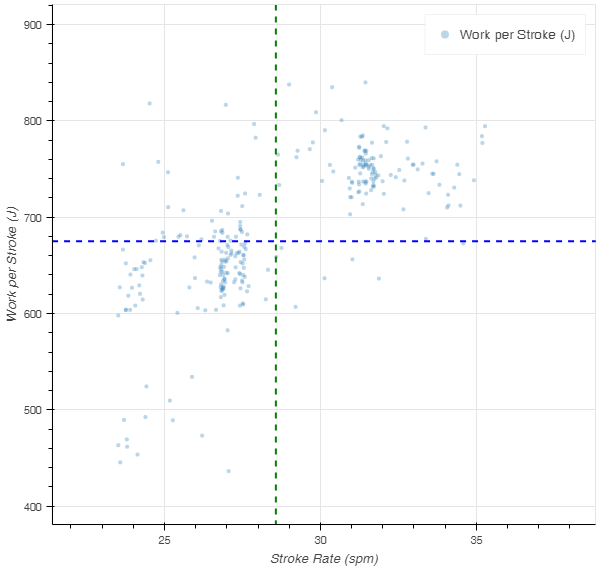
In the Work Per Stroke plot, you can see how I used a range of stroke rates to try and remain at the same average pae (the green line). On the site, I can actually select the first half of the row and compare it with the second half:


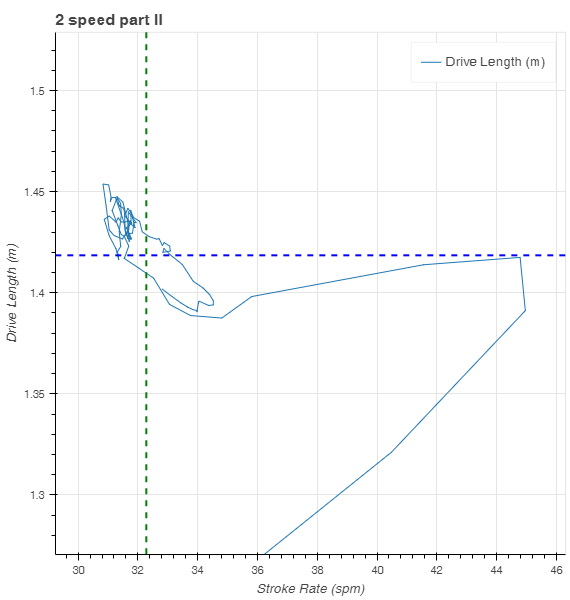
And here is that dramatic last 1000m:
First, you see me rate down and increase the work per stroke. Then I fall down to a lower force per stroke. In the final strokes I rate up a bit but the work per stroke goes down even more.
After the row, I sat on the erg holding the bar. I was afraid to faint.
I didn’t faint. After five minutes of just sitting there, I had enough energy to do a 10 minute cooling down.


Nov 13 2016
Some Meditation on a 6k, and a run
Some Meditation on a 6k
This first plot is a comparison (made on rowsandall.com) between Friday’s 6k and the PB I set in February, which was 7 seconds faster. You can clearly see that on Friday my heart rate rose faster than on that PB. Actually, on Friday I was rowing faster than my PB schedule for the first 4 km. Just slightly, but looking at the February row, I allowed myself to pull more 1:52 strokes than I did last Friday. The difference is very very small, just 0.2 seconds in average.
But it’s interesting to look at “the scribbles”. The plot below looks like something your 1 year old daughter might draw, but it’s actually quite interesting. At least for me.
The red scribble is Friday’s row. The blue one is my PB. You can clearly see that the bulk of the row (the first 4 to 5km) is very similar. The difference is that in February I didn’t drop the stroke rate so low. I must have rowed more forceful strokes last Friday, and I wonder if that wore me out somehow.
After 4.5km it starts to become really interesting. In February I managed to climb to the top right of the graph (high watts at high stroke rate), while last Friday I climbed just a little and dropped the watts.
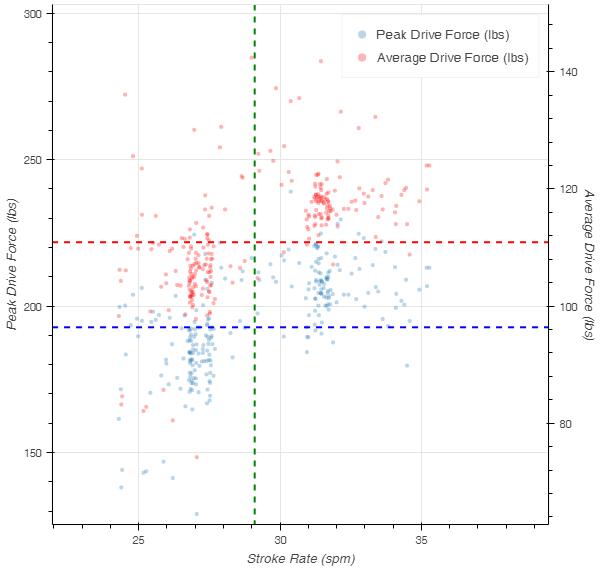
It’s a pity I didn’t have Painsled back then. If I had, I could have compared the average drive force for the two rows.
Instead of comparing with my PB row, I should perhaps compare with the row I did on November 11, 2015, exactly a year before Friday’s row.
In 2015, I rowed a 22:28, 8 seconds slower than on Friday, but it looks like the whole graph is shifted to the left by 1spm. In other words, a year ago, I rowed a higher stroke rate to achieve the same watt number.
In terms of heart rate, the numbers are very similar. An interesting drop in heart rate after about 1500m is present in both rows. I wonder what that is.
Saturday’s run
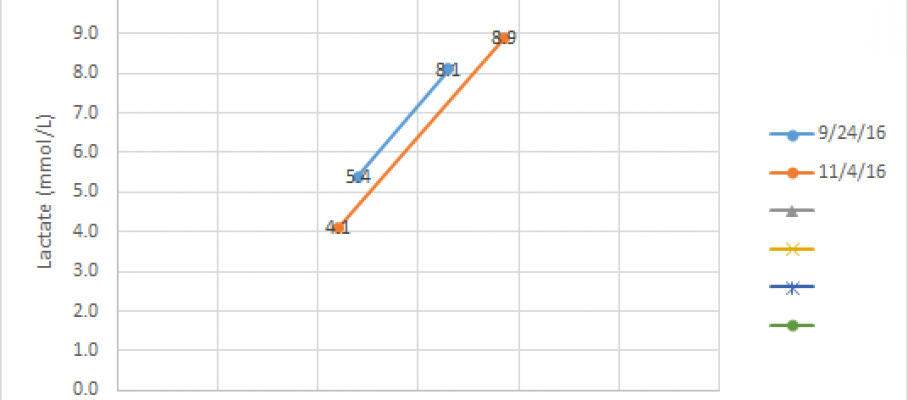
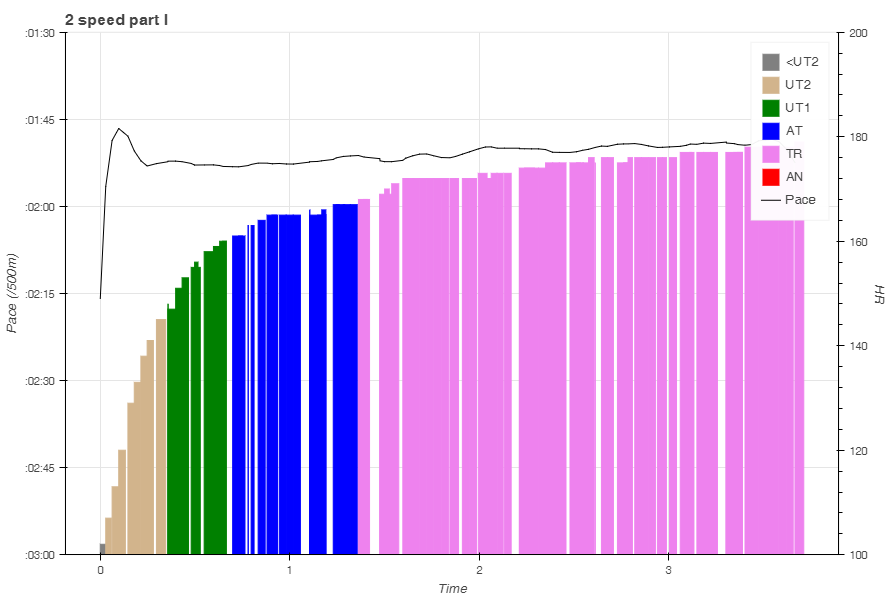
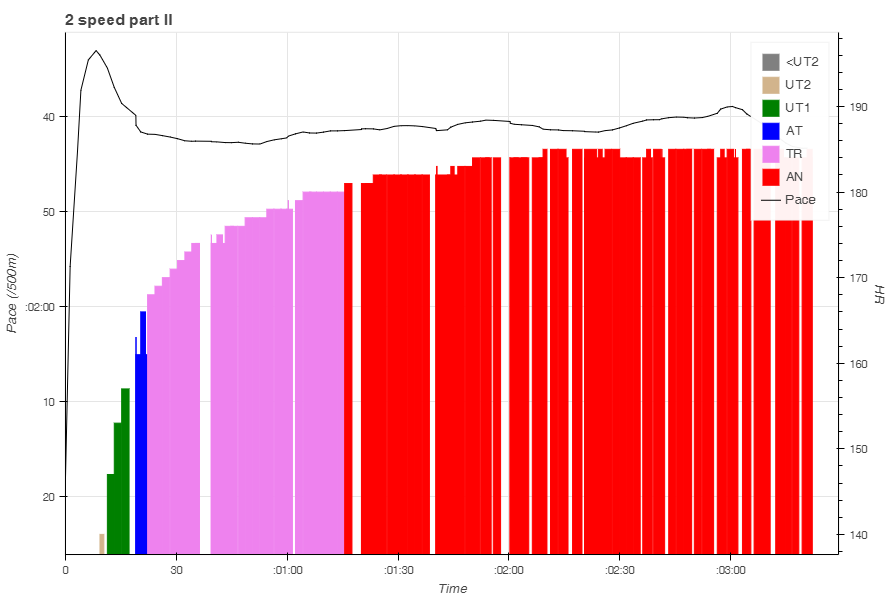
Headed to the lake in the morning. There was a big lactate testing going on. All rowers who are in selections for national teams need to do a lactate step test. The protocol was prescribed by the national rowing federation. Interestingly, it was 5 minutes with 2 minutes rest, 5 steps at prescribed watts. The watts were given by a table for sex and age category. Also, they had to be rowed on ergs on sliders.
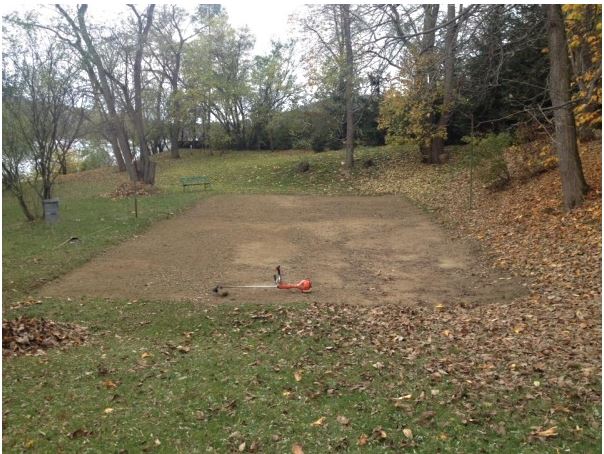
The tests were combined with the other rowing club, so the locker room and erg room was full. We cannot row OTW because our summer dock is about 1m above the water level and nobody bothered to put out a winter dock.
I decided to go for a run.
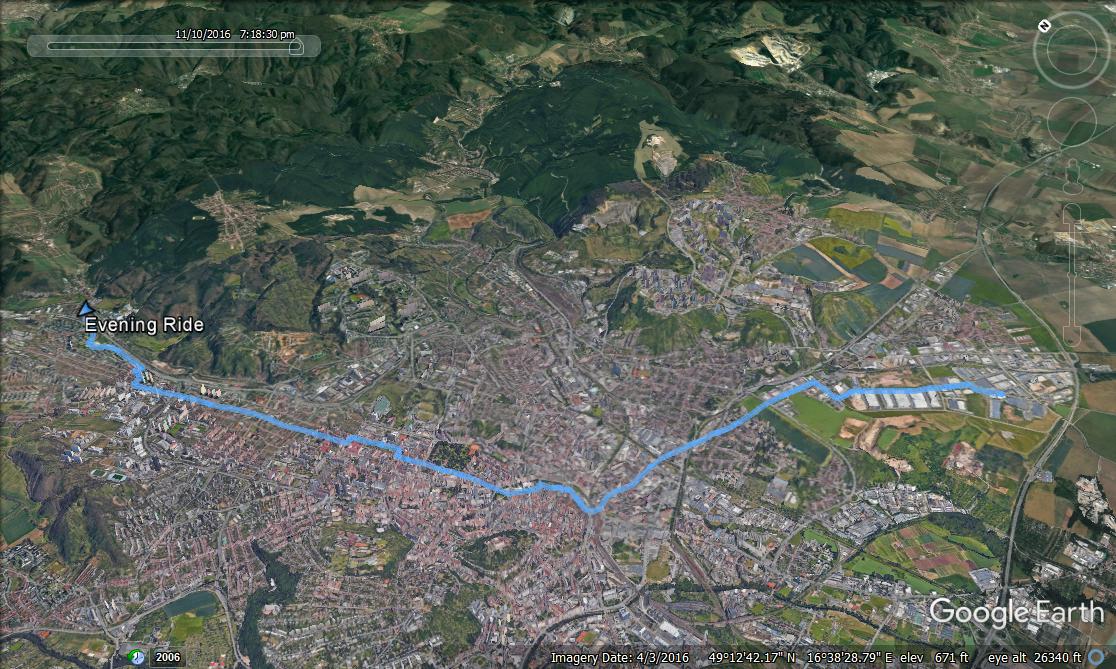
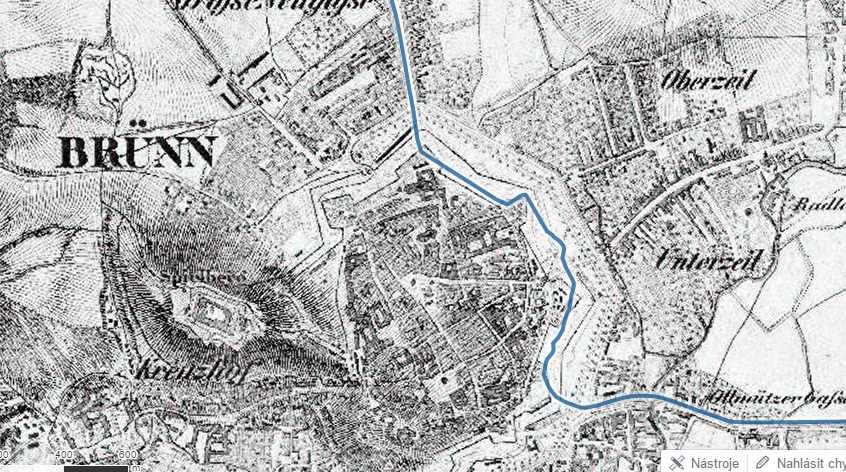
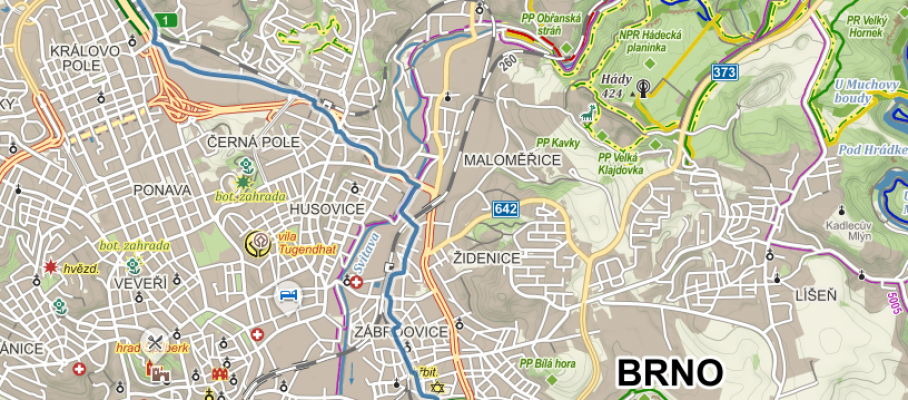
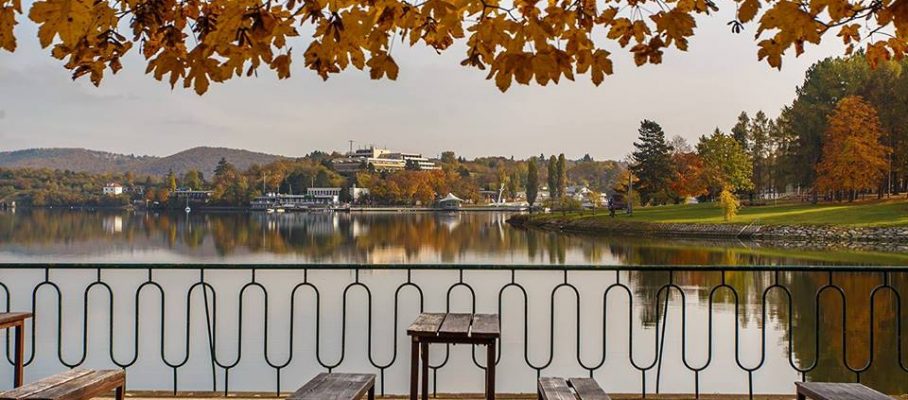
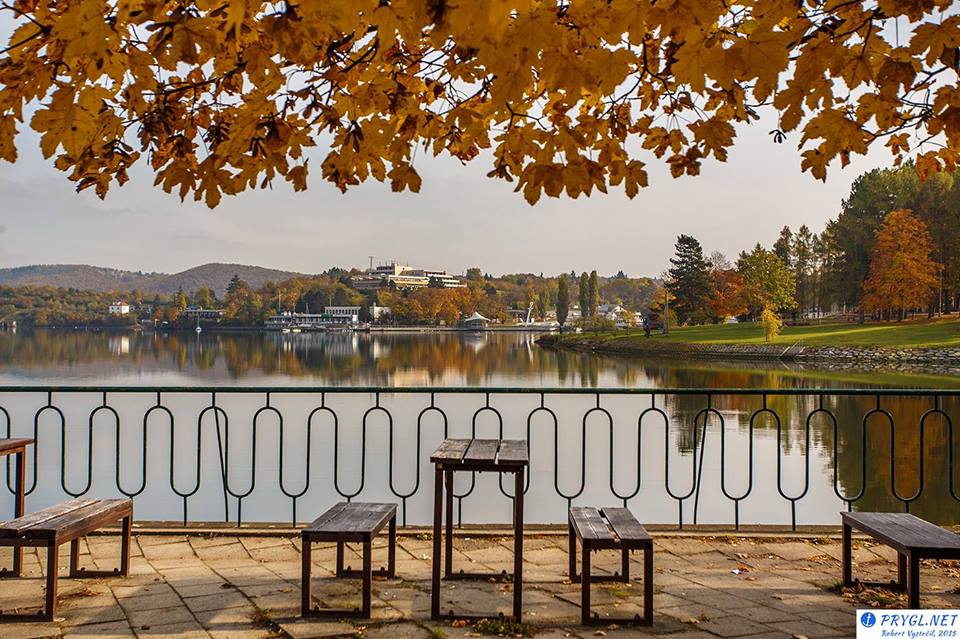
I ran along the lake, then along the river, towards the castle. Just before the castle, I turned right on the blue trail. I was wondering if I could make a loop, but was afraid that that would make the run too long.
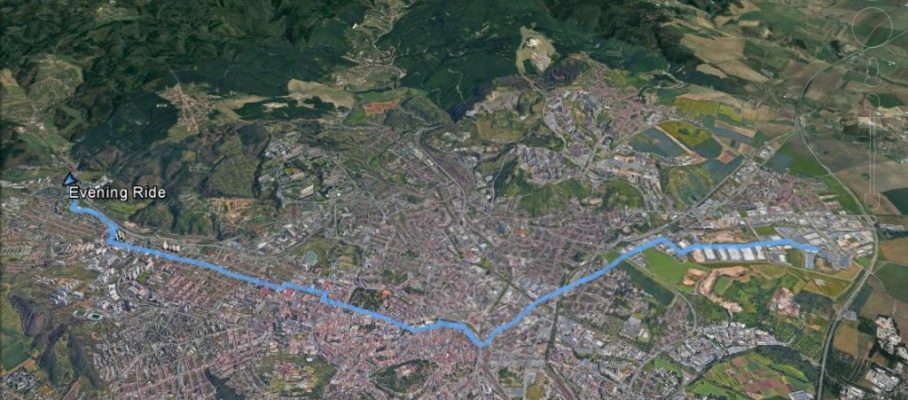
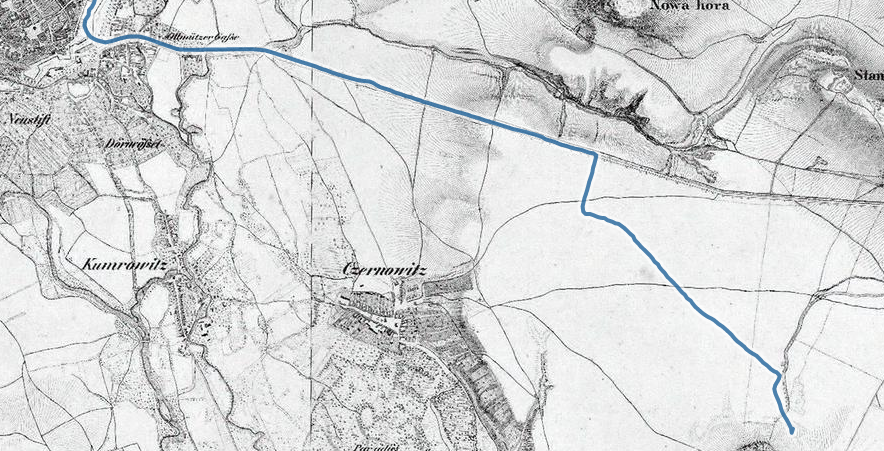
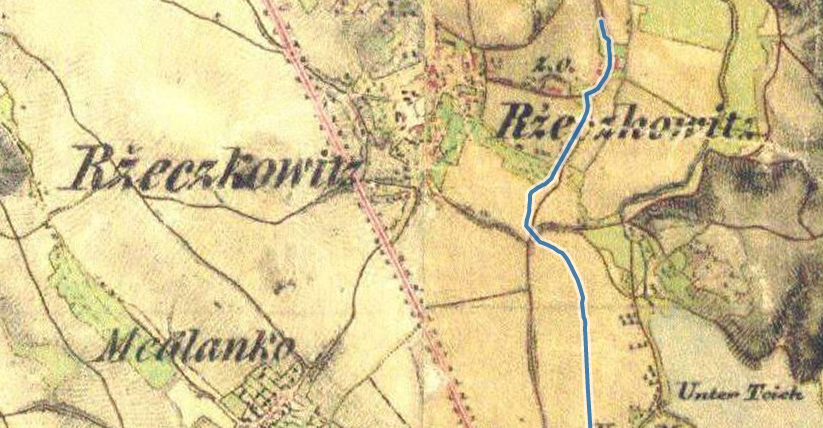
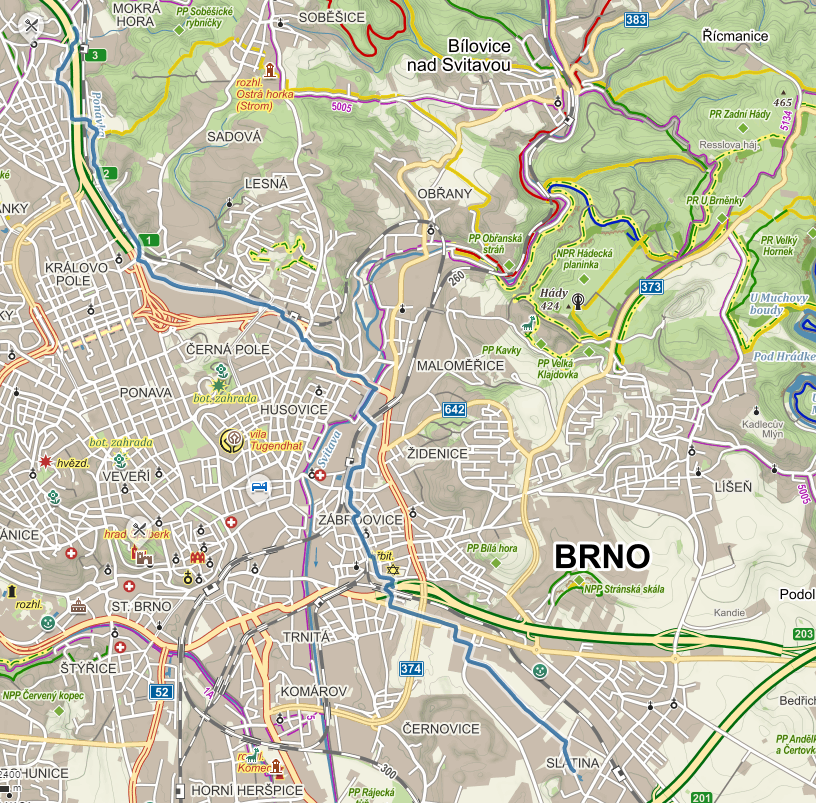
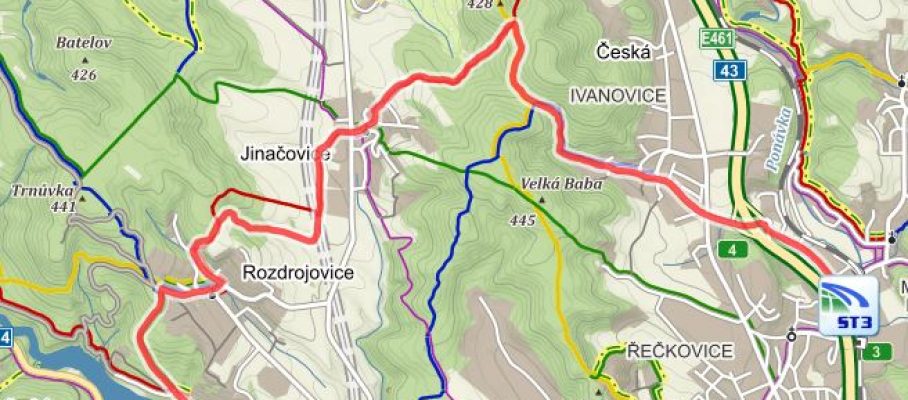
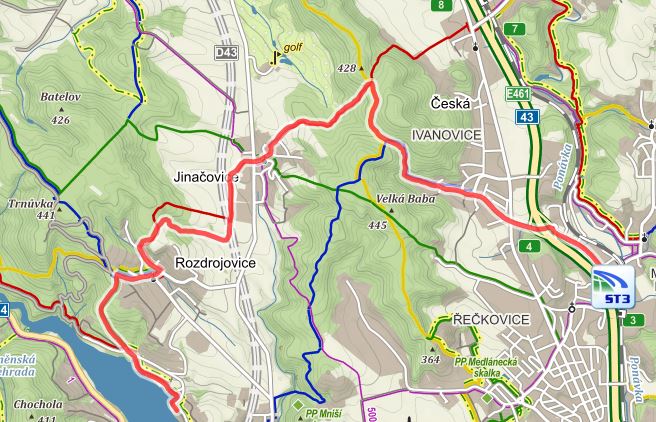
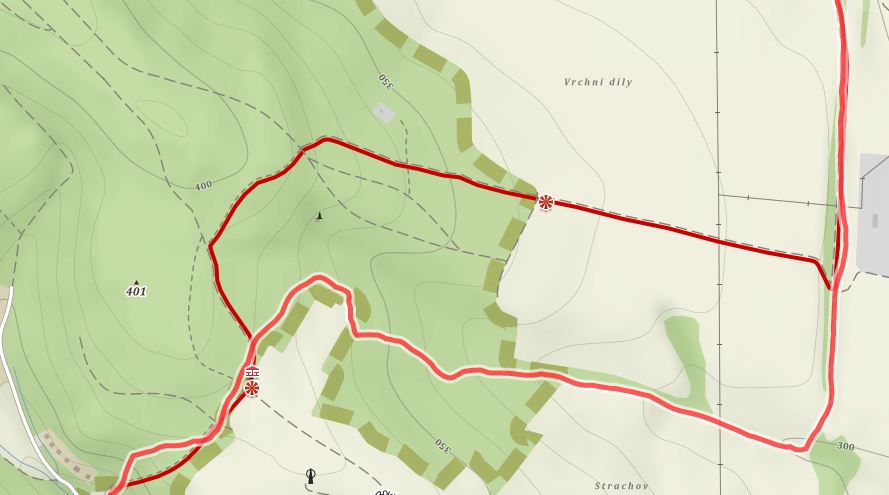
Here is my run overlaid on a tourist map of the region. The colored lines are hiking/running trails. My run is the thick light blue line starting on the lake shore in the bottom right corner. Here’s is what I should try and run next time:
Continue on the blue trail, run around the hill, pass Trnůvka, take the green trail at Rozdrojovice and get back to the lake at restaurant Princezna. But I guess it would be a bit longer than the 12km that I ran this time.
Here’s the run on Strava: https://www.strava.com/activities/773028819
It was a nice, slow recovery run.
By sanderroosendaal • Uncategorized • 0 Comments • Tags: recovery, rowing, running, trail, trail running, training