Apr 6 2016
Playing with the PM5 and data tools
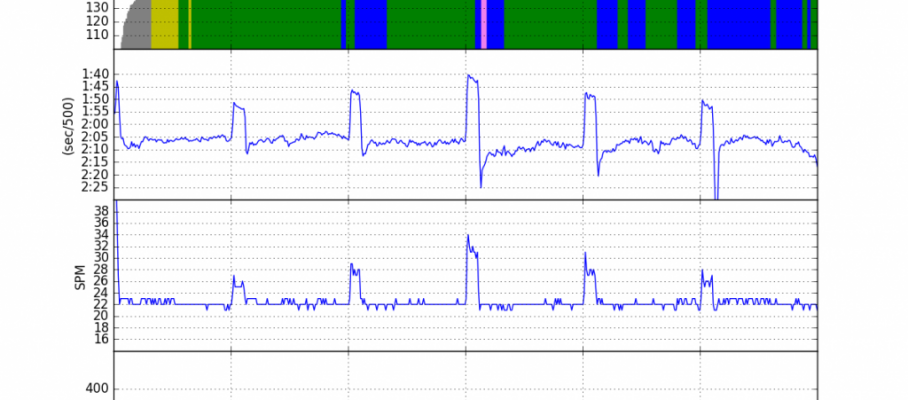
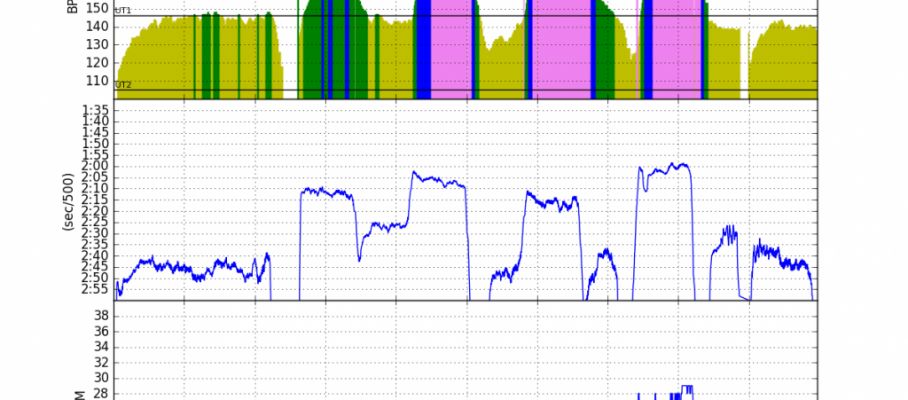
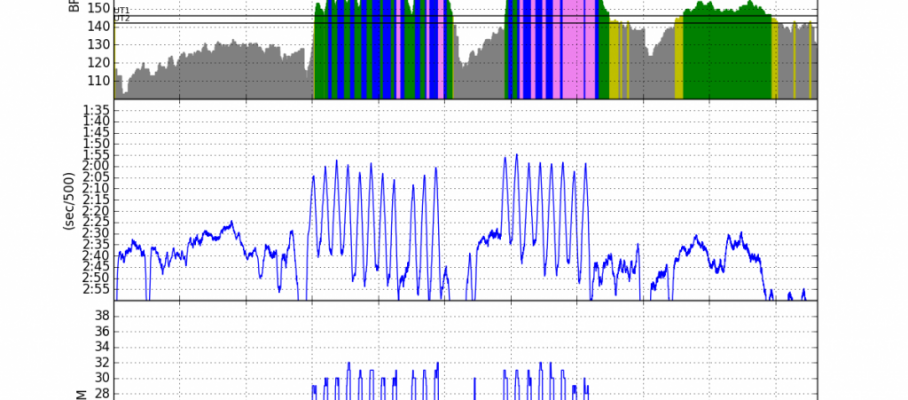
No time for an OTW row today. The taper plan called for a quiet 40 minutes row. I decided to play a bit with the PM5 and the different tools. Here’s what I did:
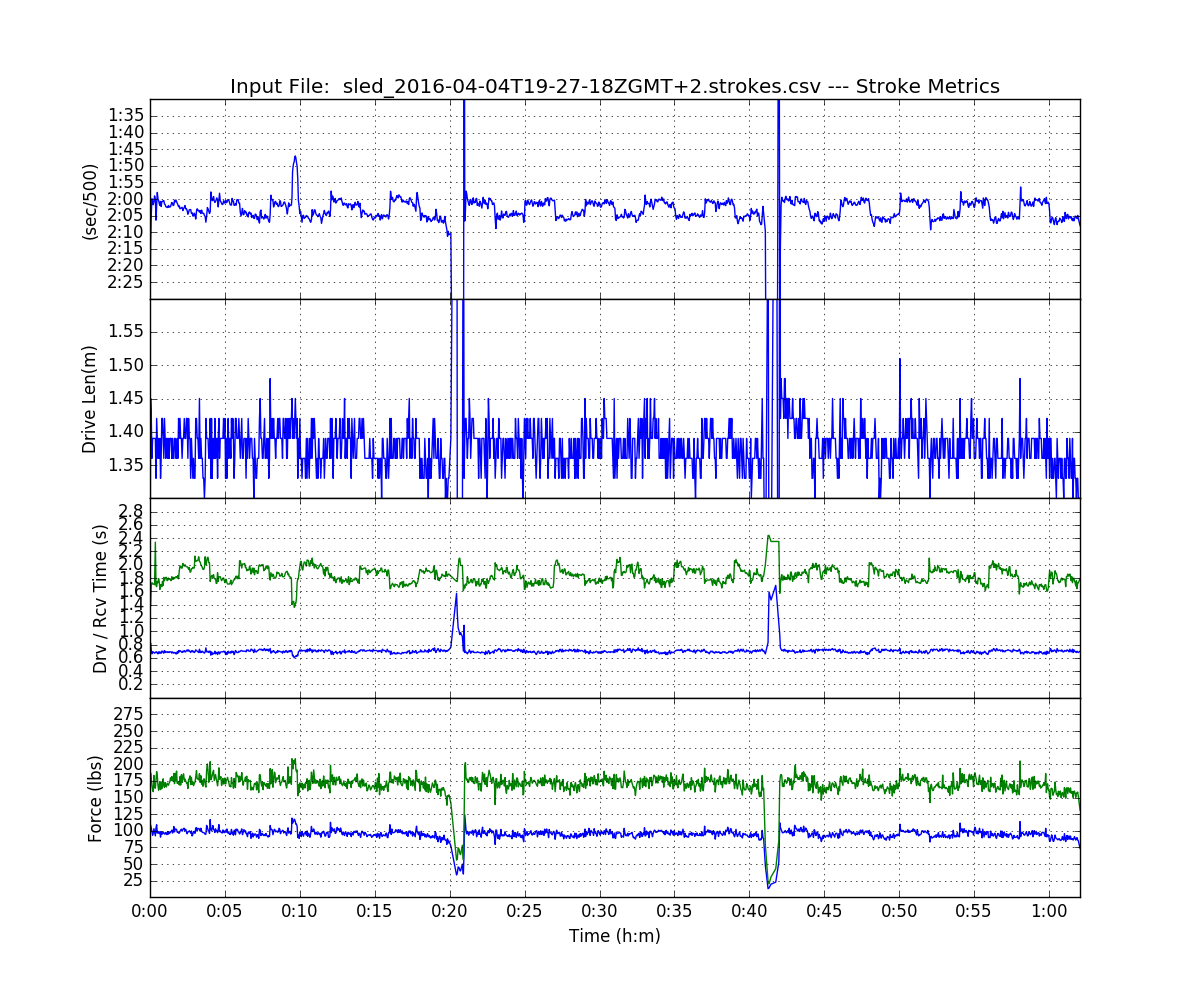
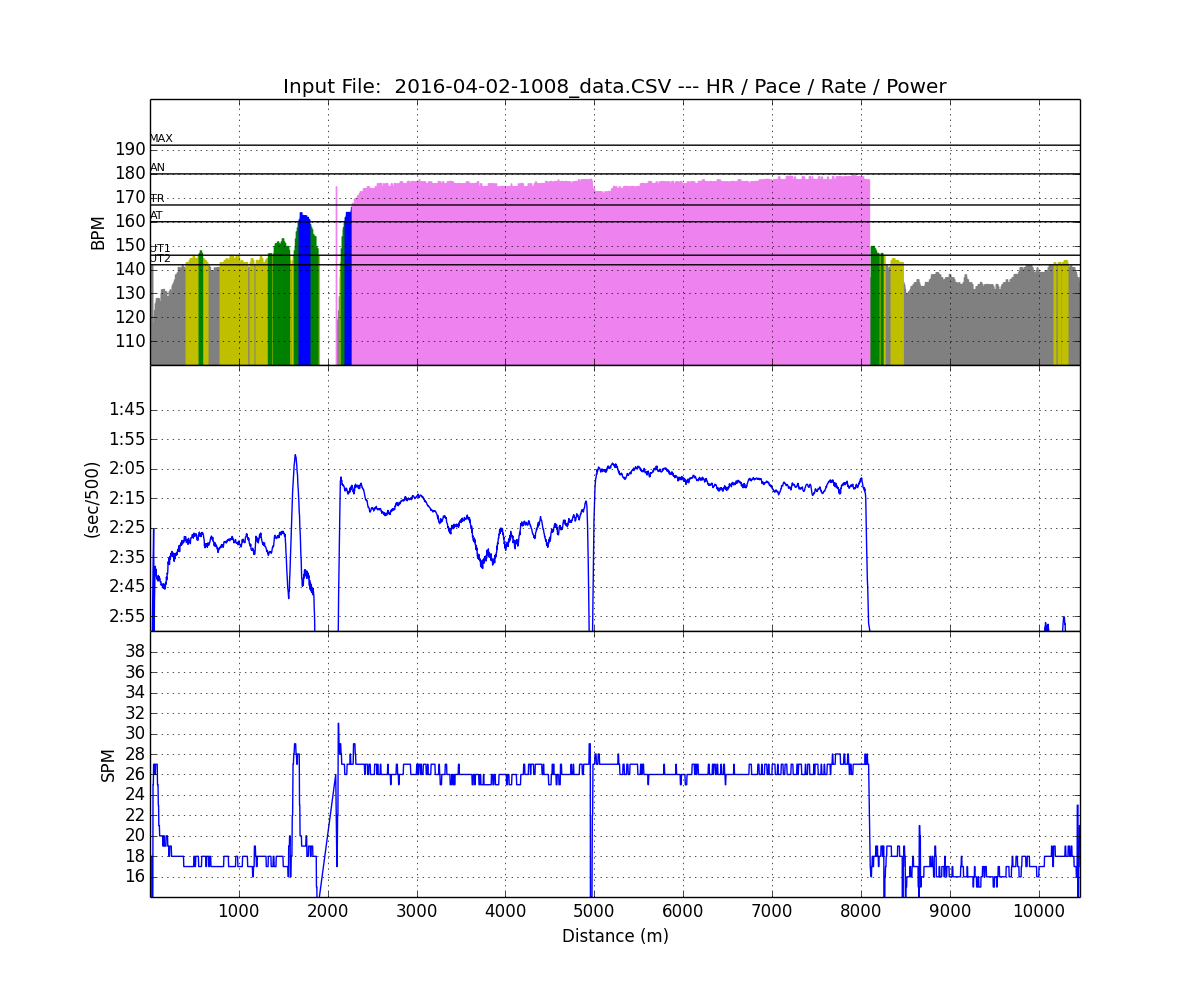
- Row a 2km Warming Up on RowPro. Export data. Process with my python tool.
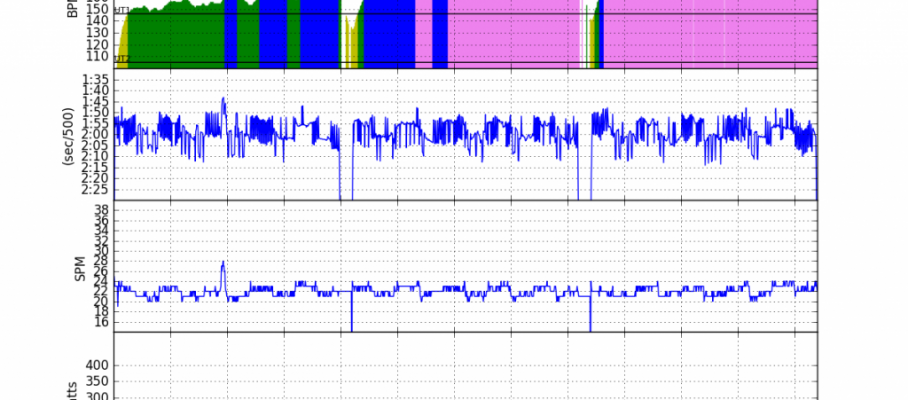
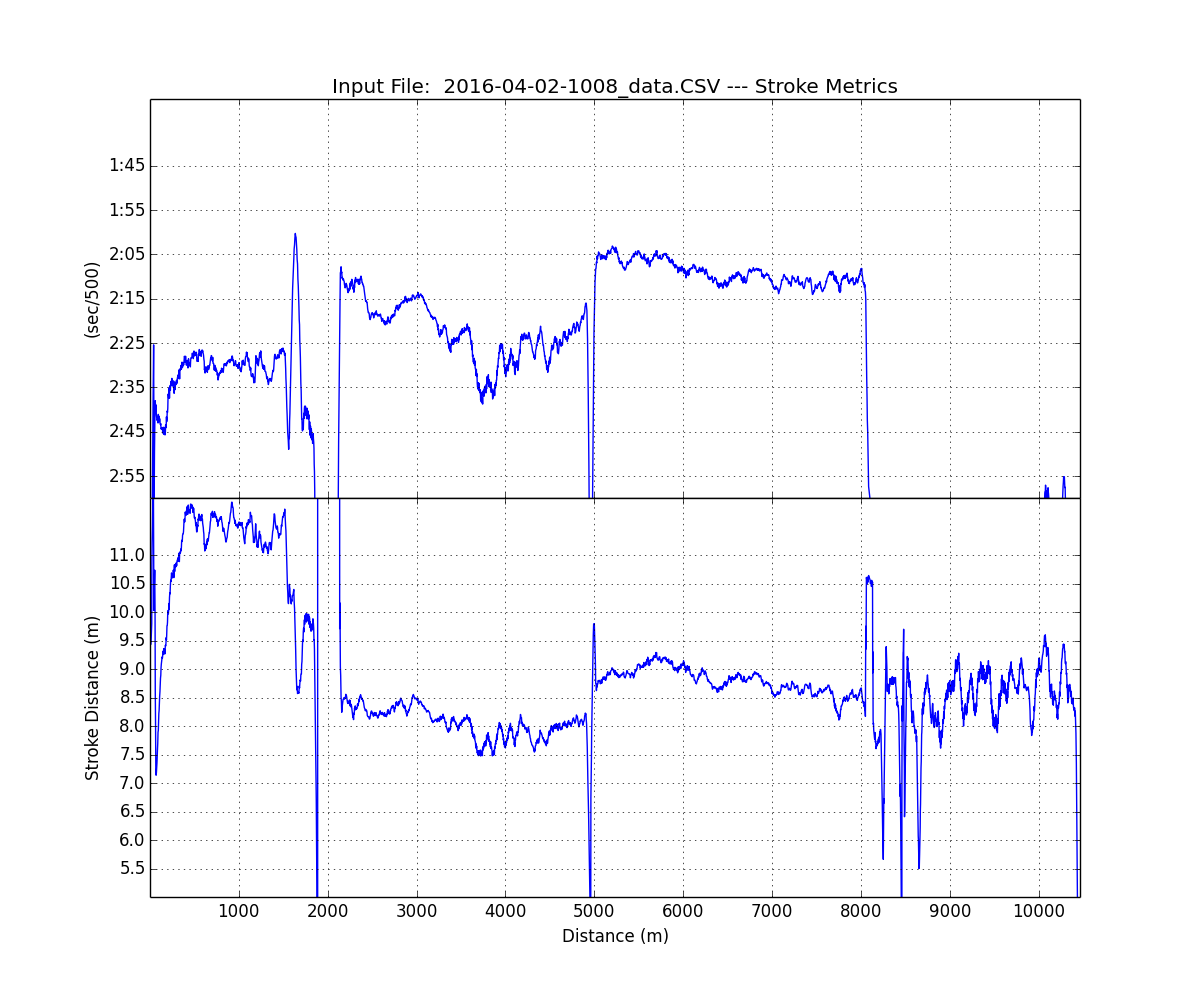
- Row a 6km Main Row on painsled, export data. Process with my python tool
- Row a 2km Cooling Down on ErgData. Export data to Concept2 logbook
It all worked like a charm.
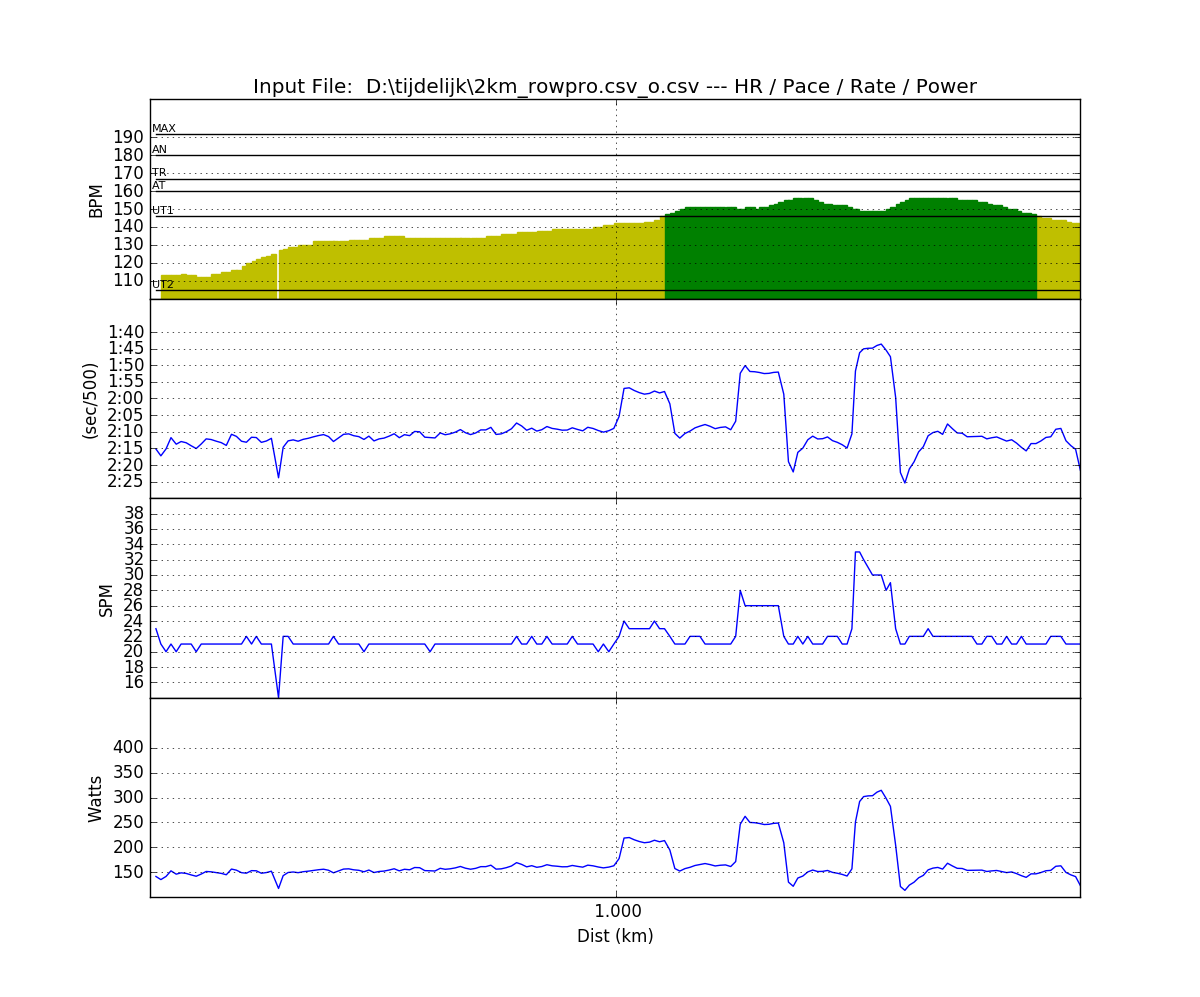
Warming Up (RowPro):
Workout Summary - D:tijdelijk2km_rowpro.csv_o.csv
--|Total|-Total-|--Avg--|Avg-|-Avg-|-Max-|-Avg
--|Dist-|-Time--|-Pace--|SPM-|-HR--|-HR--|-DPS
--|01998|08:35.0|02:09.0|21.9|140.3|156.0|10.6
Main Row (Painsled):
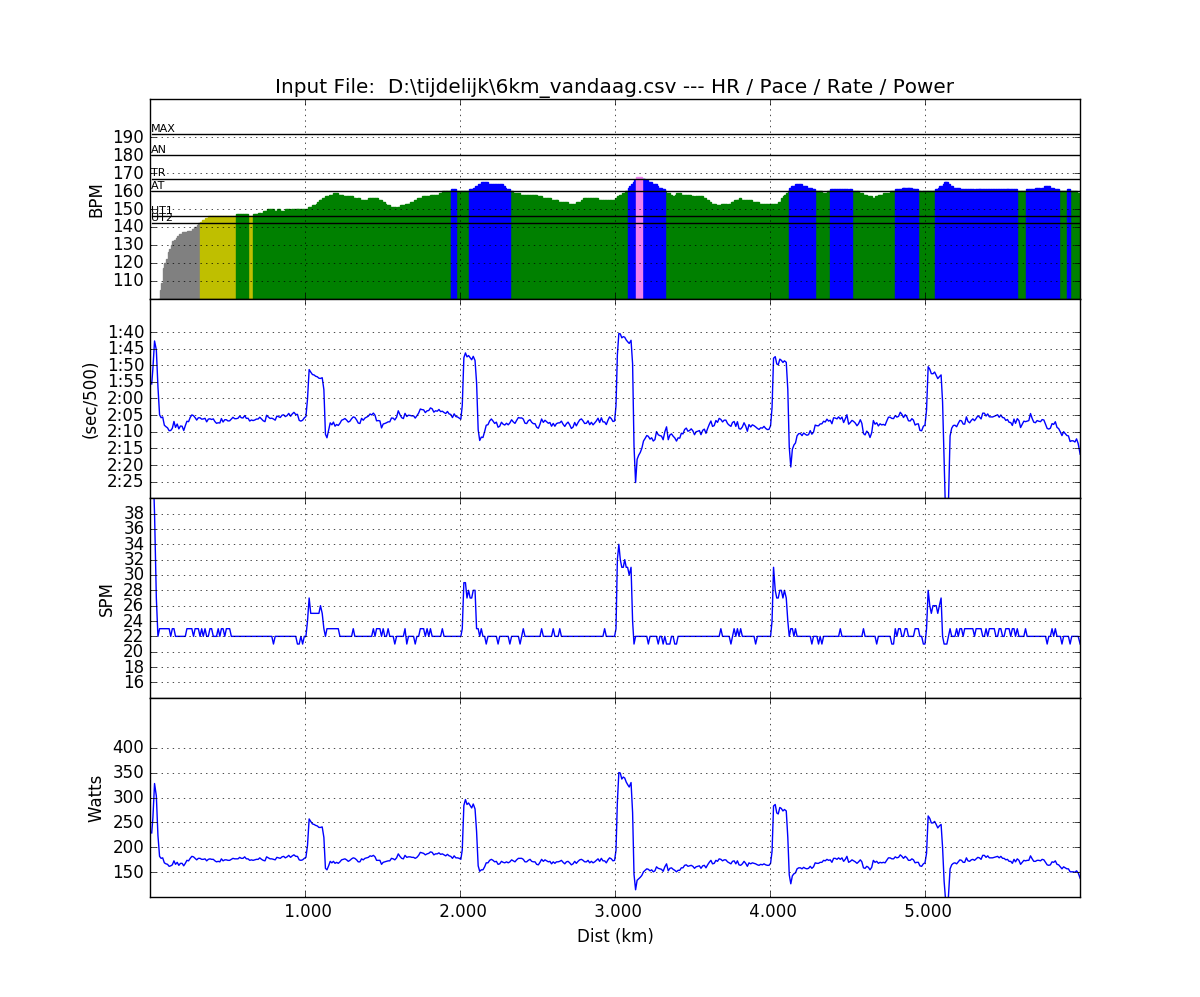
Workout Summary - sled_2016-04-06T07-44-35ZGMT+2.strokes.csv
--|Total|-Total-|--Avg--|Avg-|-Avg-|-Max-|-Avg
--|Dist-|-Time--|-Pace--|SPM-|-HR--|-HR--|-DPS
--|06000|25:06.0|02:05.6|22.7|155.5|168.0|10.5
Workout Details
#-|SDist|-Split-|-SPace-|SPM-|AvgHR|MaxHR|DPS-
00|01204|04:58.1|02:03.8|23.0|142.6|159.0|10.5
01|01204|04:59.2|02:04.2|22.5|158.0|165.0|10.7
02|01200|05:03.3|02:06.4|22.8|158.0|168.0|10.4
03|01200|05:02.8|02:06.2|22.5|157.6|164.0|10.6
04|01193|05:02.1|02:06.6|22.6|161.2|165.0|10.5
Cooling Down (ErgData):
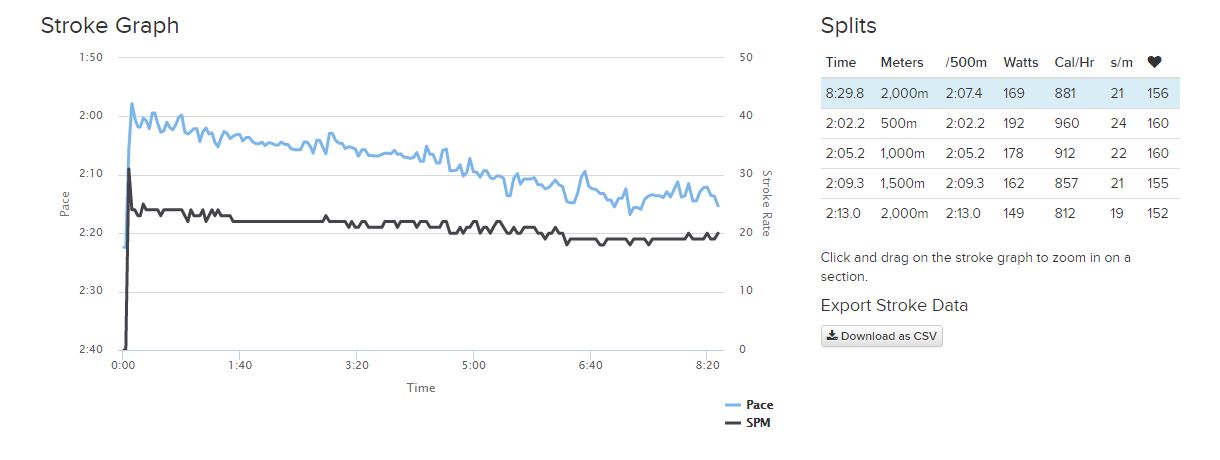
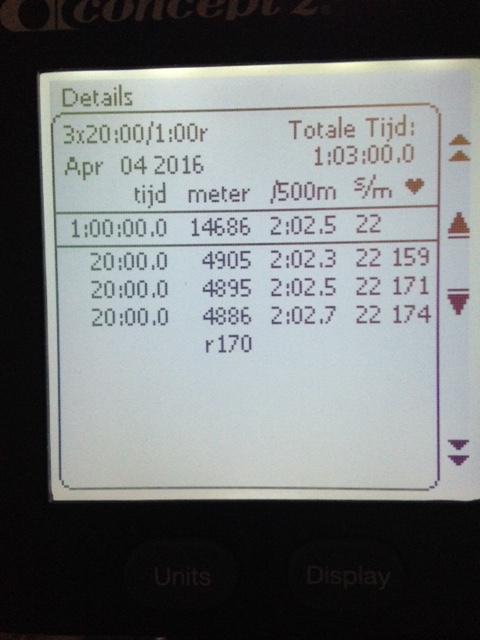
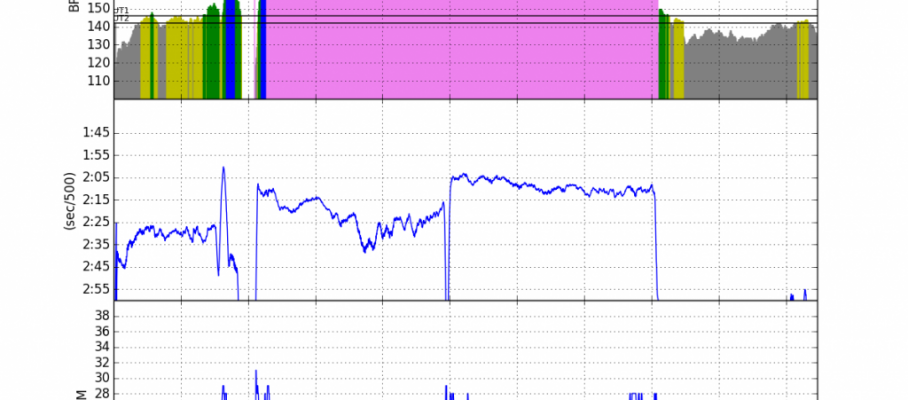
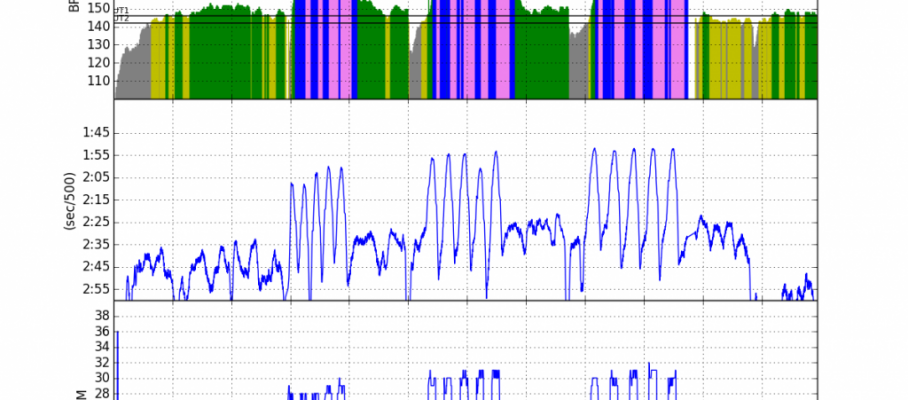
What you see is a screenshot from my Concept2 logbook. I don’t have a parser for the ErgData CSV file in my plotting tool yet. Should not be too difficult. Yesterday, I literally had the SpeedCoach parser written, working and tested in 10 minutes.
Edit
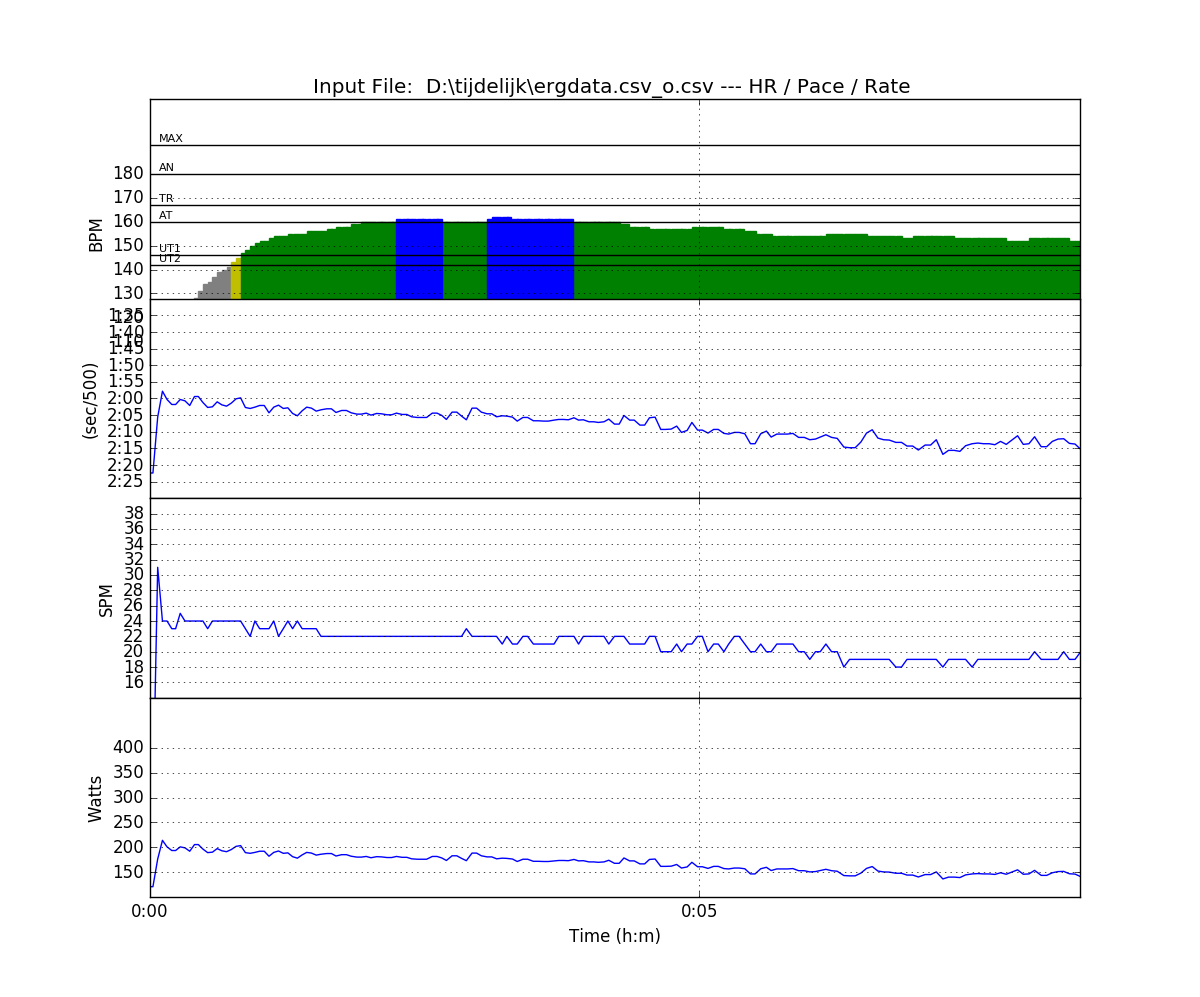
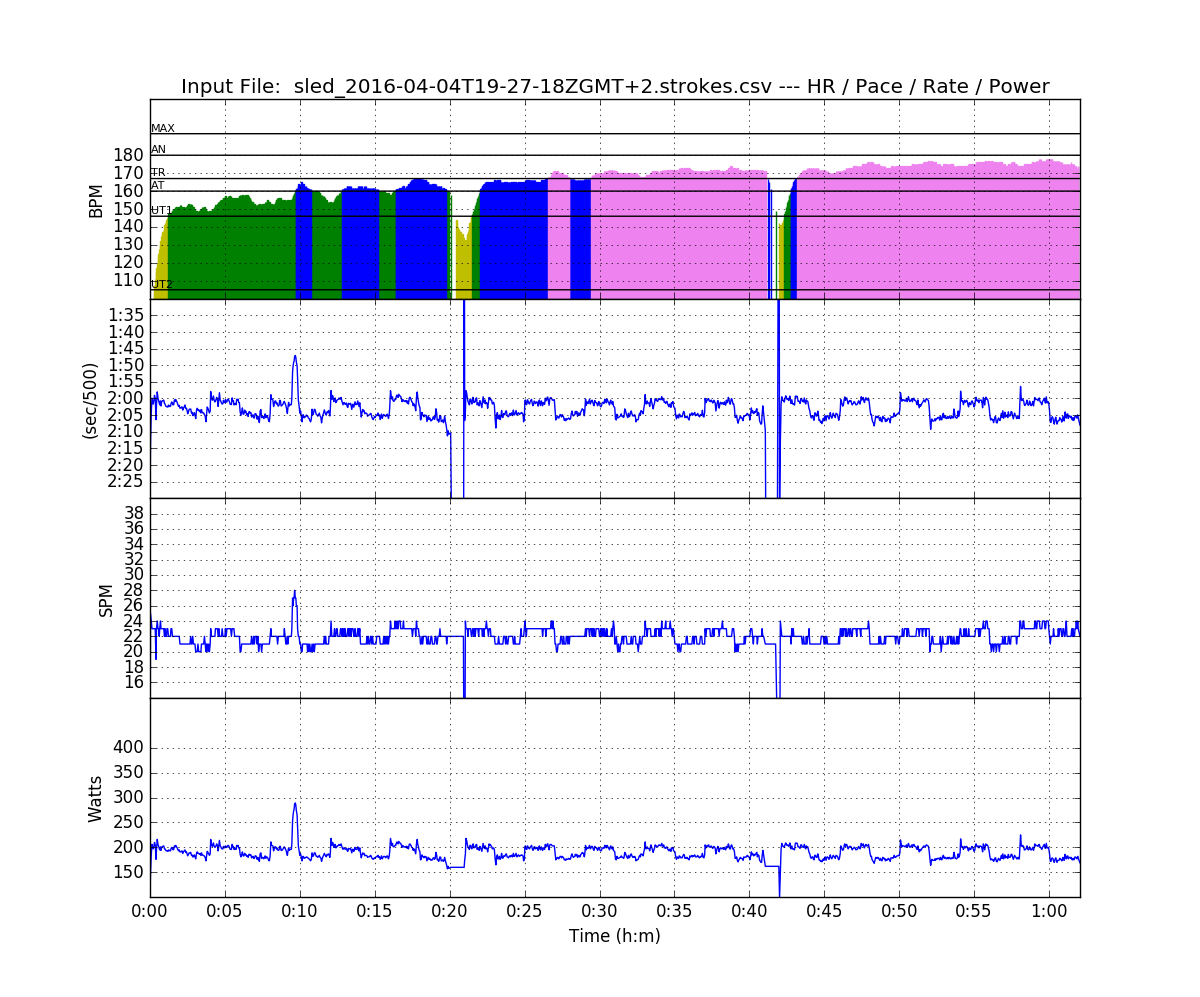
It took me 15 minutes to add a ErgData parser to my tool. Had to calculate the Power in Watts by hand. It’s a pity that they don’t include Drive Length, Drive Speed, Drag Factor, Peak Force and Average Force in the CSV download.
Now, the only problem is that I will have to manually put the ErgData row in SportTracks. I don’t want to write a CSV to TCX converter. This, to me, is the downside of ErgData. Lack of export to SportTracks, Garmin Connect, Strava, and other fitness sites … I understand that Concept2 may want to build out their own logbook. I want my data to be free, however, and I want to see my rows (OTW and OTE) next to my runs and bike rides.

Apr 7 2016
Taper Race Day minus Two
The workout
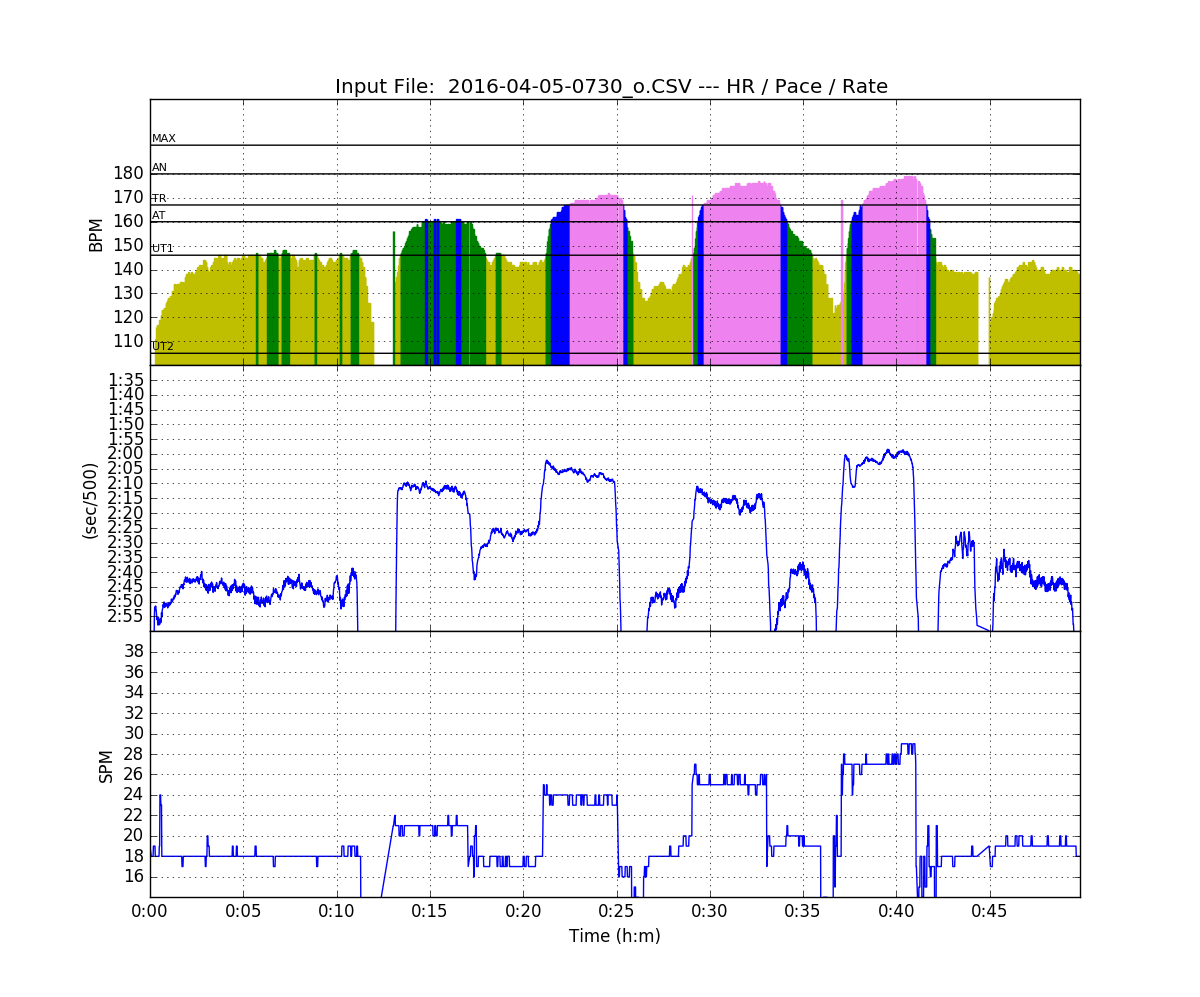
My plan for today was to do a 50 minute row, and have one “lake” of 30 sec / 60 sec rest at race pace.
Arrived at the club. Had a nice chat with the head coach. He saw the Holland Acht (Dutch 8+) training in Gavirate, and expects them to be very good at the Olympics. Nice. I casually asked him what his guys were doing today. “One lake at 22spm, then one lake 30″/60″ rest”, he answered.
Typical.
So it must be a good training to do two days before the race.
Workout Summary - C:Downloads2016-04-07-1545.CSV

--|Total|-Total-|--Avg--|Avg-|-Avg-|-Max-|-Avg

--|Dist-|-Time--|-Pace--|SPM-|-HR--|-HR--|-DPS

--|04020|18:08.0|02:13.9|28.7|162.9|173.4|09.2

Workout Details

#-|SDist|-Split-|-SPace-|SPM-|AvgHR|MaxHR|DPS-

01|03008| 13:38 |02:16.1|22.5|160.0|171.0|09.8 | 3km

02|00124| 00:30 |02:00.7|28.0|150.0|165.0|08.9

03|00000| 00:30 |0000:00|30.0|165.0|173.0|00.0 | GPS failure

04|00125| 00:30 |02:00.1|30.0|156.0|171.0|08.3

05|00124| 00:30 |02:01.3|28.0|163.0|174.0|08.9

06|00125| 00:30 |02:00.2|28.0|166.0|175.0|08.9

07|00127| 00:30 |01:58.3|28.1|166.0|174.0|09.1

08|00128| 00:30 |01:57.5|30.0|166.0|175.0|08.5

09|00128| 00:30 |01:57.3|30.0|165.0|176.0|08.5

10|00131| 00:30 |01:54.9|32.0|172.0|180.0|08.2
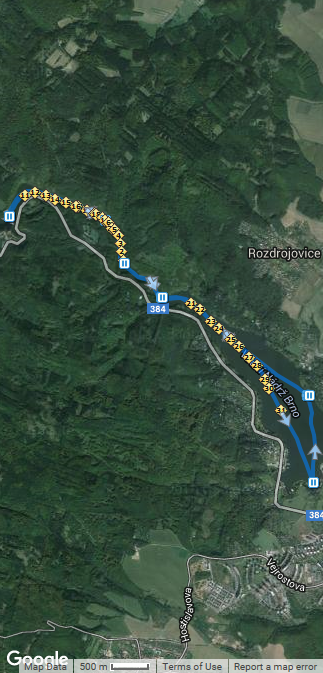
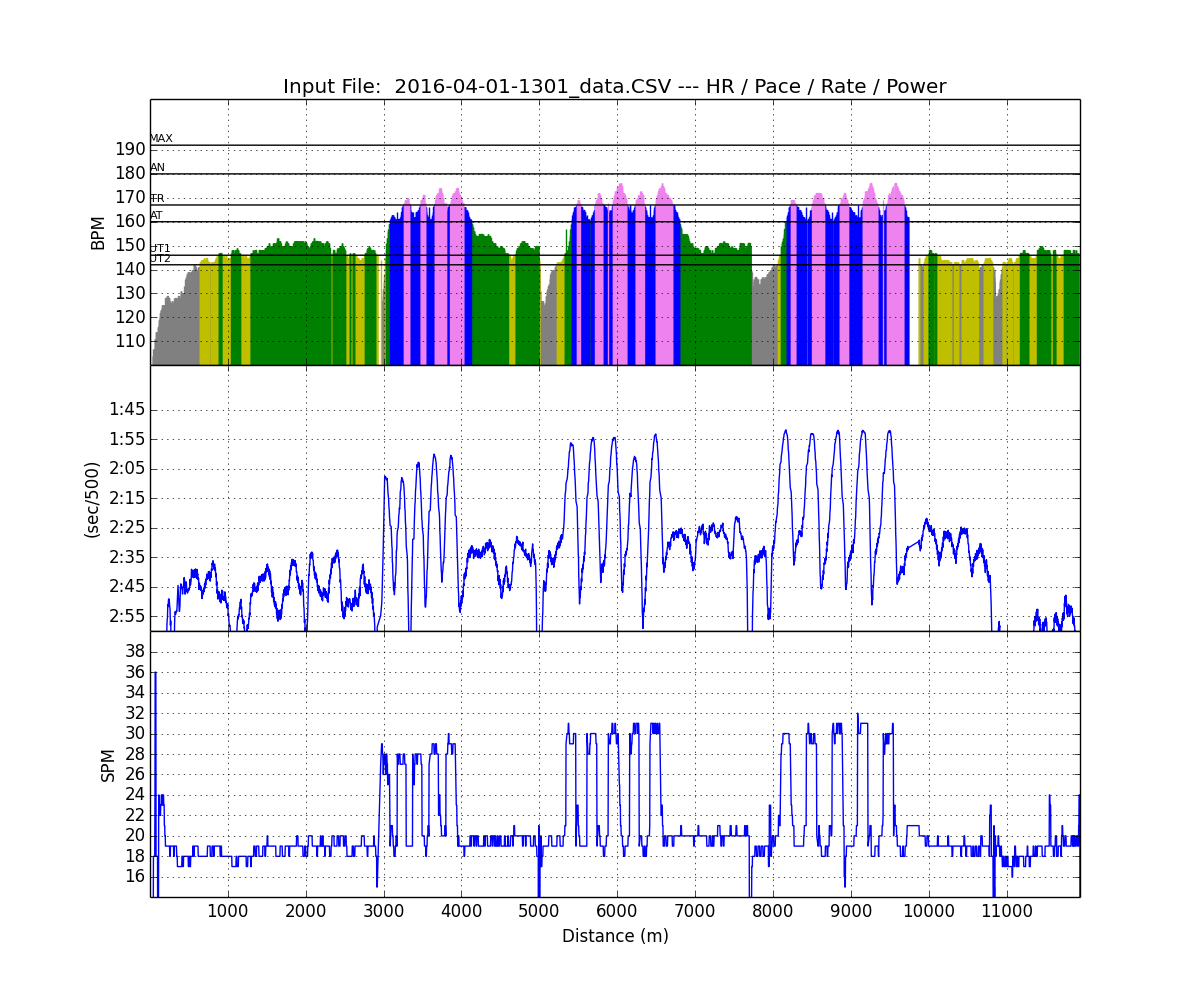
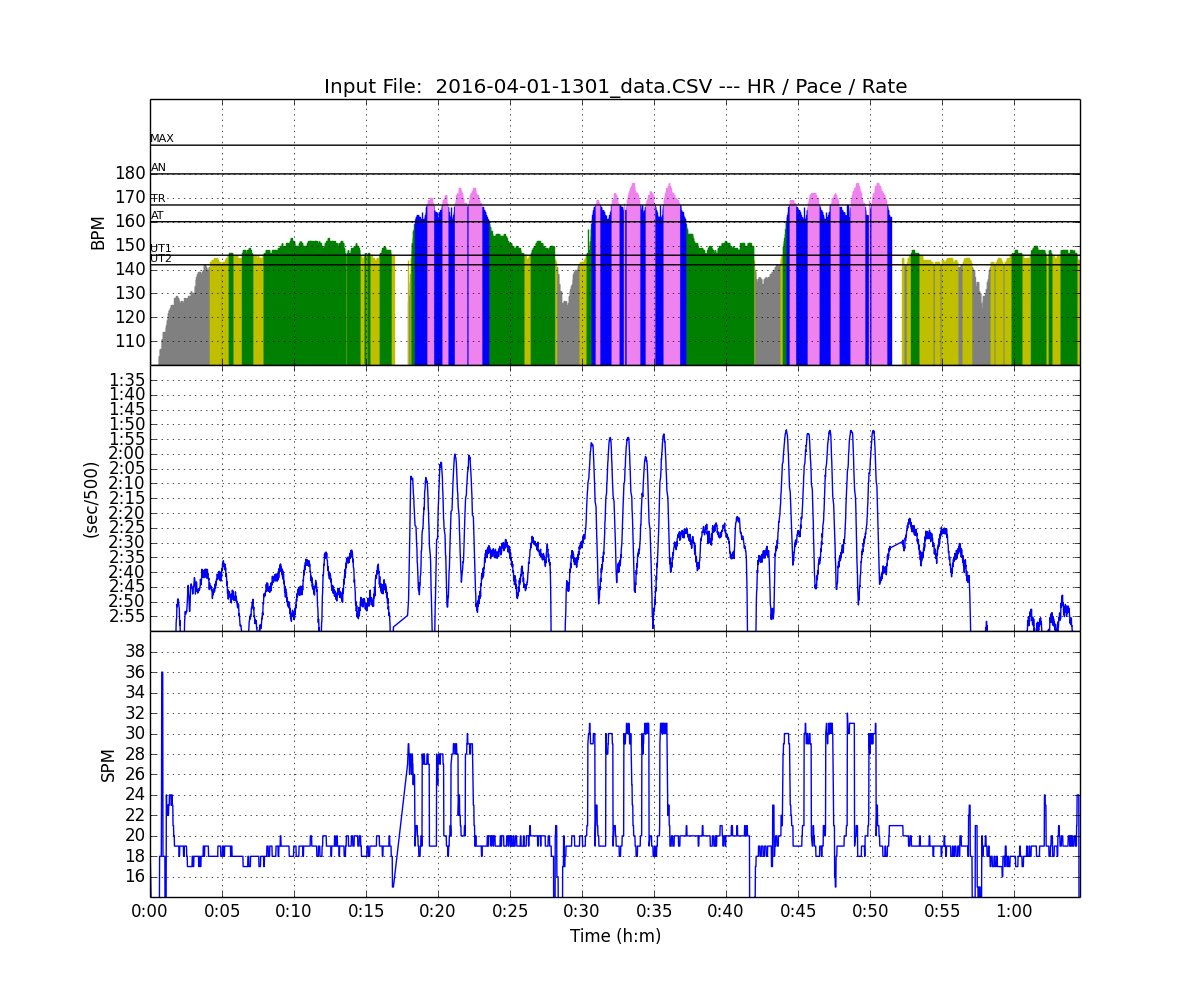
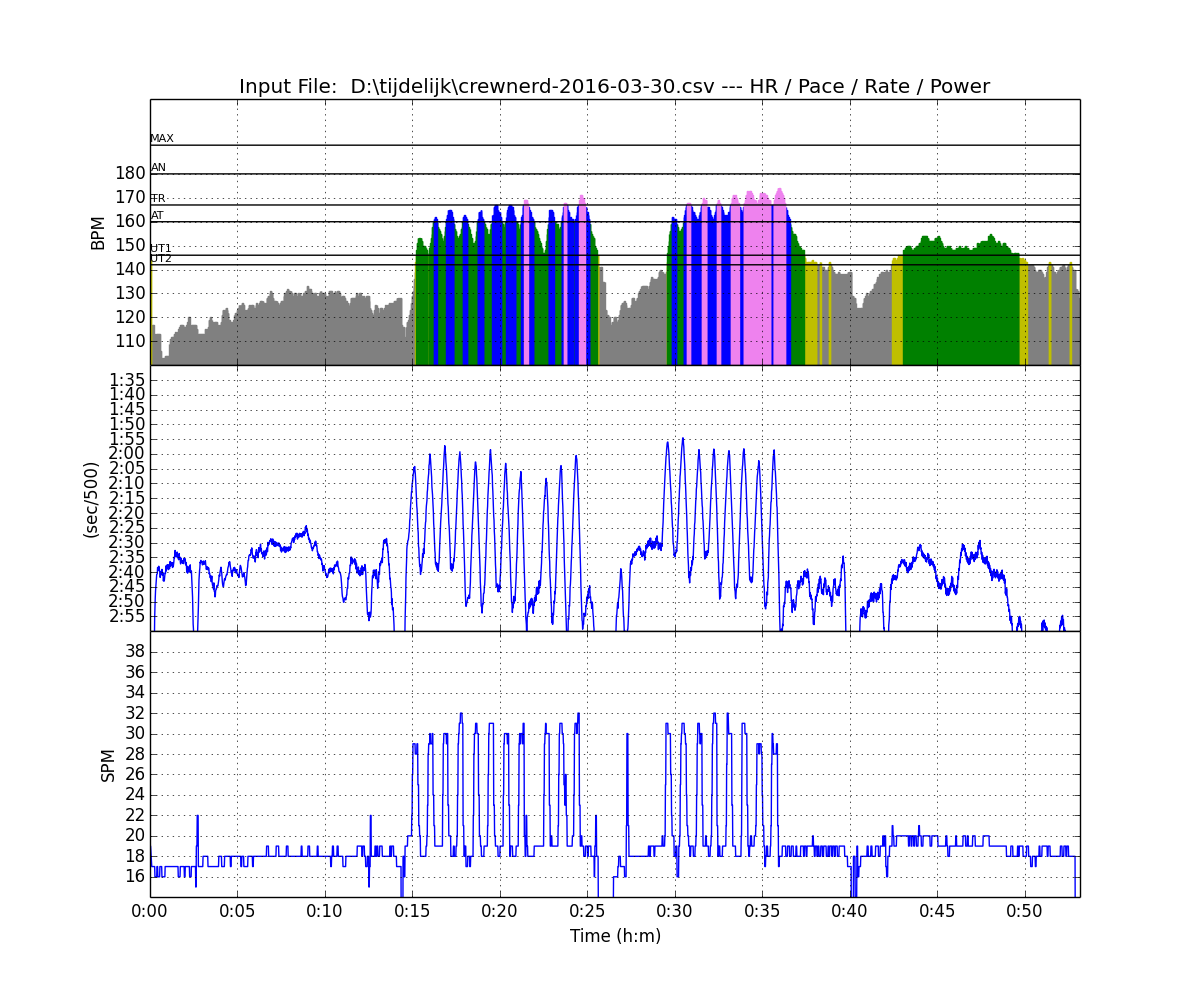
The lake was super flat. One would think there was no wind. I thought so. I thought so during the warming up, and during the first 3km stretch at 22spm. I was really excited to see my average split drop below 2:20 for that part. (By the way, I rowed this as a CrewNerd set course, with start and finish lines that you can define in Google Earth and then upload to CrewNerd. Nice feature.)
But when I turned, I quickly realized that there had been a very light breeze pushing me.
On to the 30 second intervals. My GPS device stopped during the second interval and I had to reset it. That causes the peaks in the graph and the absence of data in interval #3.
Otherwise, it was nice. I know what to focus on to row my best head race stroke, so I tried to focus on that, and I think it works. Keywords: Length. Reach. The Distance-per-Stroke (DPS) parameter is what I monitor.
Programming fun
Just for fun, I wrote to Concept2 for the API to the Concept2 logbook. I got an answer today with a link to a description and a form to fill out and get an API key. So, in principle it is possible to change my Python code so it uploads much more row data to the Concept2 logbook, including splits, so the logbook can create the nice graphs that you get with ErgData.
I am very unexperienced with HTTPS requests (in any programming language), so I am probably not going to do this.
What it tells me is that C2 logbook integration is doable. Painsled, CrewNerd, NK, others: You can do it! I would love to see this integration, as well as direct upload to Garmin, Strava, SportTracks, and of course CSV and TCX downloads. That would be very cool.
By sanderroosendaal • Uncategorized • 0 • Tags: head race, lake, OTW, rowing, single, taper, training