Sep 25 2016
Saturday – 2 speed Lactate test and some thinking
Time for the 2 speed lactate test again. The protocol is simple.
- Do a thorough warming up
- Row a 1k “at 6k pace”
- Take 15 minutes active rest, measuring lactate at 1 and 3 minutes
- Row a full out 1k
- Row a cooling down, measuring lactate at 1, 3, 5 and 10 minutes.
Then you plot the 1 minute values against power.
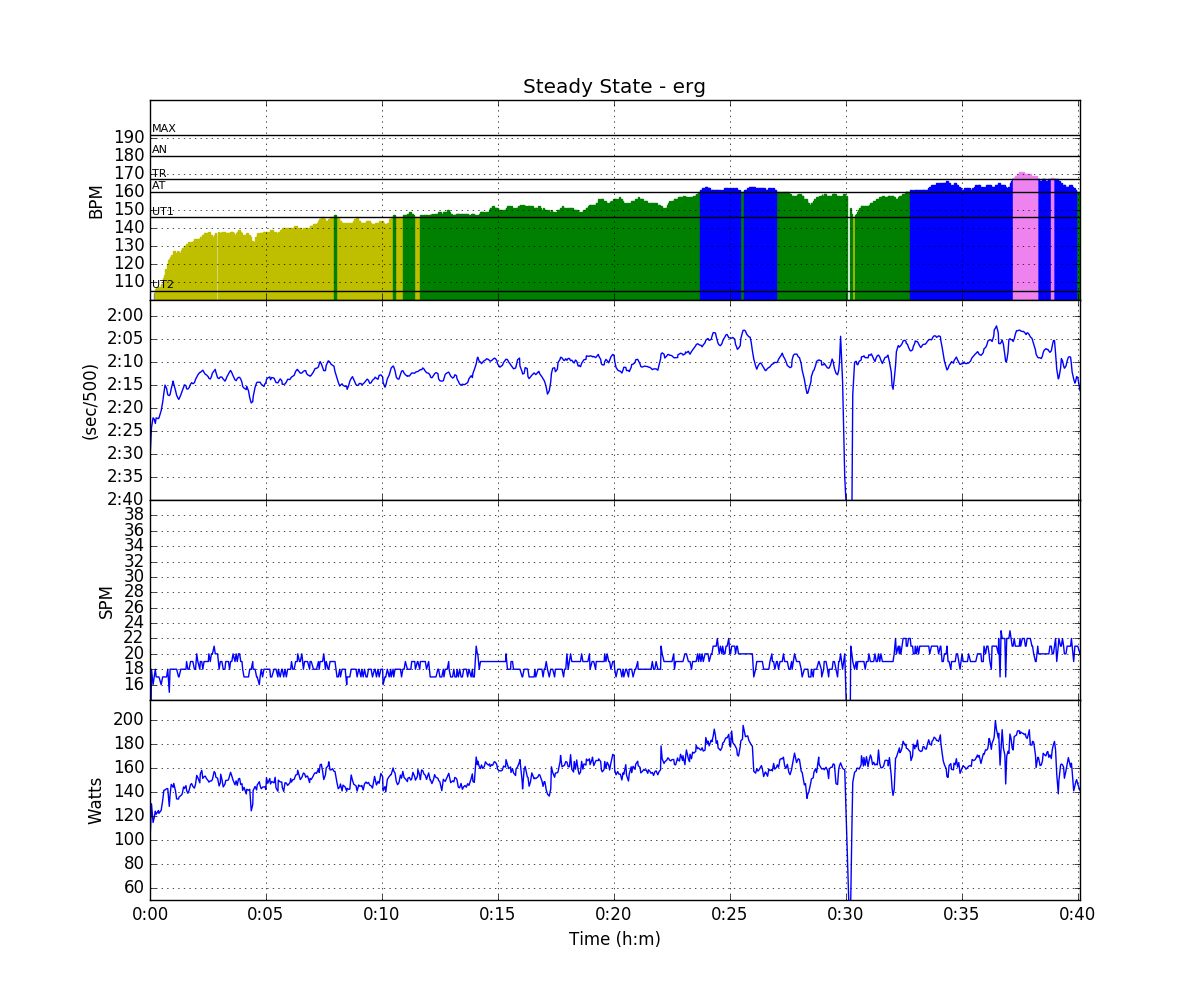
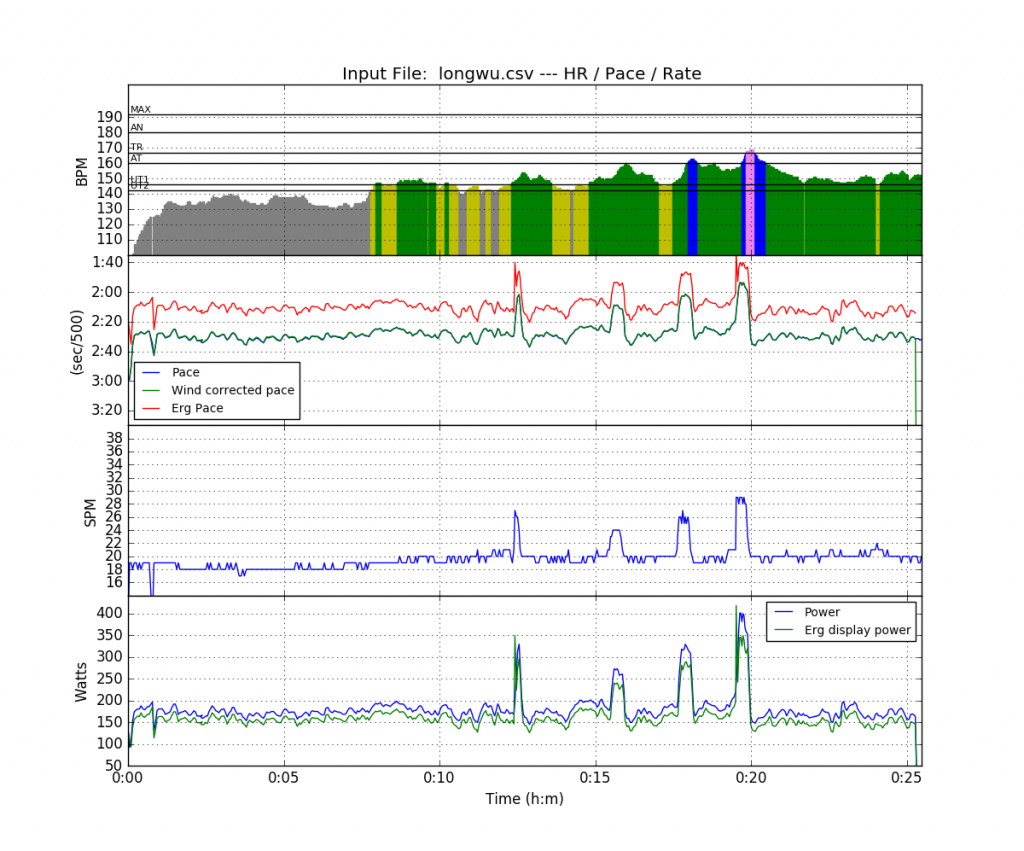
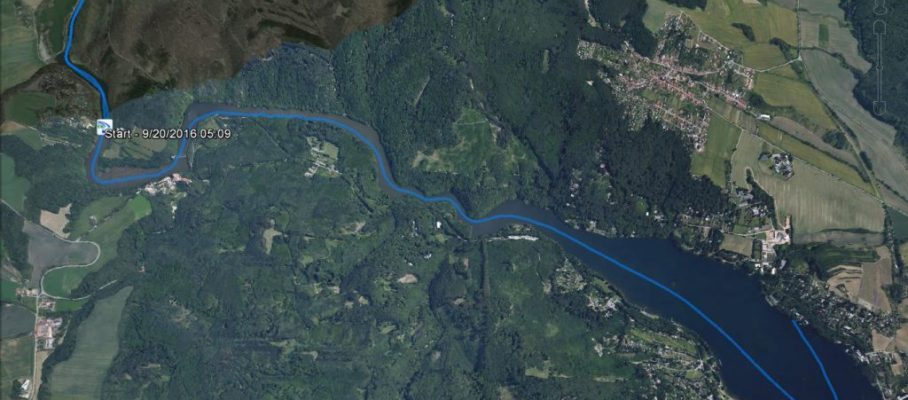
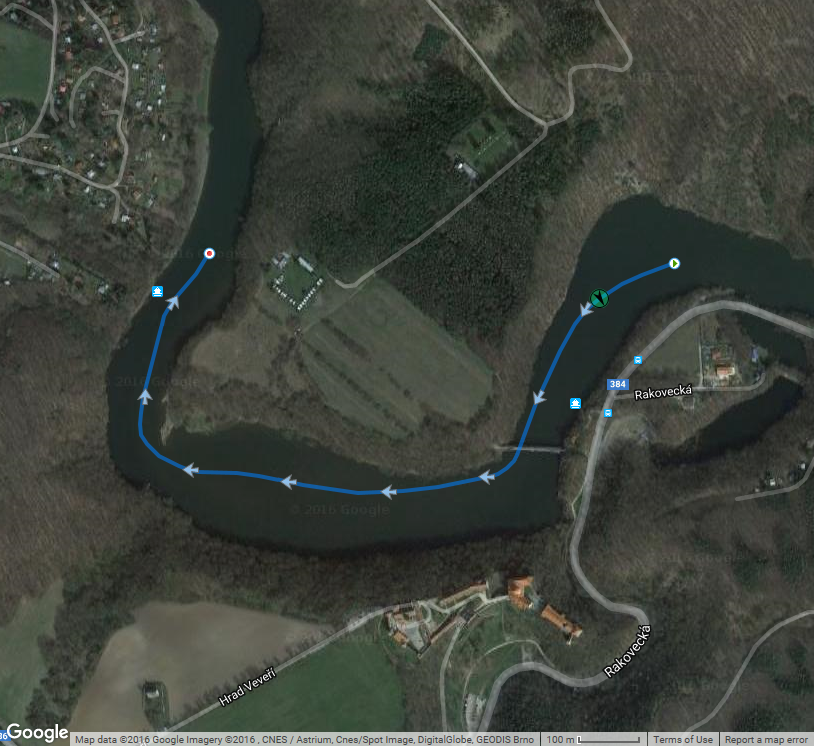
I started with a 20 minute warming up:

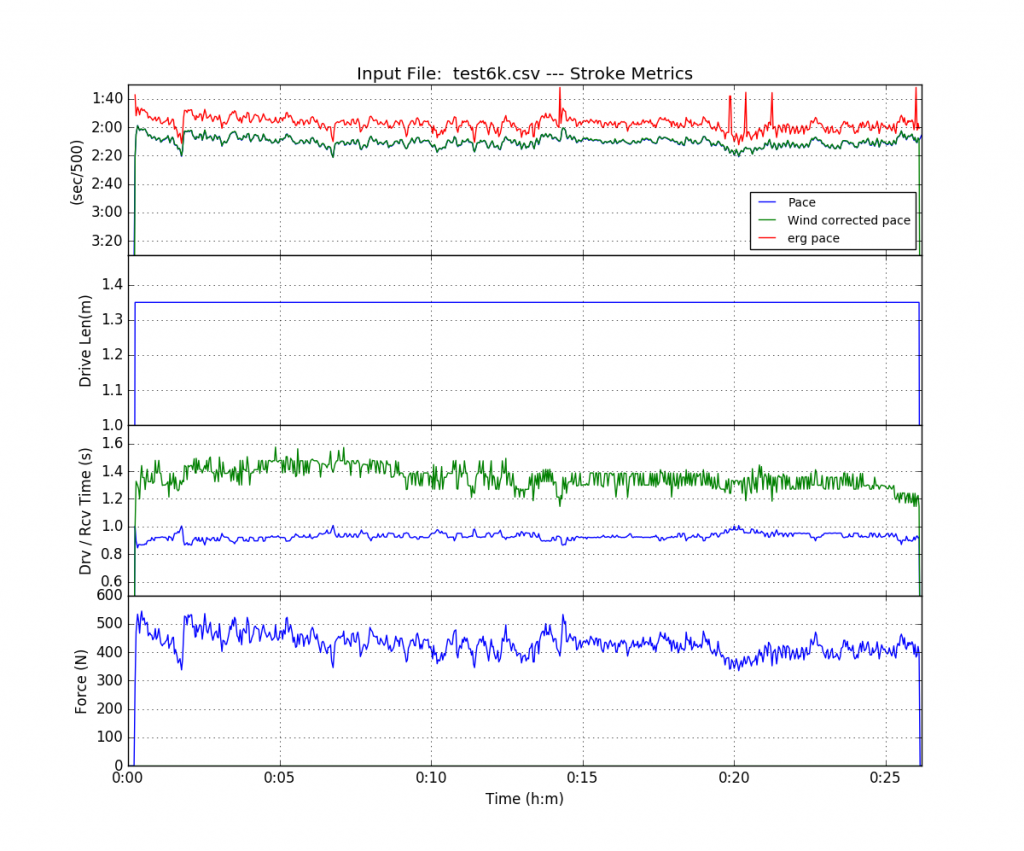
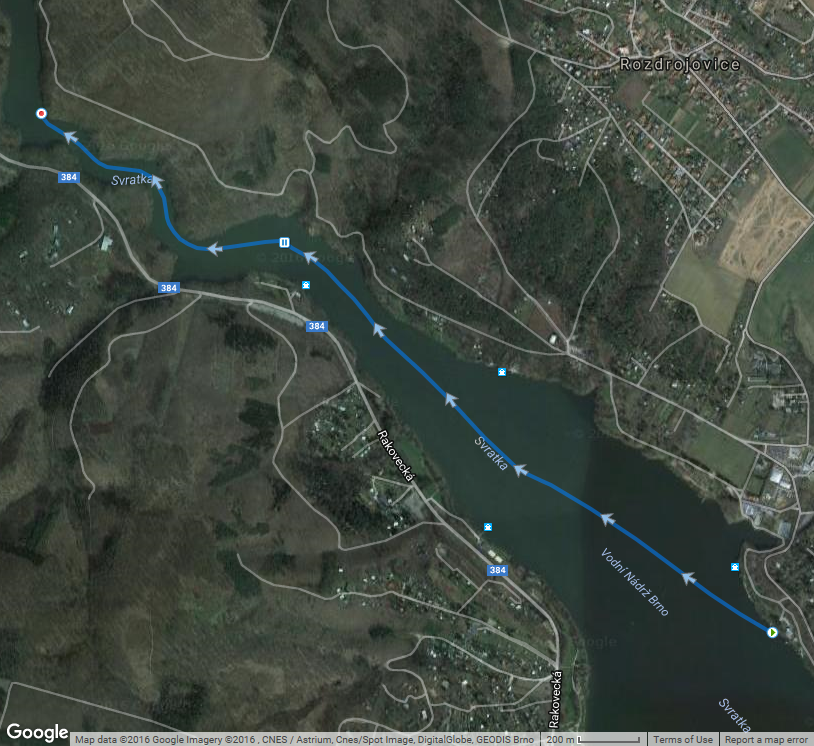
Then I did the first 1k:

Pretty evenly paced. I measured 5.4 mmol/L of lactate after 1 minute and 4.5 mmol/L after 3 minutes. I paddled until 15 minutes was gone, at roughly 150-160W pace.
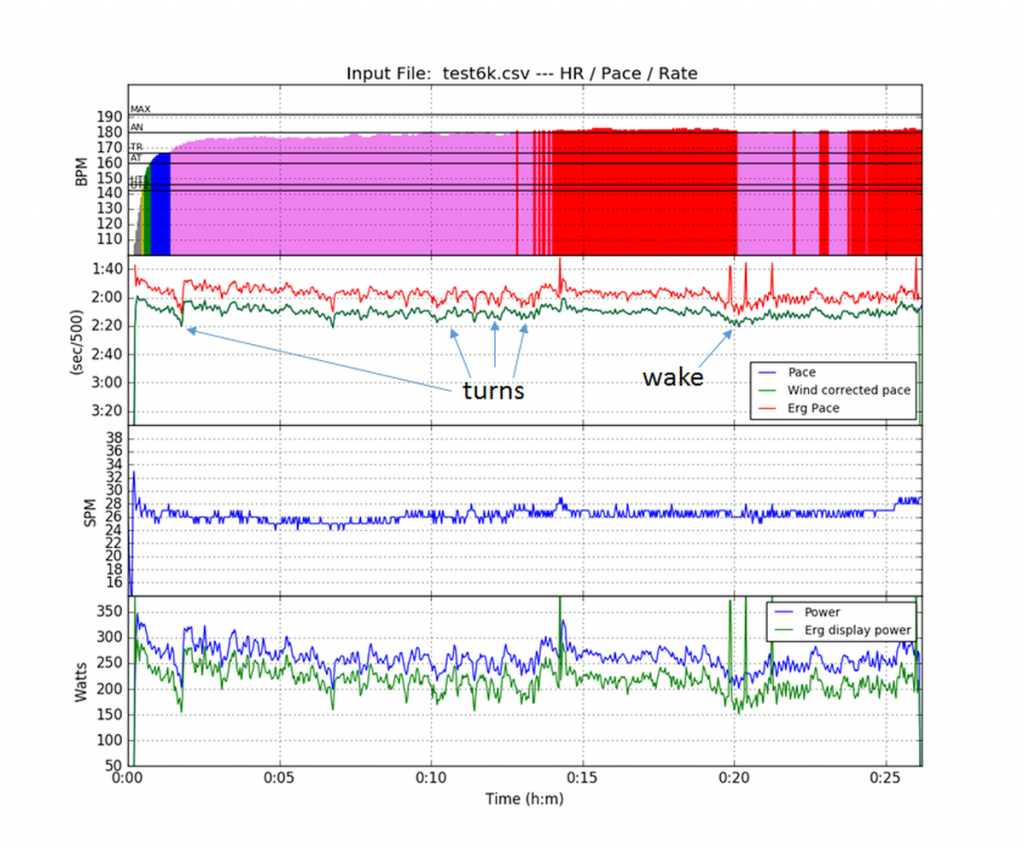
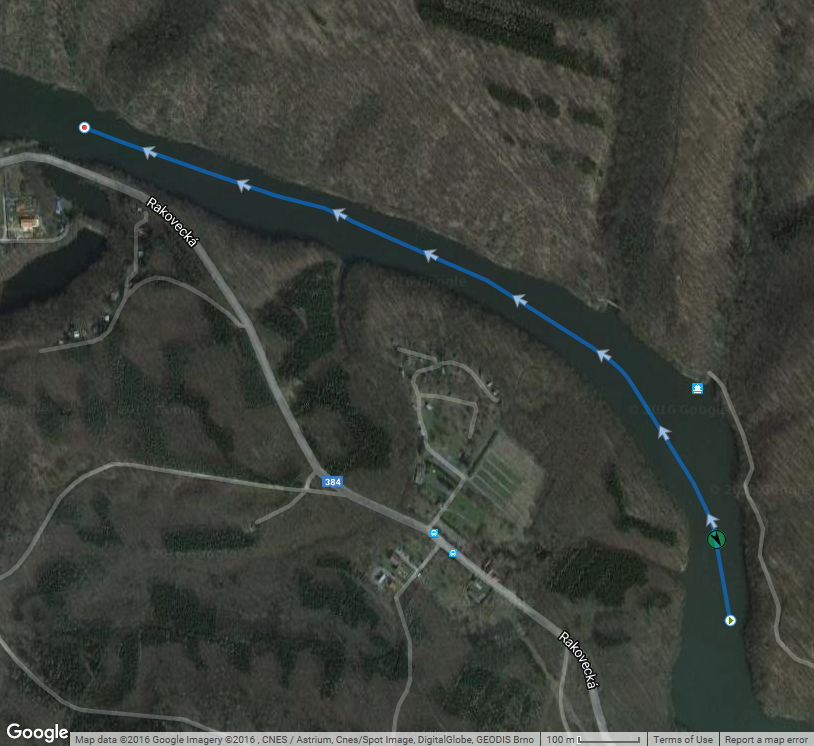
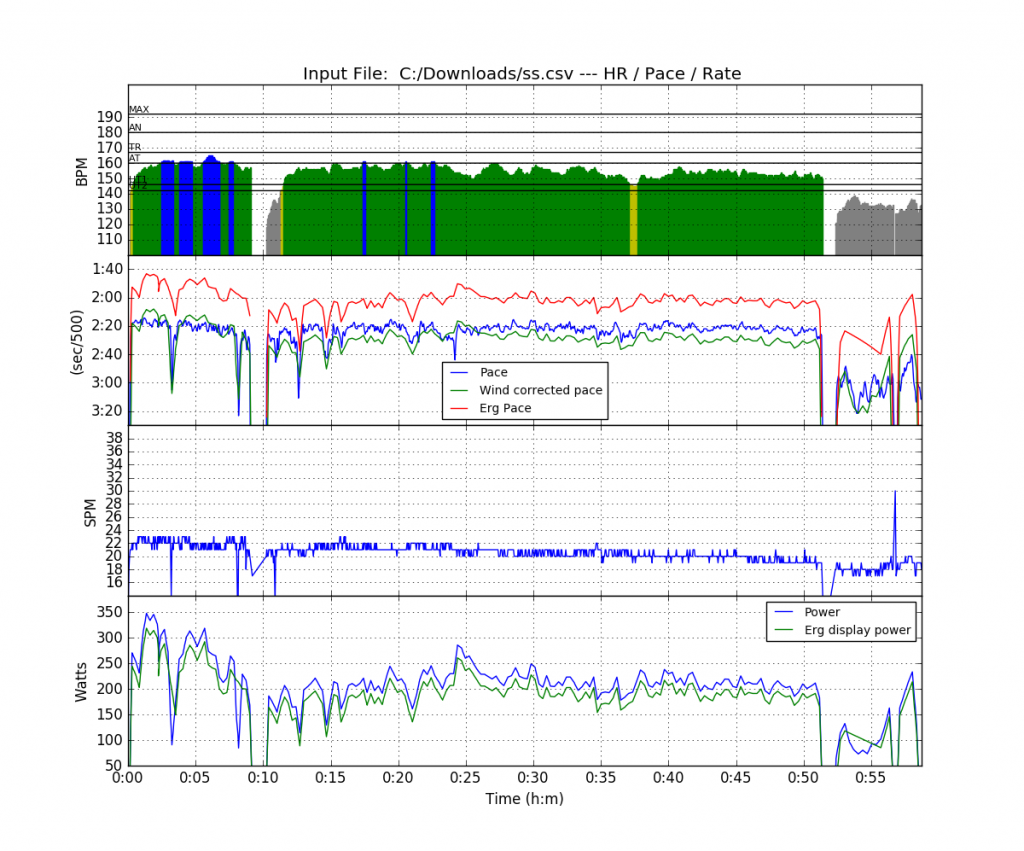
Then I did the second 1k:

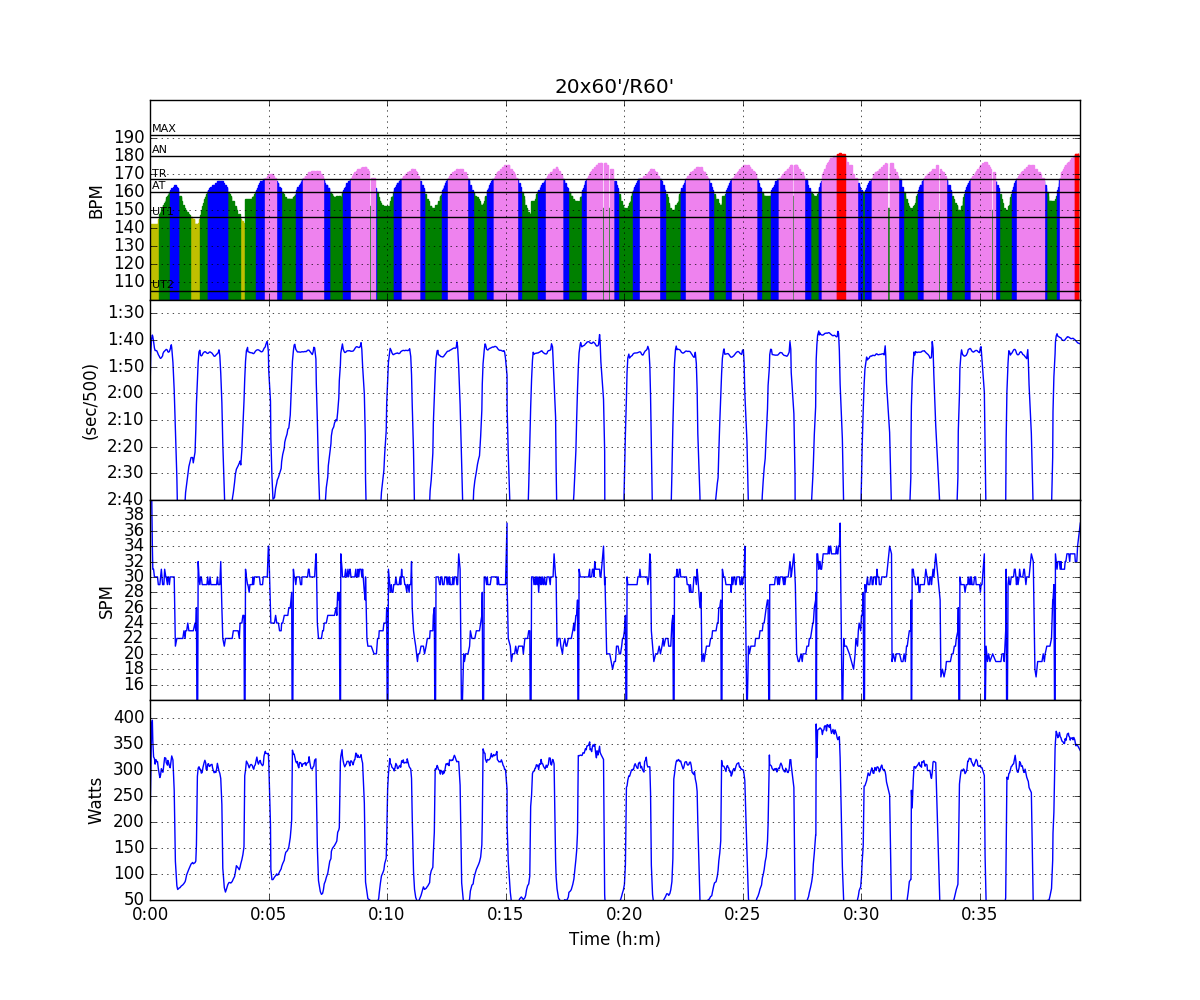
I knew this wasn’t going to be a very fast 1k, so after 10 hard strokes at the start, I settled for 300W, then tried to crank it up with 500m to go.
So here is the result (lactate in mmol/L).
| Measurement | Lactate | Power |
| 1 min | 5.4 | 270 |
| 3 min | 4.5 | |
| 1 min | 6.1 | 315 |
| 3 min | 8.1 | |
| 5 min | 7.2 | |
| 10 min | 4.3 |
The droplet of blood after 1 minute after the full out 1k was a little smaller than normal. I think the measurement was OK. It seems the lactate concentration in the muscle was just much higher and it took time to flush out the lactate. This would explain the higher value after 3 minutes.
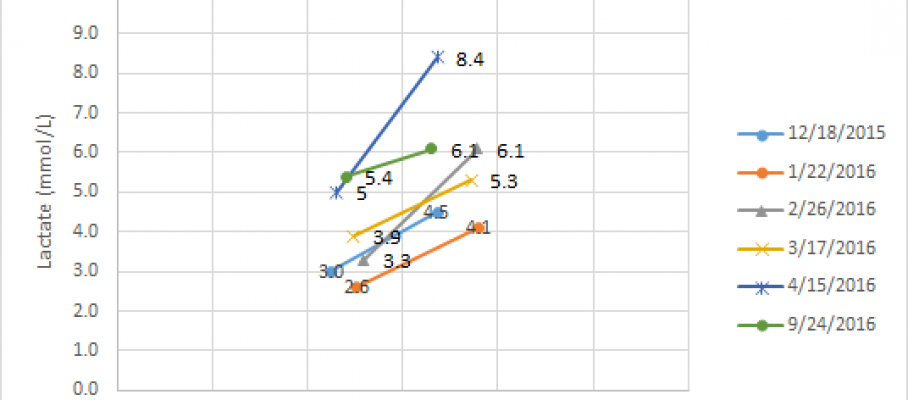
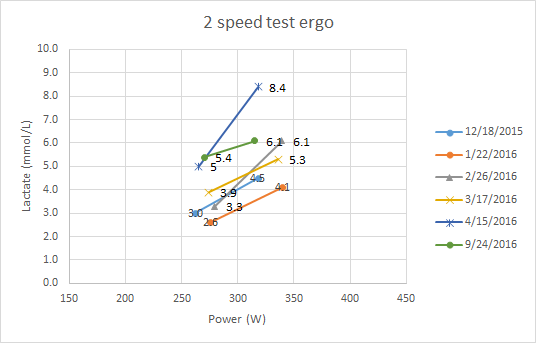
Here is the graph of all 2 speed tests I had done in the past 12 months:
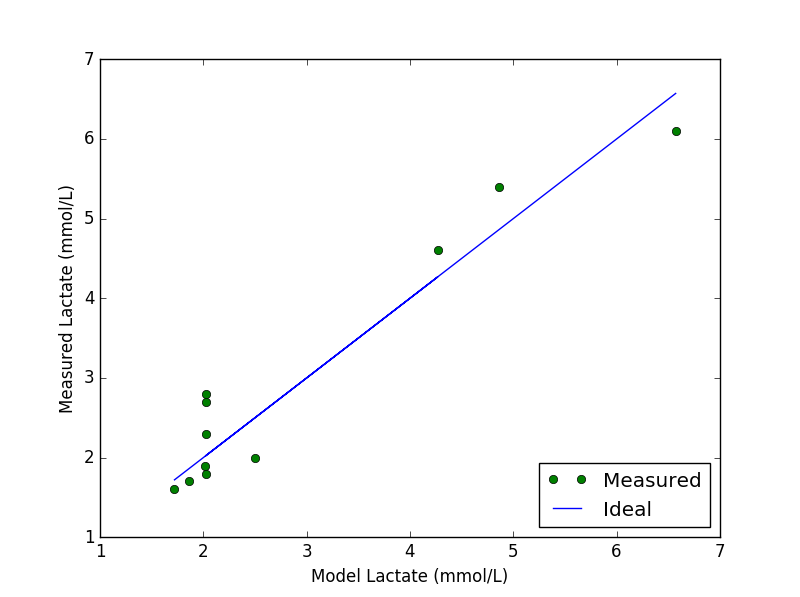
The chart looks like a game of Mikado (or pick-up sticks) and it is hard to understand what is going on. I have been rereading on Lactate, especially this article. I picked up my old simple numerical model and tried to model the recent three series of lactate step tests I did in September.
Not an ideal fit but it is interesting to look at the parameters.
| Nov ’15 | Sep ’16 | ||
| Pthreshold | 200 | 195 | W |
| beta | 0.1 | 0.15 | |
| C_La rest | 0.7 | 1.5 | mmol/L |
| V_La_max | 0.1 | 0.2 | mmol/L/s |
Pthreshold is the threshold Power. The parameter “beta” is a parameter which governs lactate usage as fuel in the aerobic pathway (higher values mean more lactate can be used as fuel during aerobic exercise). “C_La_rest” is the rest value of lactate (which I measured today), and “V_La_max” is a parameter which governs how fast lactate is produced once you are above the threshold. So the hypothesis is that my threshold power has shifted to the left (bad), but I am better at burning lactate during aerobic exercise. At the same time, I have become better at producing a lot of lactate when above the threshold.
The model should be taken with a very big grain of salt. It’s all very crude and simplified at the moment. Take it as an illustration of my current understanding of lactate “science”. Instead of looking at individual test results, you have to build a model of how blood lactate is generated and used. In “Olbrecht” language, my Aerobic Capacity has slightly decreased, but my Anaerobic Capacity has improved a lot.
Now, if I knew what that means in terms of race performance, and how to use the result to fine tune my training plan … that would be great.





Sep 25 2016
Sunday – a nice run (low heart rate!)
Another beautiful sunny autumn day. Maximum temperature around 25 degrees C, no wind. The plan asked for a “recovery cross training” and I knew that today it was going to be my “regular” 12k run from home. I say “regular” because Strava tells me I do this run just a few times per year. Still I consider it as one of my benchmark runs.
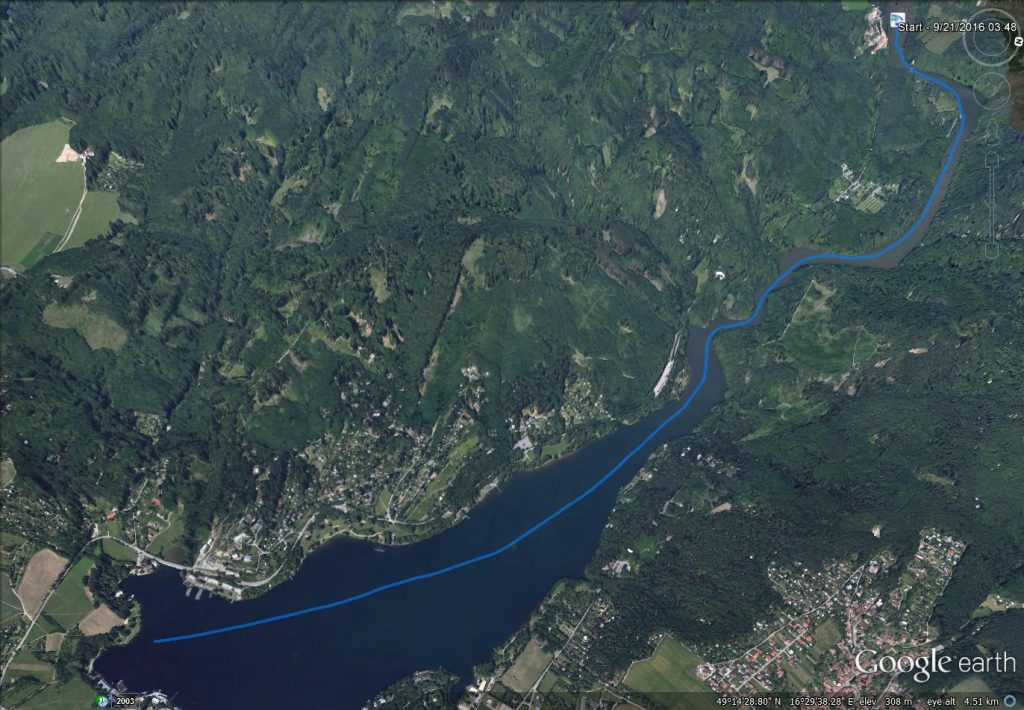
The run starts at home, then goes slightly downhill to the next village, Mokra Hora. There, I leave the hard surface behind and enter the forest. I run along a small stream and continuously climbing with a grade between 0 and 5%, and a few shorter, steeper segments. At “Rakovec” (that is the place I pass twice on this run), a long climb starts. Until this point, I was monitoring my heart rate and let it stay in the 140-150 bpm range. At the climb from Rakovec, I was passed by a group of 5 mountain bikers. The climb has a few steeper segments (up to 15% grade) I started to pass the slower bikers of the group. At the top, I had passed three of the five riders. At the cost of a slightly harder effort and a heart rate in the 160-170 range. But my pride was saved.
Then it’s a quite fast downhill segment, to the village of Oresin, then through Jehnice, and straight on towards the railroad track, which I follow (almost flat) until I hit Brno again.
Twelve kilometers. Average pace 5:30. Average heart rate 141 beats per minute. I did the same run a year ago. It was 10 degrees colder then and my average heart rate was 10 beats higher. Then, the run was classified as “black hole”. Today it was a nice “LIT” (low intensity training).
During the run everything felt effortless. Now, I feel the muscles need a stretch and I will probably have some DOMS tomorrow.
I have been reading this reddit discussion with surprise. Apparently, there are triathletes (age groupers) who spend between 100 and 200 USD on a coach who makes their training plan and is available for discussions on progress. I wonder how much of that value I get from writing my blogs and doing training plans myself. I wonder how much of the value I miss because I do stupid things because I don’t have a coach. It’s interesting to think about this. It seems quite a lot to me. I could also say that a few months of rowing without a paid coach will save me enough money to spend on a power measuring oarlock! 🙂
By sanderroosendaal • Uncategorized • 0 • Tags: rowing, running, trail, training