Jun 11 2015
Textbook graphs
Today I received the results of my VO2 max test on the bicycle. As every year, this slightly old-fashioned Institute for Sports Medicine just gave me a printout printed on a line printer. I am surprised they are still able to purchase the paper for their printer. (Or perhaps they bought sufficient paper for a few decennia at the end of the communist era.) So I spent some time happily typing the values into my spreadsheet.
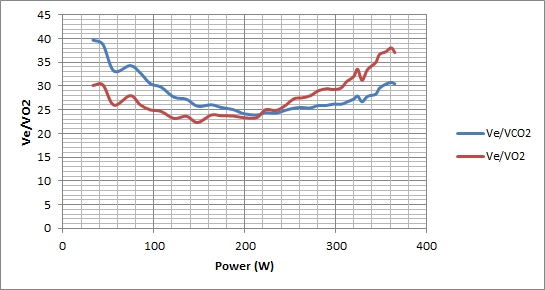
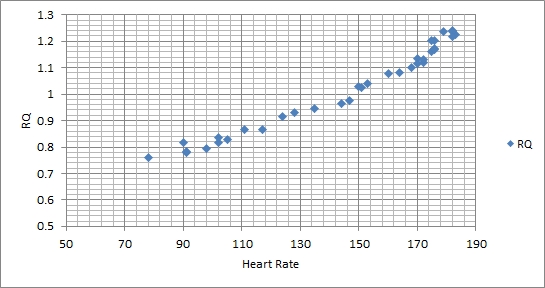
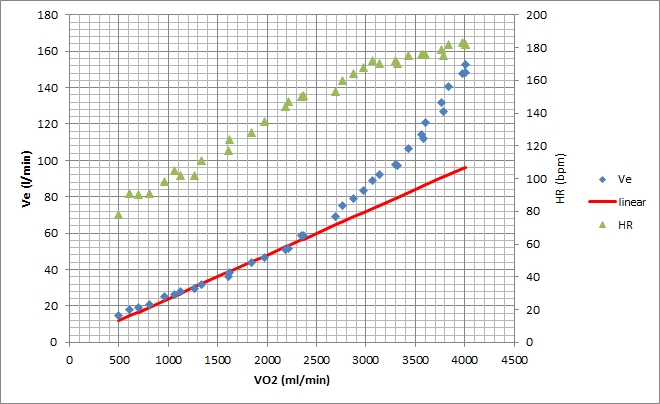
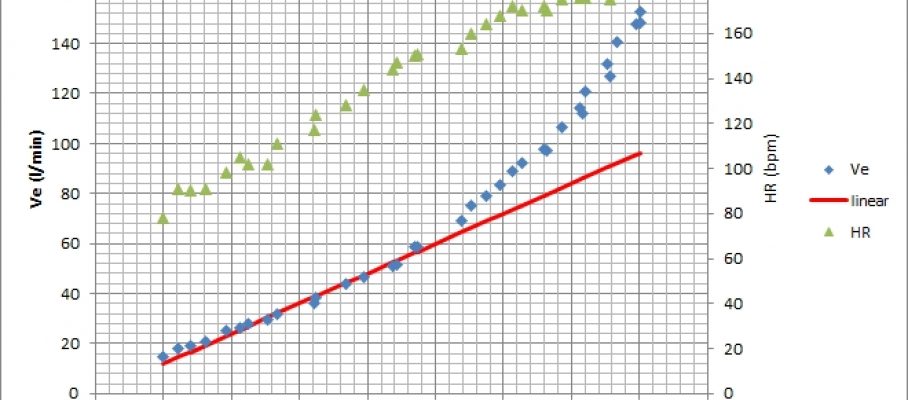
In contrast to a year ago, the graphs have textbook quality.


So my VO2 max is identical to last year at 56 ml/min/kg. However, I achieved a slightly higher Power at 365W (5.07 W/kg) vs 350W a year ago. The ventilatory threshold seems to be around 150 bpm at 234W. A year ago this looked more like 160bpm at 215W. My max HR during the test was 183bpm, vs 182bpm a year ago. I have seen higher values in races and trainings.
So what’s the conclusion? I guess I optimistically interpret this as a slight improvement. Still, race performance will depend more on being rested and motivated, and on technique, than on my “raw power”.
Not sure how the cycling power correspond to erg power.

Nov 9 2015
From Trabant to Ferrari – testing
Lack of time for a serious erg session today, but I did have time doing a simple test. As described here, the “Rowing Faster” book has a simple test that intrigued me. It seems like a good way to quickly get a fingerprint of your fitness.
The irony is of course that the time saved by doing this test instead of a training session, is lost in obsession over the analysis.
I quote Greg:
I did a few things different:
In this way I would get a score in for the CTC, which is always a struggle for me, especially for challenges that do not resemble sound training …
Here is my graph, which unfortunately looks slightly different than the example graph from the book:
Looking at the shape, one may suspect that I should try a stronger fly-and-die approach in this test. I swear I tried to do that. In the first 10 strokes I frantically tried to bring back up the power to those “peak” values, without success. After 60 seconds, I reduced to a “leisurely” 28spm and continued for another 35 seconds to finish the 500m.
So Peak power 611W, average power 469W. 10% drop-off reached after 1 stroke (sic) and 35% drop-off reached after 56 seconds. For a 42 year old LW man, the targets are between 625W and 770W for max power and 490W to 690W for the average power. So I am a few percent under the low end of the range … Clearly in the Trabant category:
Well, it turns out these East German cars cannot be turned into something fast, but with good care and a lot of energy, they can be tough:
Here is the entire score for the CTC:
Workout Summary - Nov 09, 2015

--|Total|--Avg--|-Avg-|Avg-|-Avg-|-Max-|-Avg|-Avg

--|Dist-|-Pace--|Watts|SPM-|-HR--|-HR--|-DPS|-SPI

--|02250|01:43.8|312.9|31.0|160.9|175.0|09.3|10.1

Workout Details

#-|SDist|-SPace-|Watts|SPM-|AvgHR|MaxHR|DPS-|-SPI|Comments

01|00250|01:47.7|280.4|27.9|131.4|152.0|10.0|10.1|

02|00500|01:35.9|397.2|33.8|167.0|175.0|09.3|11.8|

03|00750|01:47.7|280.1|29.3|166.1|173.0|09.5|09.5|

04|00500|01:45.8|295.6|30.6|161.9|172.0|09.3|09.7|

05|00250|01:40.2|348.1|34.7|159.6|172.0|08.6|10.0|
By sanderroosendaal • Uncategorized • 4 • Tags: anaerobic, OTE, rowing, test, testing