Apr 21 2015
Steady State: Are my easy days too hard?
Yes! They are hard. Because working on technique is hard. But I don’t think they are too hard.
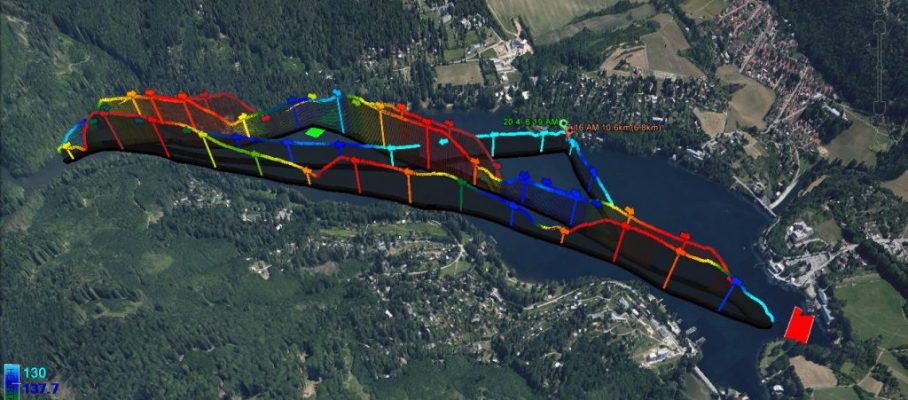
Another morning row because of the wind forecasts. It is actually quite beautiful to be out in the morning:

Sunrise and all:

The problem is that when I drive to work from the lake at 7:45 I hit the main traffic jams which I so elegantly avoid with my usual route and departure time. That’s really frustrating. You know there is work waiting for you, but you can’t do anything else than wait in traffic.
I did a 10km row but the graph below shows only the last 8km. I was using the Rowing in Motion (RIM) app and I have trouble with the calibration. I push off the dock, put my feet in the shoes, and start up the app, then wait a few seconds, then start rowing. When I see “catch efficiency” around 0.5 and lower, I know the calibration is off. I need to be above 1.5, ideally 2 and higher.
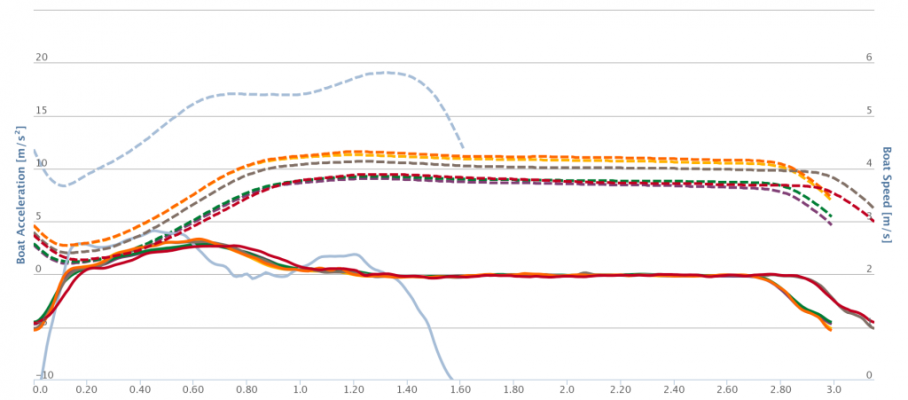
I also have the feeling this is limiting the comparison between rows. For example here is a picture with three strokes,

The yellow stroke is from today with tailwind, while the purple one is from November. Stroke efficiency was 2.2 today at 18spm, which was pretty much the maximum I saw during the row, but in November I seemed to be able to hit 2.96. Or was it a different calibration? A slight offset in the acceleration may have been the problem.
Perhaps the boat should not be moving when you switch on the app, as I guess it can measure acceleration but not velocity for the calibration?
Nevertheless, I feel the “stroke efficiency” is a good metric to monitor during one row. I saw it going up when I was focusing on my flaws:
- Blades not too deep at the catch, gentle leg push, not biting off more of the stroke than I can swallow
- Strong middle and second half of stroke by “shoulder swing”
- Clean, distinct, hard tap-down
I need to exaggerate to get (2) and (3) right. I am sure an observer on the bank wouldn’t see what I call “shoulder swing” but it feels pretty dramatic. Also, the tap-down probably is just rather sloppy when I don’t pay attention.
So today I was just alternating 18, 20 and 22spm in roughly two minute intervals, trying work on those three points mentioned above while keeping an eye on the RIM metrics every 5th stroke. This is hard work but when it works I am rewarded with splits that are 1 or 2 seconds faster, and the check factor numbers moved to values greater than 2. Sloppy rowing is between 1 and 1.5. I am guessing on the split numbers, because it is hard to judge what is due to good rowing and what is due to changing wind conditions.
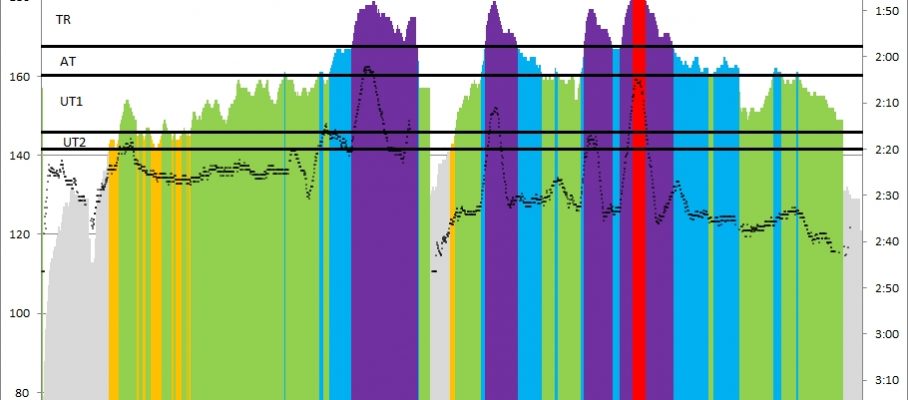
Anyway, here are the pretty graphs. Slightly more noisy pace values as I didn’t use the XGPS160. It’s not compatible with RIM yet:


Apr 6 2016
Playing with the PM5 and data tools
No time for an OTW row today. The taper plan called for a quiet 40 minutes row. I decided to play a bit with the PM5 and the different tools. Here’s what I did:
It all worked like a charm.
Warming Up (RowPro):
Workout Summary - D:tijdelijk2km_rowpro.csv_o.csv

--|Total|-Total-|--Avg--|Avg-|-Avg-|-Max-|-Avg

--|Dist-|-Time--|-Pace--|SPM-|-HR--|-HR--|-DPS

--|01998|08:35.0|02:09.0|21.9|140.3|156.0|10.6
Main Row (Painsled):
Workout Summary - sled_2016-04-06T07-44-35ZGMT+2.strokes.csv

--|Total|-Total-|--Avg--|Avg-|-Avg-|-Max-|-Avg

--|Dist-|-Time--|-Pace--|SPM-|-HR--|-HR--|-DPS

--|06000|25:06.0|02:05.6|22.7|155.5|168.0|10.5

Workout Details

#-|SDist|-Split-|-SPace-|SPM-|AvgHR|MaxHR|DPS-

00|01204|04:58.1|02:03.8|23.0|142.6|159.0|10.5

01|01204|04:59.2|02:04.2|22.5|158.0|165.0|10.7

02|01200|05:03.3|02:06.4|22.8|158.0|168.0|10.4

03|01200|05:02.8|02:06.2|22.5|157.6|164.0|10.6

04|01193|05:02.1|02:06.6|22.6|161.2|165.0|10.5
Cooling Down (ErgData):
What you see is a screenshot from my Concept2 logbook. I don’t have a parser for the ErgData CSV file in my plotting tool yet. Should not be too difficult. Yesterday, I literally had the SpeedCoach parser written, working and tested in 10 minutes.
Edit
It took me 15 minutes to add a ErgData parser to my tool. Had to calculate the Power in Watts by hand. It’s a pity that they don’t include Drive Length, Drive Speed, Drag Factor, Peak Force and Average Force in the CSV download.
Now, the only problem is that I will have to manually put the ErgData row in SportTracks. I don’t want to write a CSV to TCX converter. This, to me, is the downside of ErgData. Lack of export to SportTracks, Garmin Connect, Strava, and other fitness sites … I understand that Concept2 may want to build out their own logbook. I want my data to be free, however, and I want to see my rows (OTW and OTE) next to my runs and bike rides.
By sanderroosendaal • Uncategorized • 4 • Tags: concept2, erg, OTE, pm5, rowing, rowing data, taper, training