Oct 3 2016
Sunday – Recovery / Monday – Steady State: Autumn Colors!
Sunday
The plan called for a recovery cross training. Romana had to pick up some things from the river club house of our rowing club, and the boys needed some exercise as well. So the four of us took bicycles and did a big 2 hour loop through Brno. First following the brook that flows through our neighborhood, then over the Lesna hill and down to the Svitava river, which we followed for about 25 minutes. We crossed Komarov to the other river, Svratka, and followed it back into Brno and to our rowing club’s river base. Then back uphill to Kralovo Pole and home. 27 km in total, 2 hours at a leisurely pace. Average heart rate 97bpm, max heart rate 144 bpm when I was pushing Robin near the end. So not a very high suffer score, but I think the workout fulfilled its goal: Get some light exercise to help recover from Saturday’s session.
And Saturday’s session was hard. I was still feeling it in my legs and shoulders and even got some massage to help recover from it.
https://www.strava.com/activities/731901065/overview
Interesting development. The leaderboard for one of the segments was removed by Strava, because it was “flagged as hazardous”. I agree. It is a hazardous segment. You’re crossing two ramps to a four lane road in this segment:
https://www.strava.com/activities/731901065/segments/17951576030
In the evening, I planned my workouts for this week, and I also started planning the next meso cycles. I have a head race coming Saturday, and after that it is no OTW racing until April. I admit that I am looking forward to the winter period. I always feel it’s a nice time of the year. Many steady state sessions, laying the foundations for a successful next rowing season. For now, I am planning to do 4 Steady State rows, 1 other rowing session and one cross training session per week, plus cycling to and from work and strength training. The other session type will be “hard distance” trials in the beginning, as well as some of the lactate tests, although I am wondering whether I keep the “2 speed test” on the list.
Monday
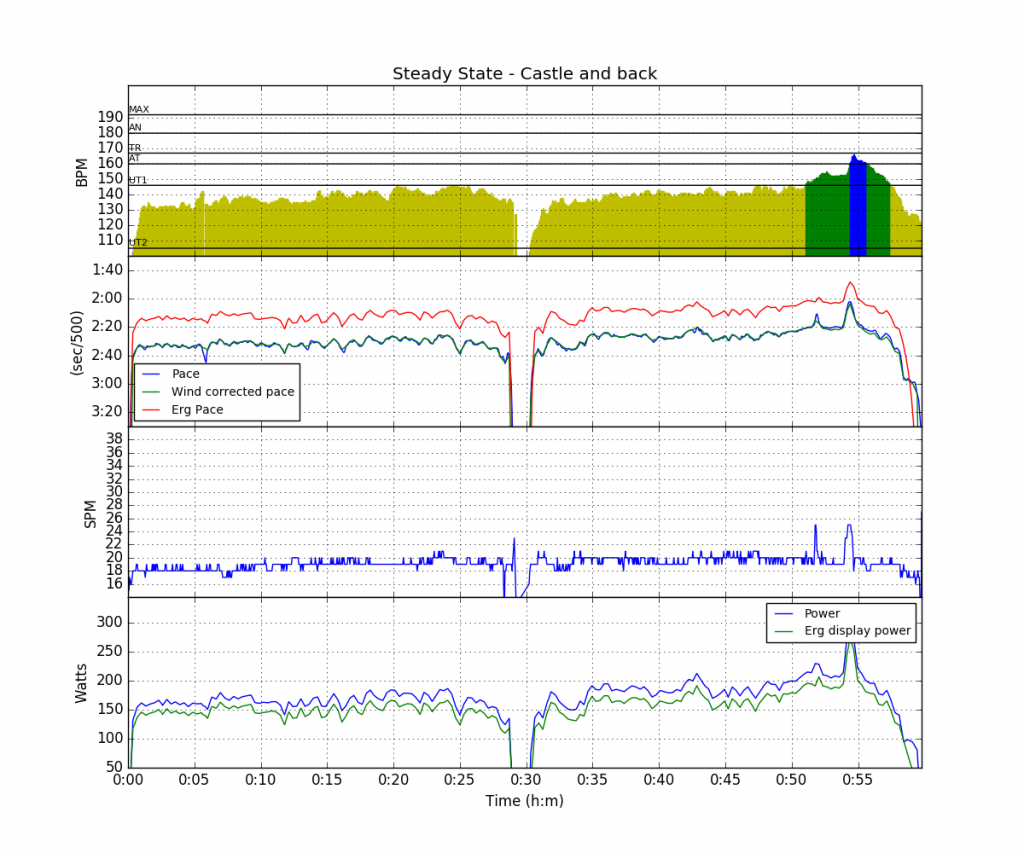
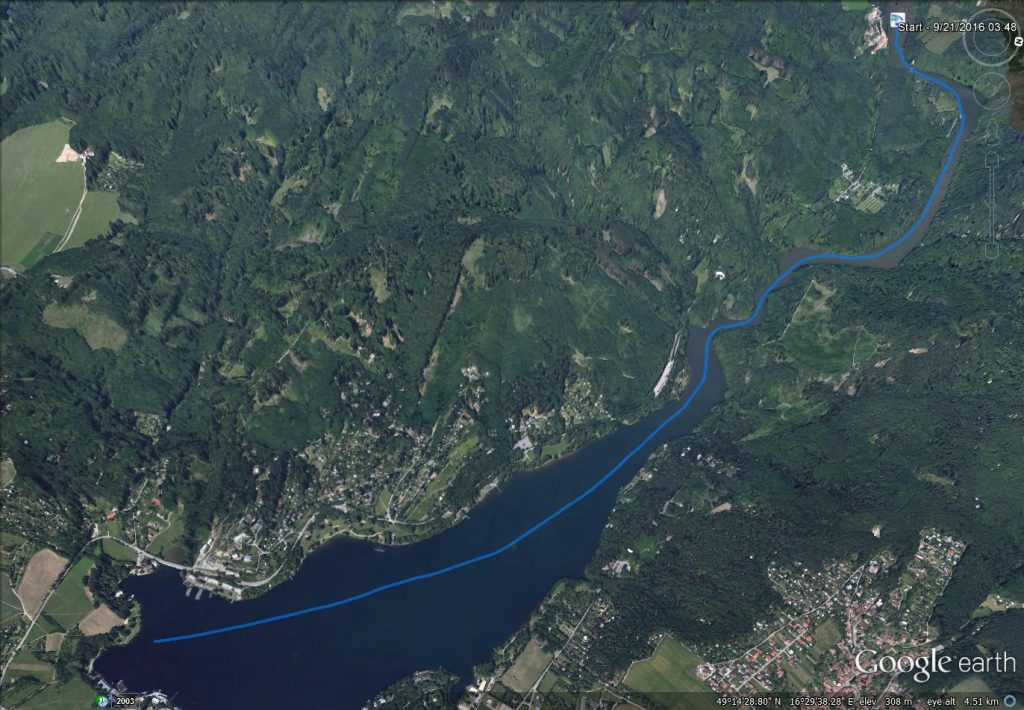
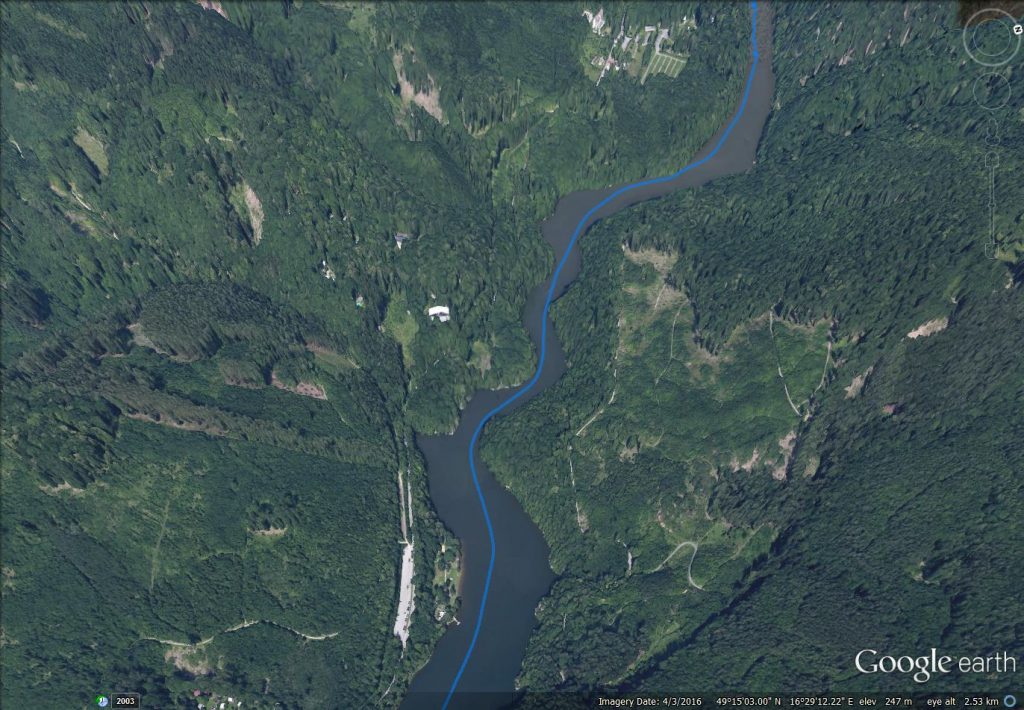
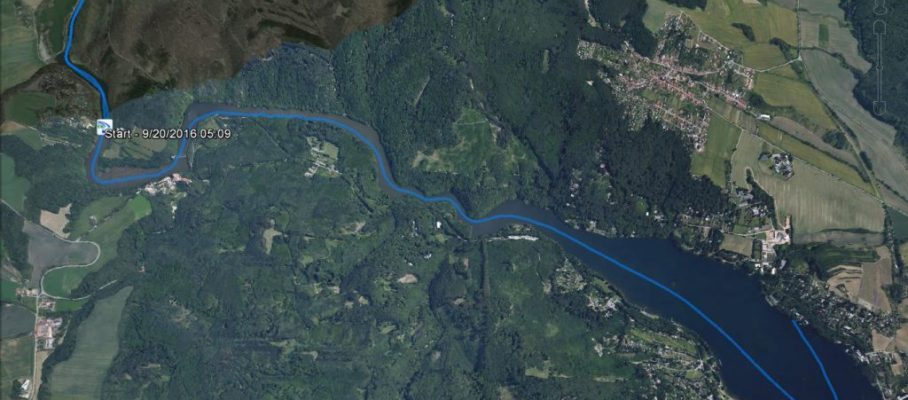
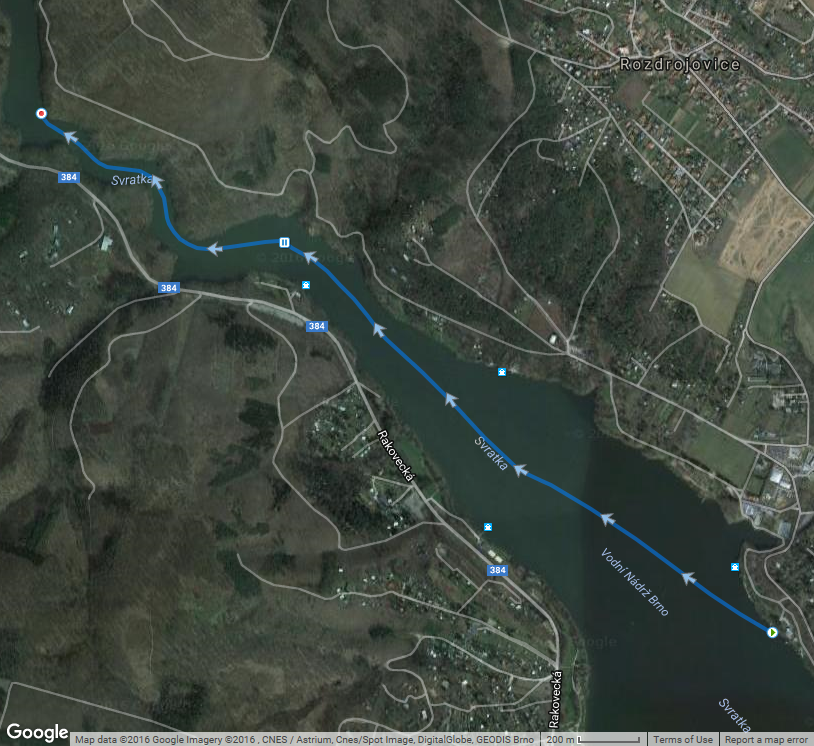
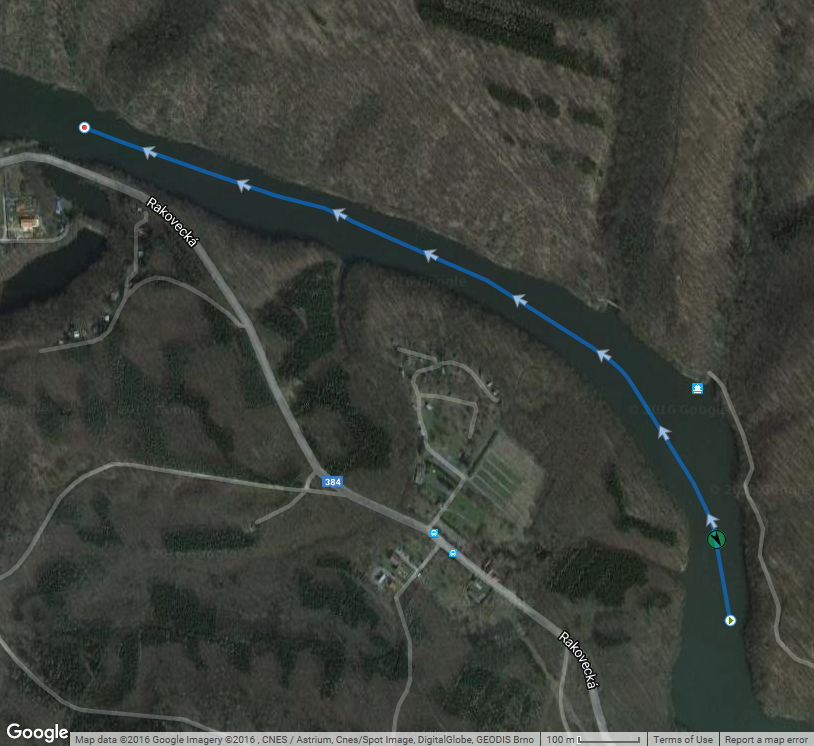
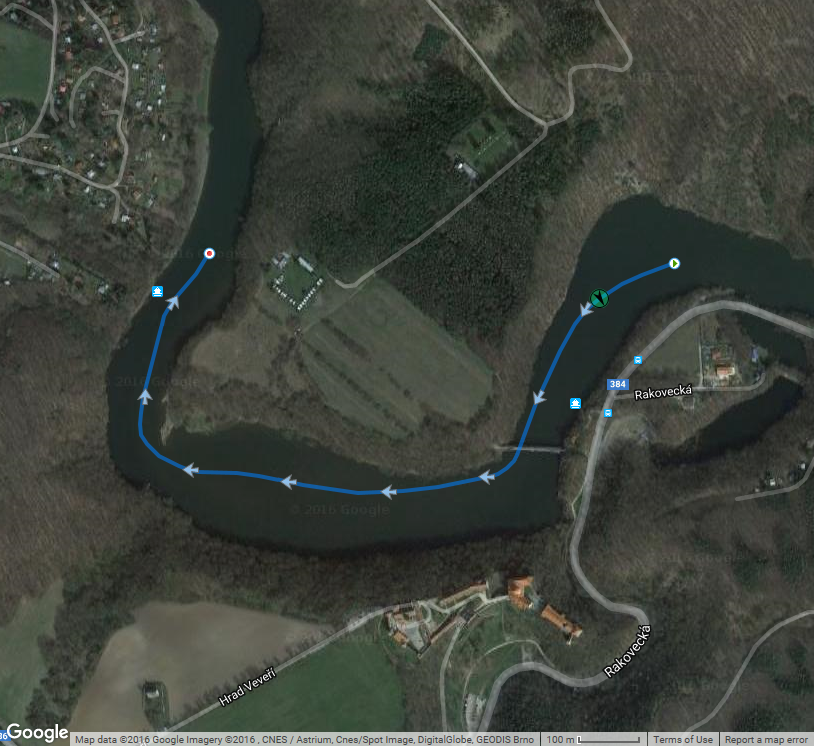
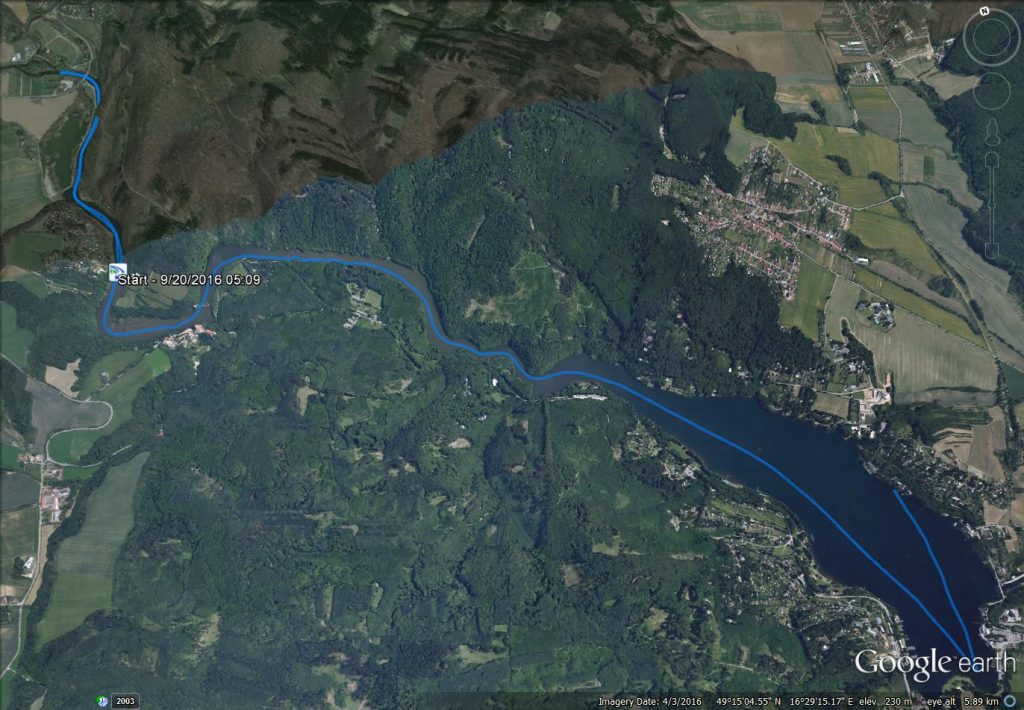
I feel like I am still recovering from Saturday’s session, but today was a nice steady state row in the single. I went up to the castle and back. If I had a camera with me, I would have taken a picture. In the gorge, the leaves are starting to get yellow and orange and it’s very beautiful. This will probably not last long because the forecast for this week is cold and rainy weather, and hard wind for this afternoon and Tuesday. Today it was fantastic. The temperatures haven’t dropped yet and the “rain” was just a mild drizzle in the last 20 minutes of the row. The water was flat.
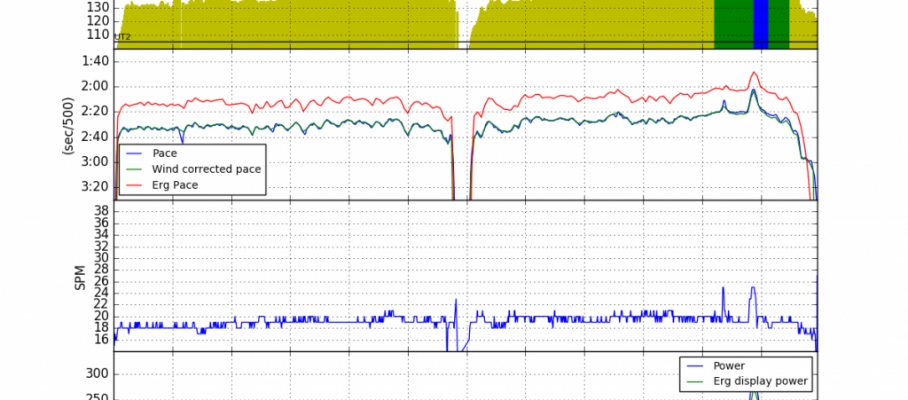
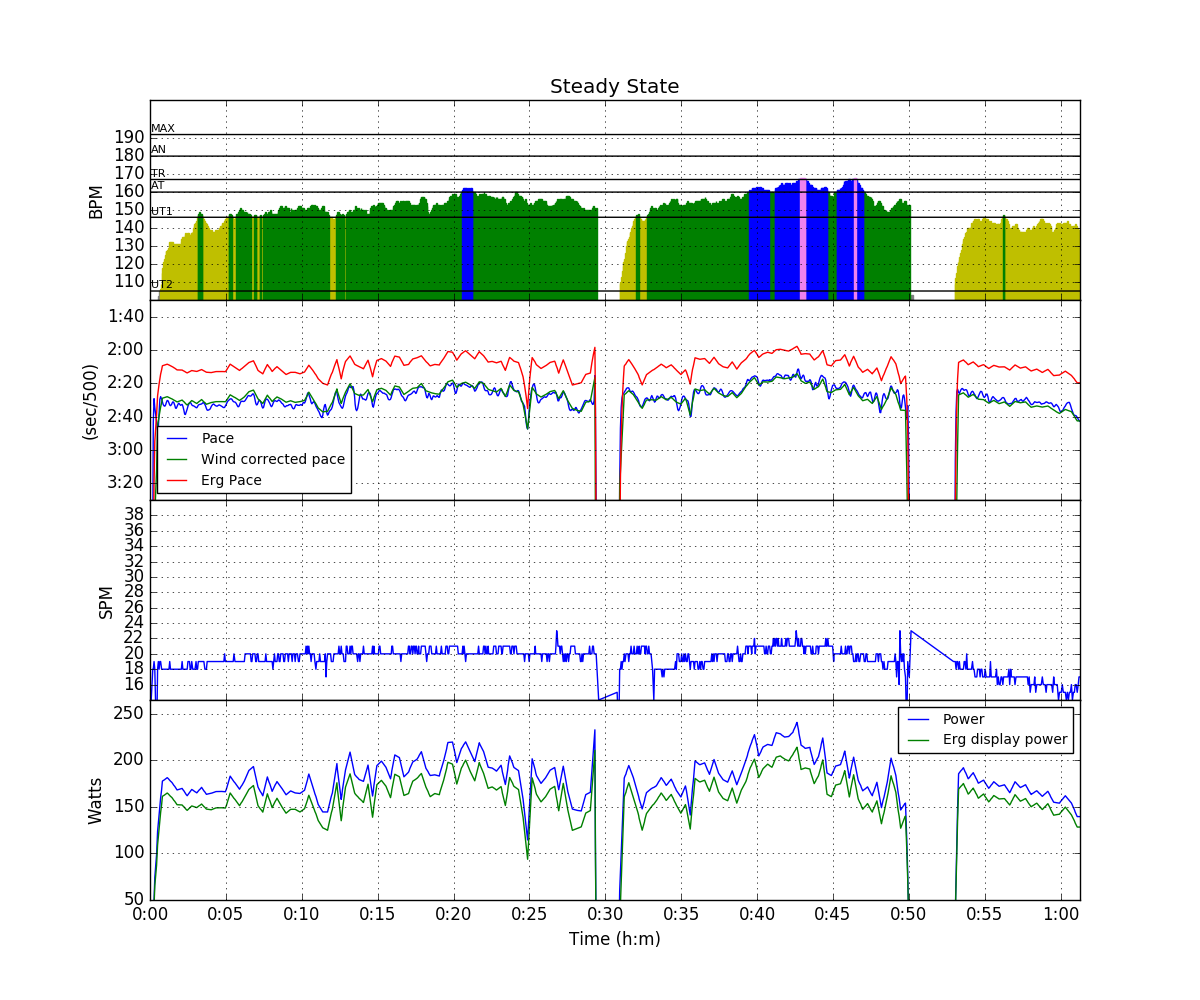
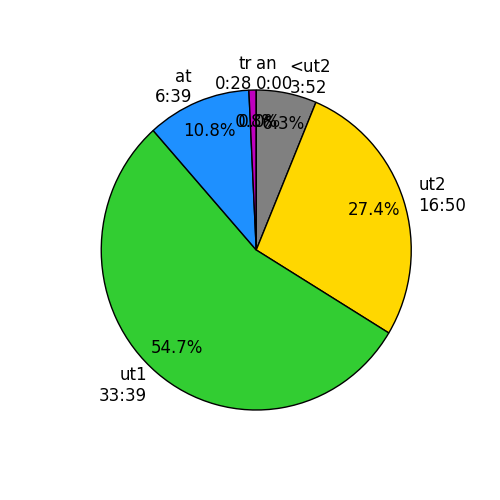
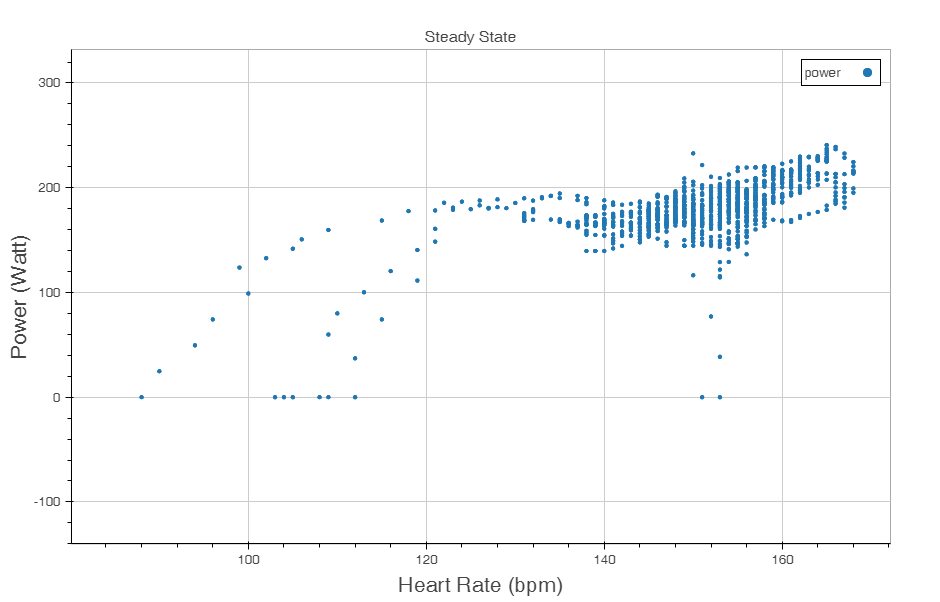
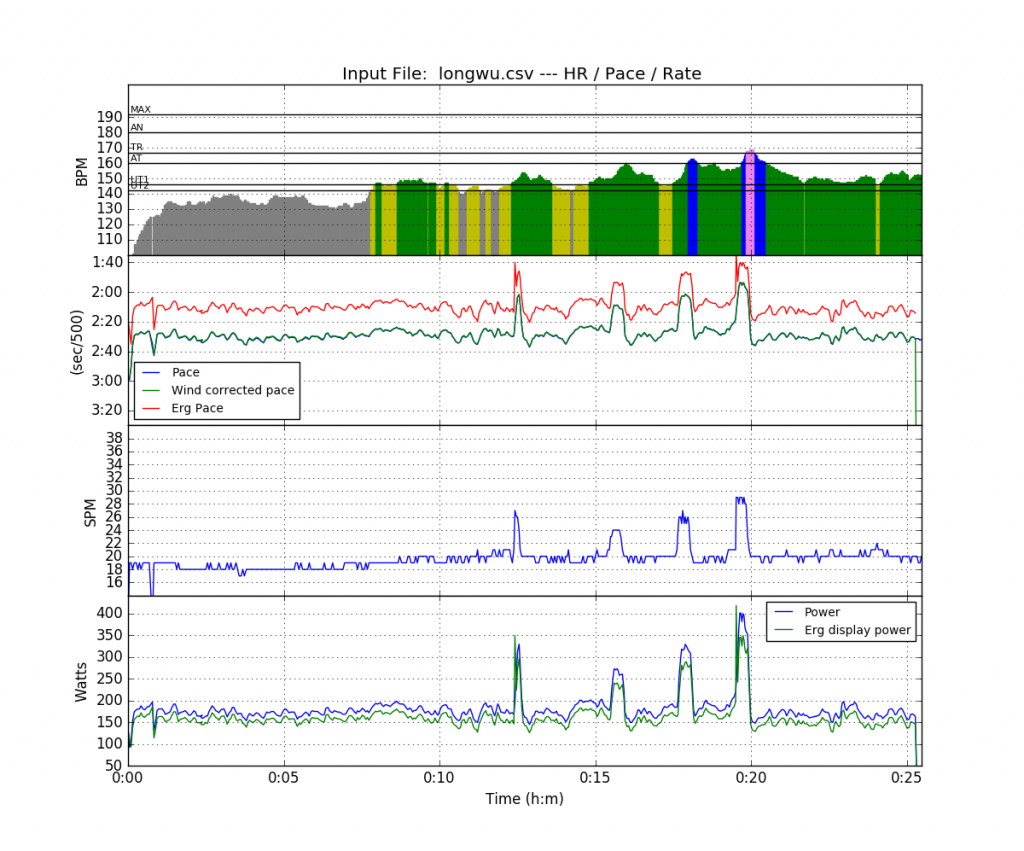
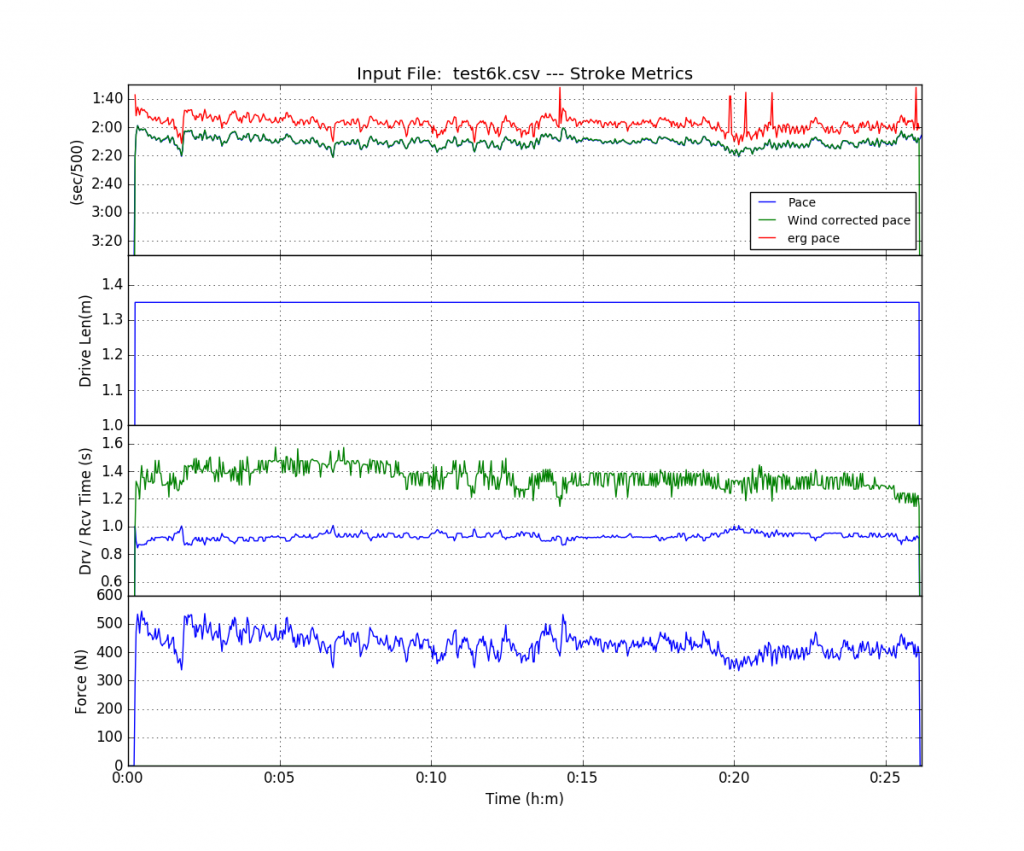
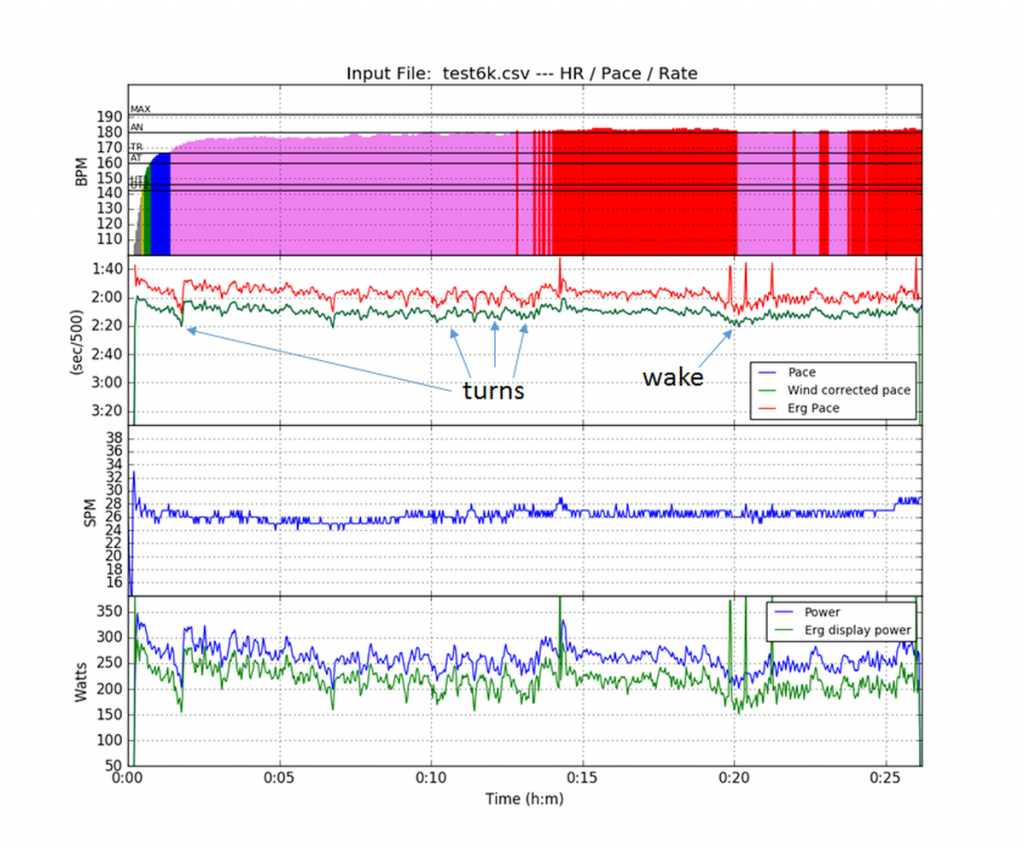
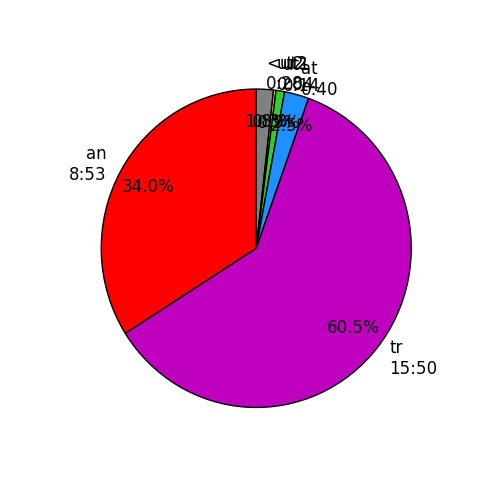
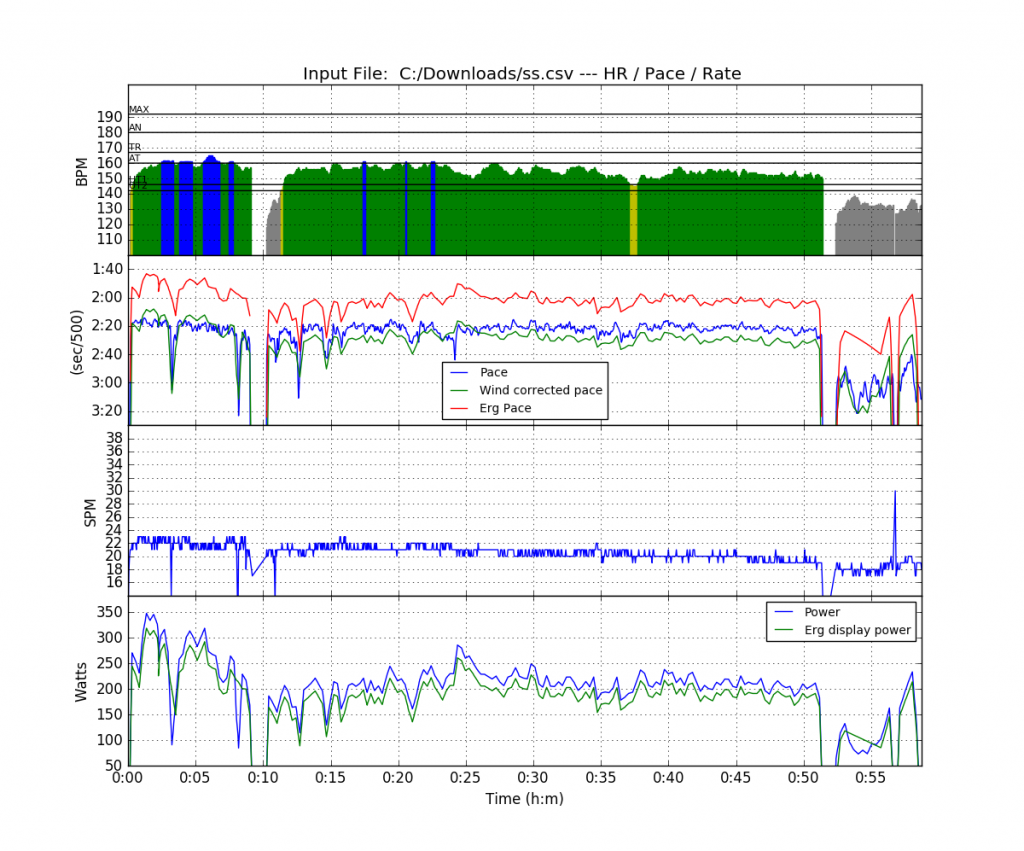
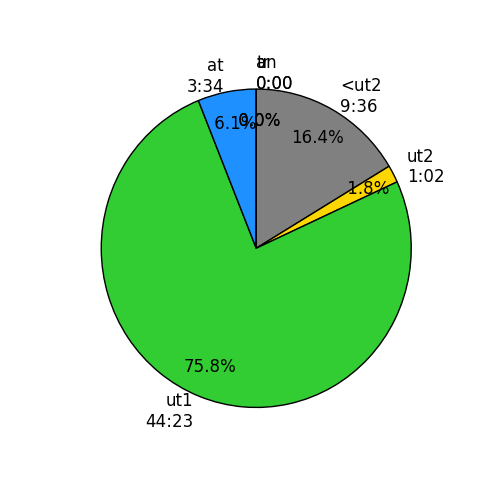
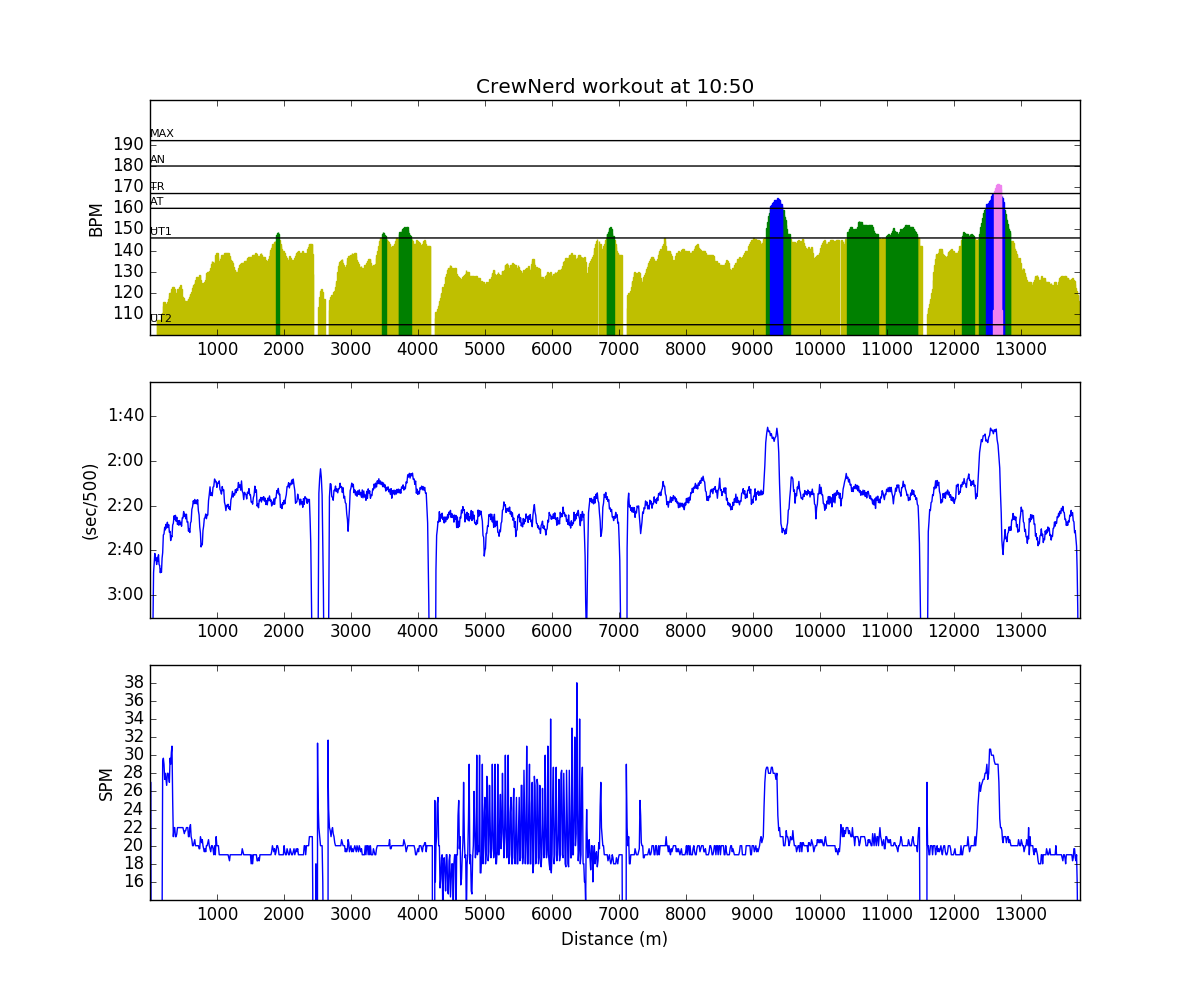
On the SpeedCoach, I had selected total time and total distance, and I didn’t know the heart rate until I analyzed the session afterwards. It turns out the average heart rate was only 139bpm. During the row, I tried to just focus on technique (and a bit of steering) and I was estimating I was going at around 170-180W of “equivalent erg pace”. From the graph, it seems I was more at 150W, increasing a bit in the second half. So perhaps I was working less hard than I thought I was, but the pace was pretty OK.
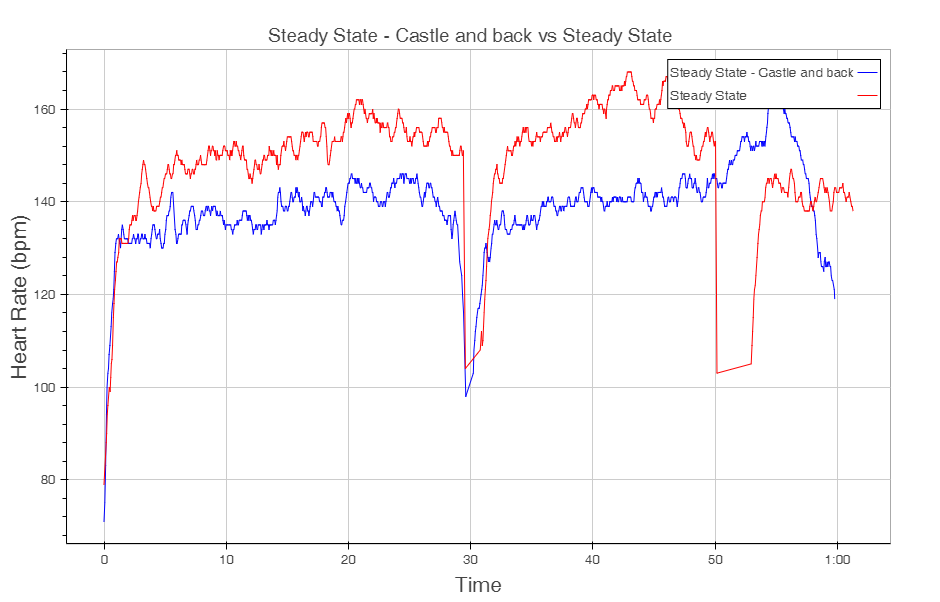
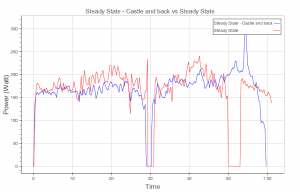
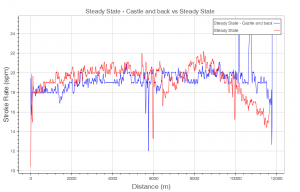
Here is a comparison of today’s row (blue line) with the Steady State row of last Tuesday (red line). Same section of the lake/river. Same time of the day:
So on Tuesday I rowed with an average heart rate of 150bpm, same average stroke rate. Same average temperature. Same distance. A week ago, my average pace was 2 seconds per 500m faster.
The difference is of course that a week ago, I started with a faster pace and a higher stroke rate, whereas today I eased into the session.
If you’re wondering what the little pace jump is at the end of the row. Coming back to the lake, I met three of our elite scullers who had just completed their warming up. I passed them while they were turning around, and then they started their session. I am not sure what they were doing, but they were at 25spm and catching up with me. I first did a test, rowing their rhythm for a few strokes to assess what their stroke rate was, then waited until the second guy was next to me and switched to 25spm. I stayed next to him during the few strokes, and then I turned the boat towards our club house. It was interesting to do. This was a heavyweight guy who has more experience in sweep rowing, and his 2k erg is around 6:10. His stroke was noisier, heavier, harder, but my silent, light, and weak stroke was ok to stay next to him for a few strokes, doing 1:59-2:01 pace.
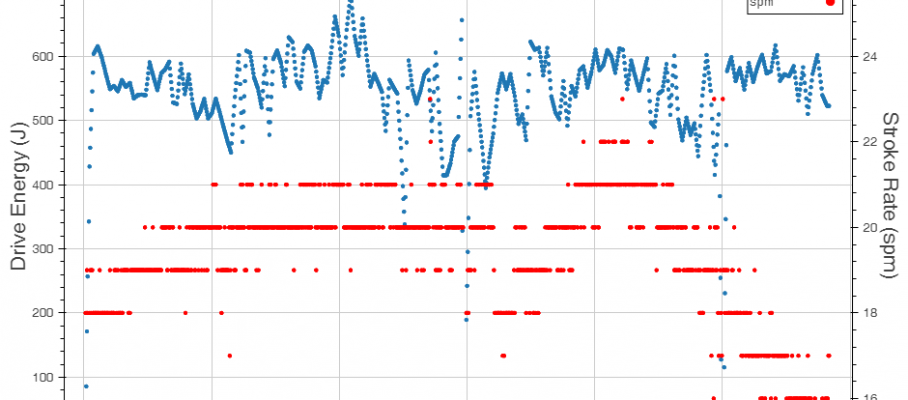
In the esoteric plots part of this blog, here is the one for this session:
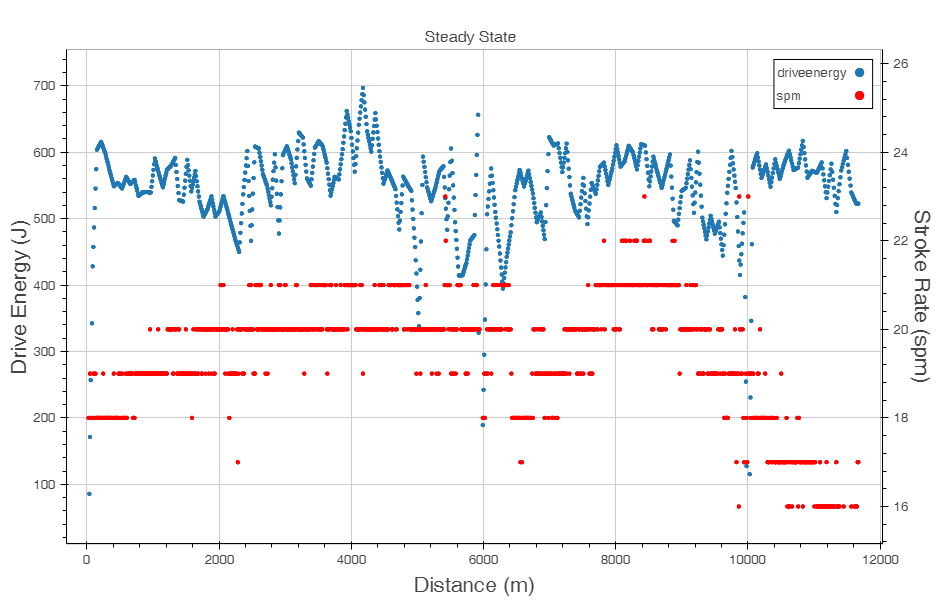
The Y axis is “Drive Energy”, which is the amount of energy you put into the motion of the boat. The X axis is stroke frequency. Multiplying these two parameters gets you the power. To illustrate this, rowing at 20SPM with 600J per stroke is the same power as 15spm with 800J per stroke, even though it will activate different fibers in your muscles. By the way, the energy per stroke is a parameter of the same dimensions as the infamous “SPI” that some people use on the erg.







Oct 4 2016
A short OTW session and some thoughts about “SPI”
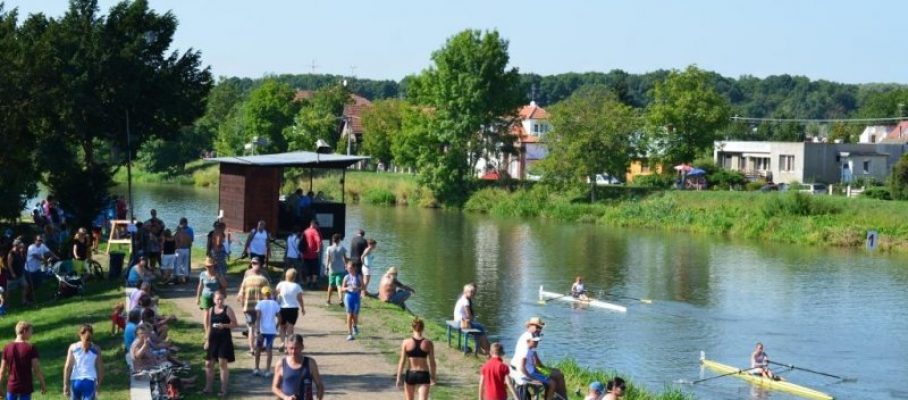
The featured image does not reflect today’s weather conditions.
Today’s session started quite dramatic. Seven AM. Rain. The wind didn’t seem so strong but it was creating a big chop. I am not a native speaker so haven’t mastered the 57 or more words the English language probably has to distinguish between different ways of water surface movement. Ripple. Chop. Waves. On the lake part of the outing, I would say it was significantly choppy. Now and then a wave would wash over my stern, and the waves definitely slowed down the rowing.
When I set off, I needed a few strokes to feel comfortable in the rough circumstances, but then I got moving, albeit slowly, towards Rokle, where the river part starts.
That is where I did my workout. Today it was just a few short bouts at head race pace, 5x3min/3min rest. After 2 intervals, the NK SpeedCoach started flashing “Low Memory”, which caused a bit of a panic. I stopped, abandoned the workout, and went to the list of workouts, intending to delete one or two older workouts to make space. It turns out that on the SpeedCoach, you can only erase all workouts, which clearly I didn’t want to do, because I needed the data of the warming up and the first two intervals. Luckily, the workout list also told me that I was consuming 90% of available memory, so I estimated that I still had about an hour of rowing left before the memory would be full.
Work Details - Part I

#-|SDist|-Split-|-SPace-|-SPM-|AvgHR|MaxHR|DPS-

01|00672| 03:00 |02:13.9| 26.3| 163 | 173 | 8.5 - headwind, turns

02|00536| 03:00 |02:47.9| 19.3| 146 | 172 | 9.2 - rest

03|00709| 03:00 |02:06.9| 27.0| 169 | 176 | 8.8 - headwind

04|00055| 00:20 |03:09.0| 17.3| 173 | 176 | 9.2 - abandoned

Workout Summary

--|01972| 09:20 | 2:22.1| 24.0| 161 | 176 | 8.8
Work Details - Part II

#-|SDist|-Split-|-SPace-|-SPM-|AvgHR|MaxHR|DPS-

01|00736| 03:00 |02:02.2| 27.3| 168 | 176 | 9.0 - tailwind

02|00554| 03:00 |02:42.4| 18.3| 146 | 175 | 10.1 - rest

03|00730| 03:00 |02:03.2| 27.7| 169 | 176 | 8.8 - tailwind, turns

04|00541| 03:00 |02:46.3| 18.7| 147 | 175 | 9.7 - rest

05|00743| 03:00 |02:01.1| 27.7| 169 | 177 | 9.0 - tailwind, chop

06|00555| 03:00 |02:42.1| 18.0| 145 | 175 | 10.3 - rest

Workout Summary

--|03859| 18:00 | 2:19.9| 22.9| 160 | 177 | 9.3
Two of the intervals were steering through a couple of tight turns and thus good “mirror practice”:
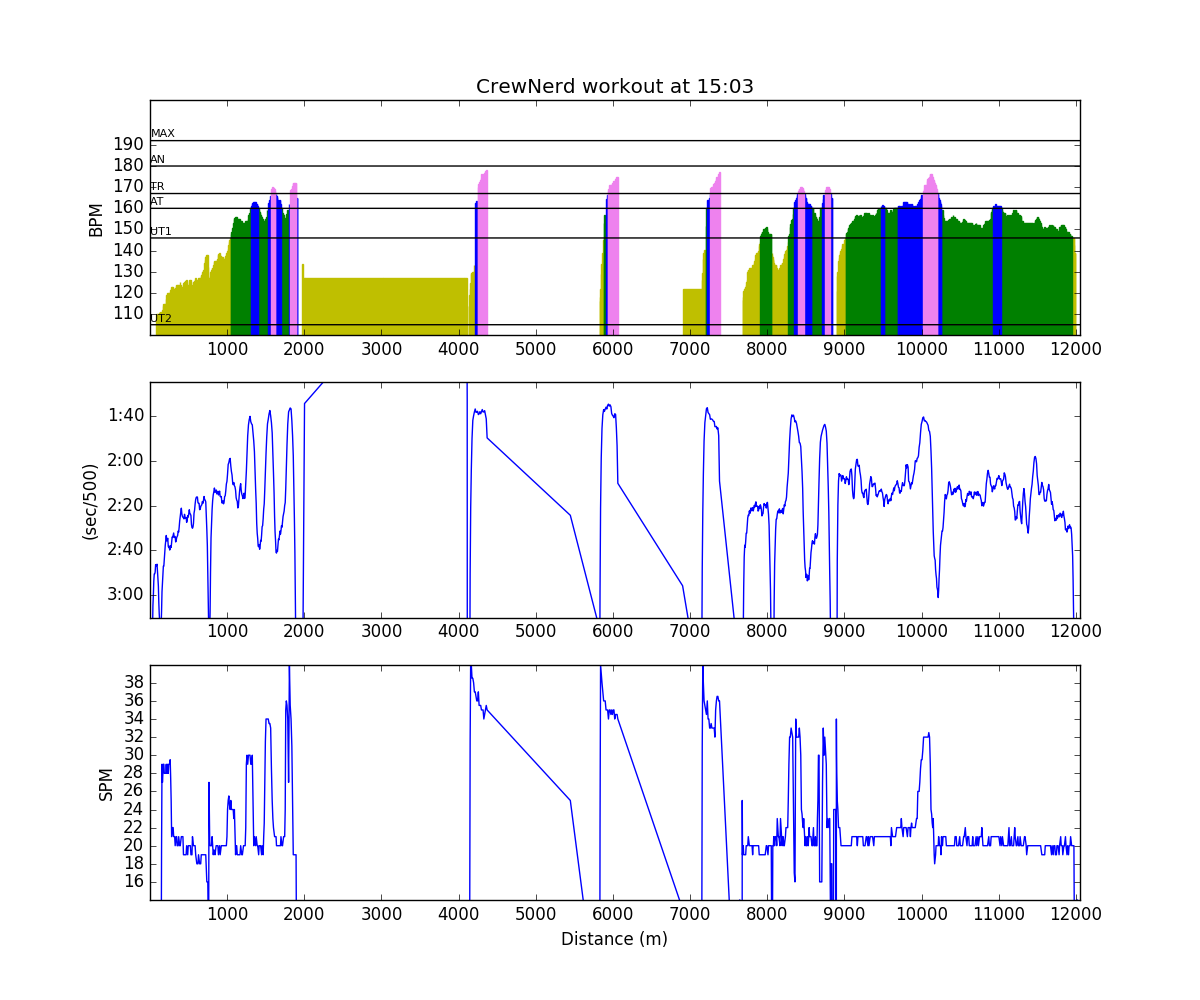
Here are the plots for the two parts:
I may have overestimated the wind strength a bit, because I think I was working a bit less hard in the headwind intervals and a bit harder in the tailwind intervals than suggested by the power values.
On Quadrant Charts in Cycling and Rowing
Cyclists with a power meter are fond of plotting pedal velocity against average effective pedal force. Here’s a good example: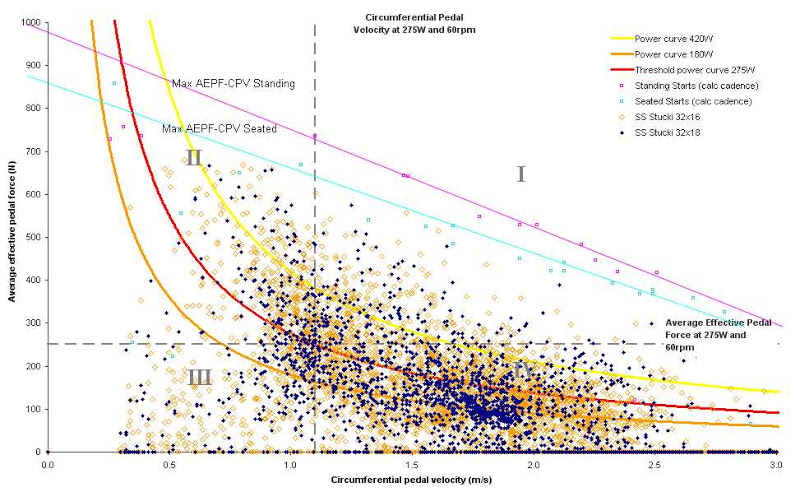
There are several reasons why this plot is interesting. The power is effectively given by the product of the pedal velocity and the average effective pedal force. Crank length comes into play as well, but this is usually fixed. Cycling speeds and gearing can result in circumferential pedal velocities which are so fast that it limits the average effective pedal force.
An equivalent plot in rowing would be to plot the average handle force as a function of handle speed. There are a few issues with that:
Here is a typical plot (of a recent 15km erg workout):
Not a lot to see.
As Thomas Carter (“Stelph”) has remarked, there is another plot that could be used for what cyclists call “Quadrant Analysis”, and here it is:
Here I plot the amount of Work done during the drive vs stroke rate. I should have not called this “Drive Energy”. “Work per Stroke” is a much better name, and I shall remind myself to change this. As with the cyclists plot, the power is essentially the stroke rate times the work per stroke (divided by 60 if you want power in Watts). Work per stroke is a function of drive length and drive force, and thus the plot doesn’t tell whether I shortened up or reduced force on the 25spm strokes, compared to the 20spm strokes (I did both).
I can imagine two ways of using this plot. For an analysis of a single session, you could see how fatigue influences drive energy and stroke rate. Usually, we go down in drive energy and increase the stroke rate to compensate. For multiple sessions, it could be interesting to see how these plots evolve over time for similar types of workouts. To be continued.
What is interesting is that the “Work per Stroke”, which is in my mind just a physical parameter to measure, is dividing the erg community. Dividing power by the stroke rate, you get something that erg rowers call SPI (Stroke Performance Index) and there are “believers” and “non-believers”. I believe there is some use, as long as we remember that average rowing power is a function of stroke length, handle force, and time taken on the recovery.
By sanderroosendaal • Uncategorized • 9 • Tags: OTW, power analysis, river, rowing, single, training