Apr 4 2016
New toy – and more python
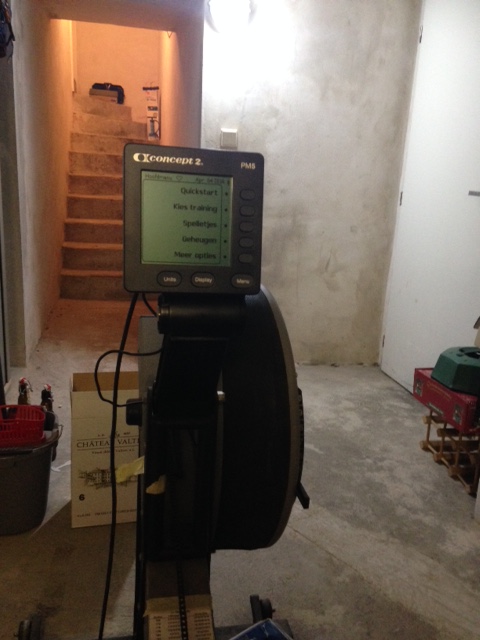
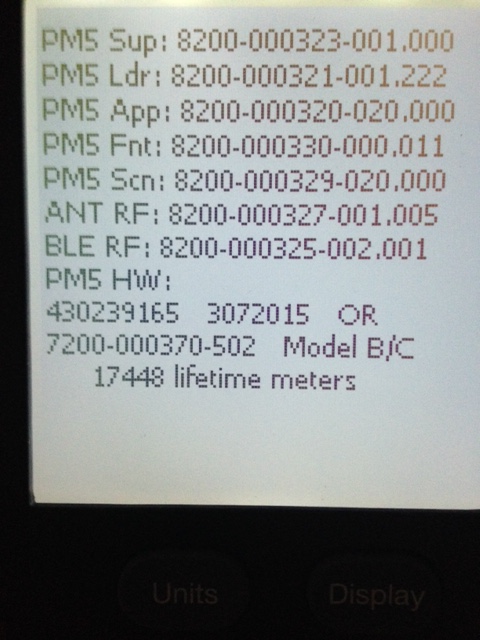
Got my PM5 today.
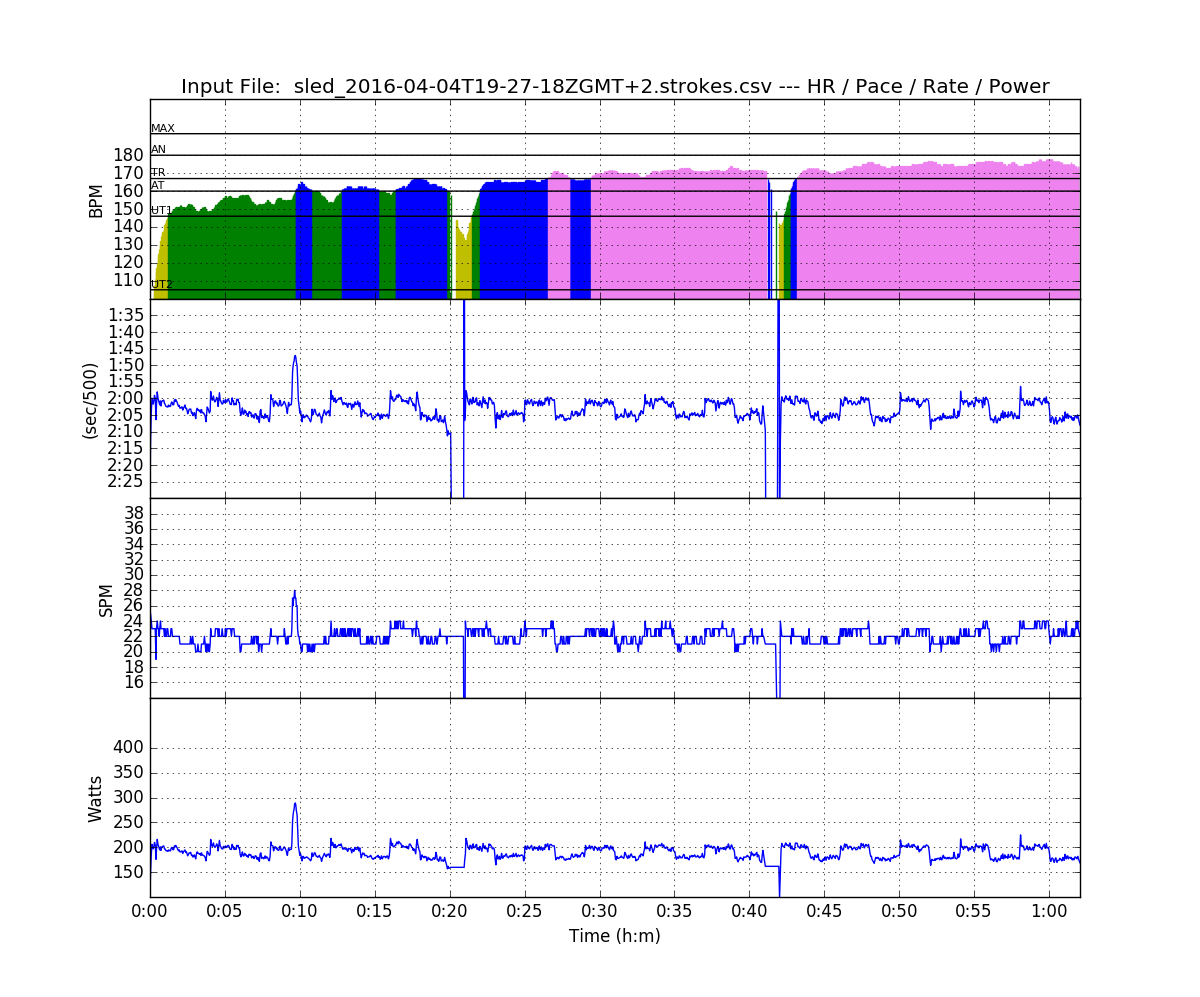
The row was a warming up, a 3x20min at 190W and a 2km cooling down.
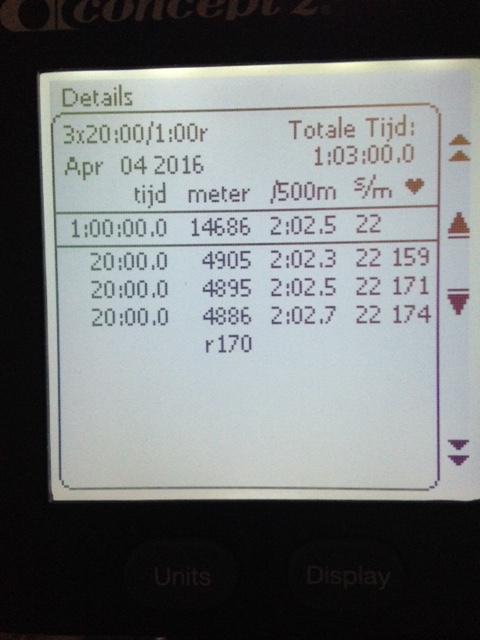
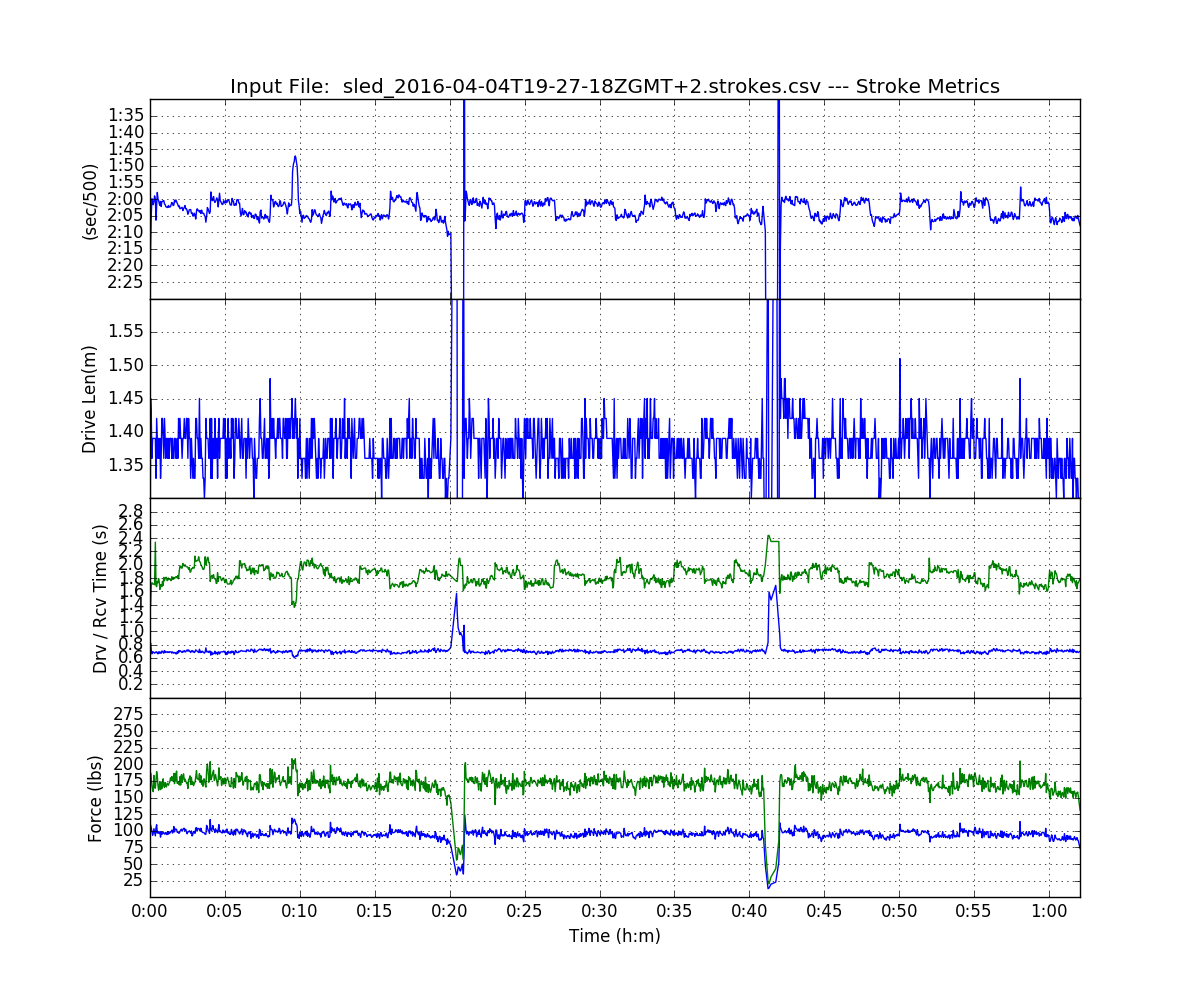
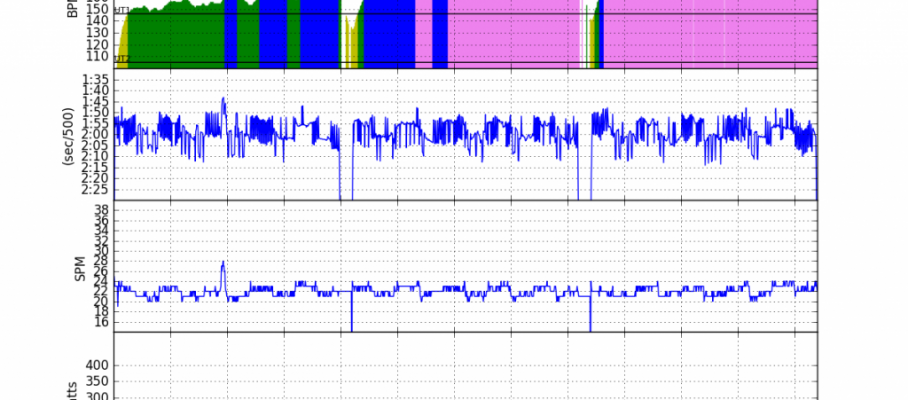
I also captured the row with painsled and exported both CSV and TCX files. The TCX files read fine into SportTracks. In contrast to CSV files that I have from other people who run painsled, my files don’t have HR data 🙁
EDIT – I reported this to the painsled developer (Rick) and he fixed it within 12 hours. See the plots in all their glory:
It’s already the third monitor for my Concept2 Model C. Here are the first two:
More Python
My python software ran great on my PC. Turns out the command-line scripts didn’t work too well on other people’s computers. Over the weekend, I did some testing, using my son’s Windows10 computer with a clean Python (Anaconda) install, and on my old Linux netbook. Greg also helped greatly by running subsequent updates on his macintosh.
Turns out Python packaging is quite confusing. In the end I got it all working. Now it should install easily for people who have Python and easy_install. Just installing Anaconda and then easy_install rowingdata should do the job. You get command-line scripts that should work on every platform.
It’s all documented on: https://pypi.python.org/pypi/rowingdata and http://pythonhosted.org/rowingdata/


Apr 6 2016
Playing with the PM5 and data tools
No time for an OTW row today. The taper plan called for a quiet 40 minutes row. I decided to play a bit with the PM5 and the different tools. Here’s what I did:
It all worked like a charm.
Warming Up (RowPro):
Workout Summary - D:tijdelijk2km_rowpro.csv_o.csv

--|Total|-Total-|--Avg--|Avg-|-Avg-|-Max-|-Avg

--|Dist-|-Time--|-Pace--|SPM-|-HR--|-HR--|-DPS

--|01998|08:35.0|02:09.0|21.9|140.3|156.0|10.6
Main Row (Painsled):
Workout Summary - sled_2016-04-06T07-44-35ZGMT+2.strokes.csv

--|Total|-Total-|--Avg--|Avg-|-Avg-|-Max-|-Avg

--|Dist-|-Time--|-Pace--|SPM-|-HR--|-HR--|-DPS

--|06000|25:06.0|02:05.6|22.7|155.5|168.0|10.5

Workout Details

#-|SDist|-Split-|-SPace-|SPM-|AvgHR|MaxHR|DPS-

00|01204|04:58.1|02:03.8|23.0|142.6|159.0|10.5

01|01204|04:59.2|02:04.2|22.5|158.0|165.0|10.7

02|01200|05:03.3|02:06.4|22.8|158.0|168.0|10.4

03|01200|05:02.8|02:06.2|22.5|157.6|164.0|10.6

04|01193|05:02.1|02:06.6|22.6|161.2|165.0|10.5
Cooling Down (ErgData):
What you see is a screenshot from my Concept2 logbook. I don’t have a parser for the ErgData CSV file in my plotting tool yet. Should not be too difficult. Yesterday, I literally had the SpeedCoach parser written, working and tested in 10 minutes.
Edit
It took me 15 minutes to add a ErgData parser to my tool. Had to calculate the Power in Watts by hand. It’s a pity that they don’t include Drive Length, Drive Speed, Drag Factor, Peak Force and Average Force in the CSV download.
Now, the only problem is that I will have to manually put the ErgData row in SportTracks. I don’t want to write a CSV to TCX converter. This, to me, is the downside of ErgData. Lack of export to SportTracks, Garmin Connect, Strava, and other fitness sites … I understand that Concept2 may want to build out their own logbook. I want my data to be free, however, and I want to see my rows (OTW and OTE) next to my runs and bike rides.
By sanderroosendaal • Uncategorized • 4 • Tags: concept2, erg, OTE, pm5, rowing, rowing data, taper, training