Feb 14 2016
End of the volume week
Friday
The girls did a circuit training using their own body weight. I put an erg on sliders in the weights room so I could check them a bit.
I rowed for an hour, randomly interrupted to give instructions to the girls, or just to get some water.
Tired after a long, heavy week. Still, on the slides, my pace is 1 to 2 seconds per 500m faster in these steady state rows, than on the static erg.

Saturday
I was looking forward to this training. Some running with the girls. They would do a 4x3min with light jogging in between, and for me it would be a light jog all the way. Both were wearing heart rate monitors. It was interesting to see the differences. Girl A, the slower runner, albeit with better running technique, reaches 195 bpm while chatting during the warming up, and reached 205 bpm on the first interval. Girl B, the faster runner – but with worse technique, she wastes a lot of energy in up-down motions – had difficulty getting her heart rate above 165bpm in the first interval, and reaches 175 bpm in the subsequent intervals. A case of sprinter vs stayer … girl B prefers the longer distances and has difficulties to start fast. 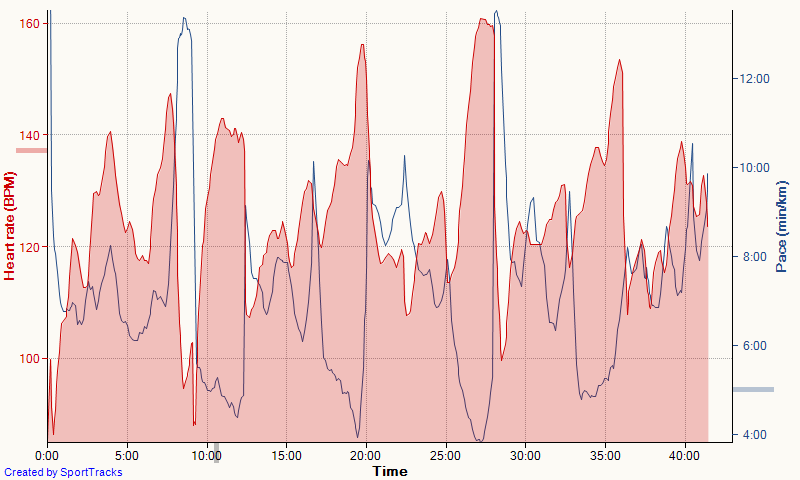
Just fifty minutes.
Sunday
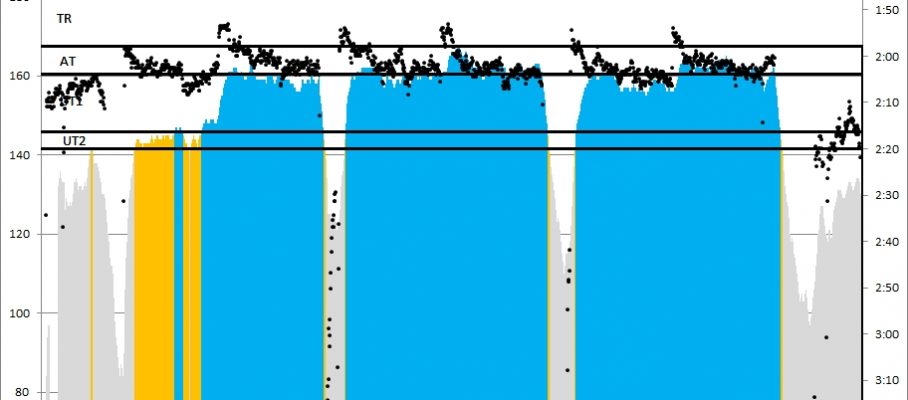
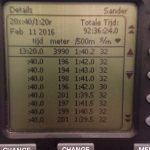
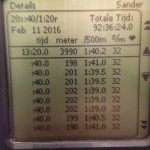
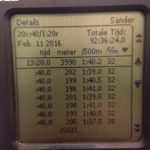
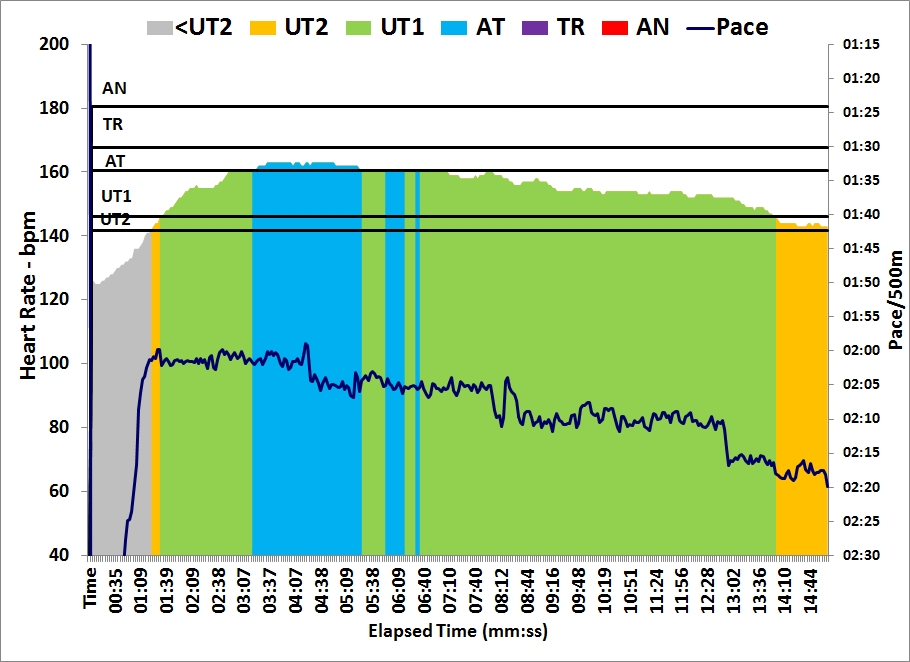
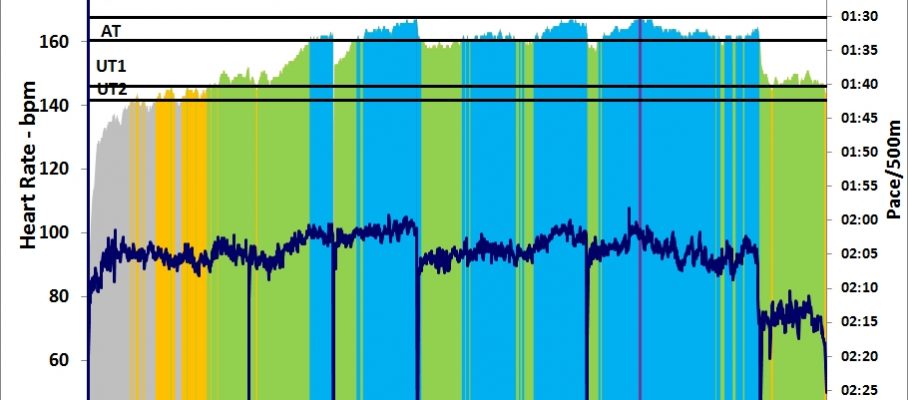
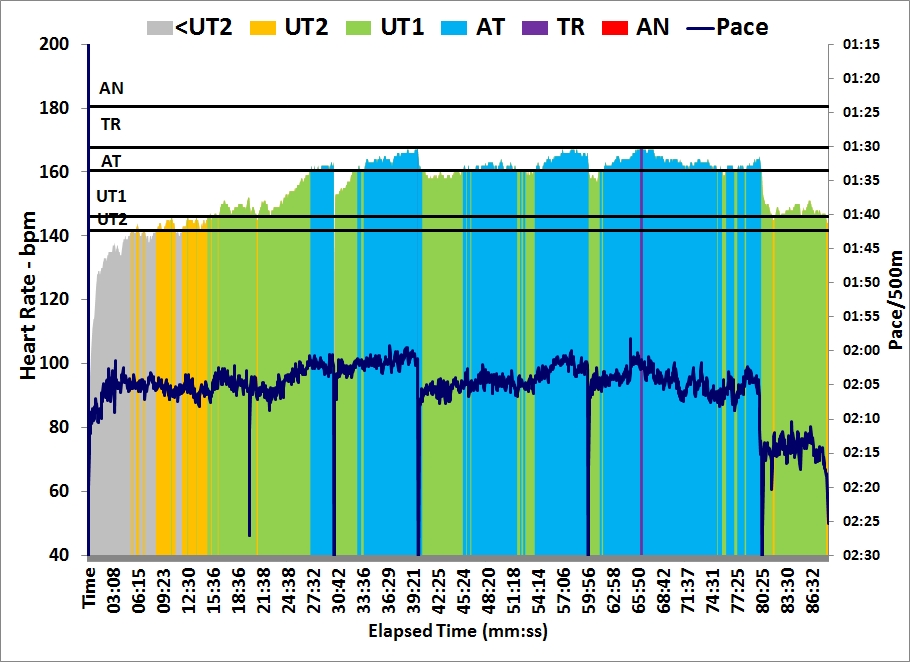
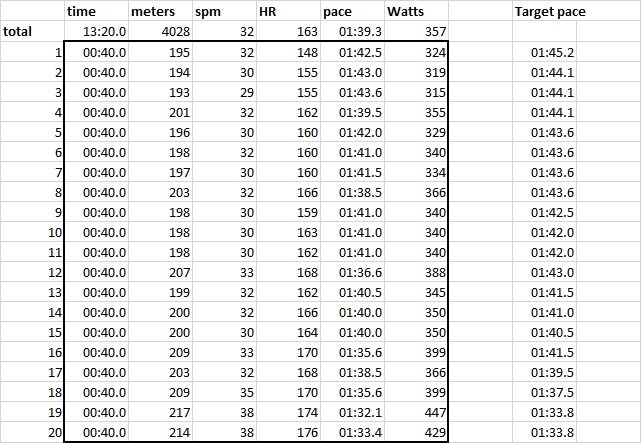
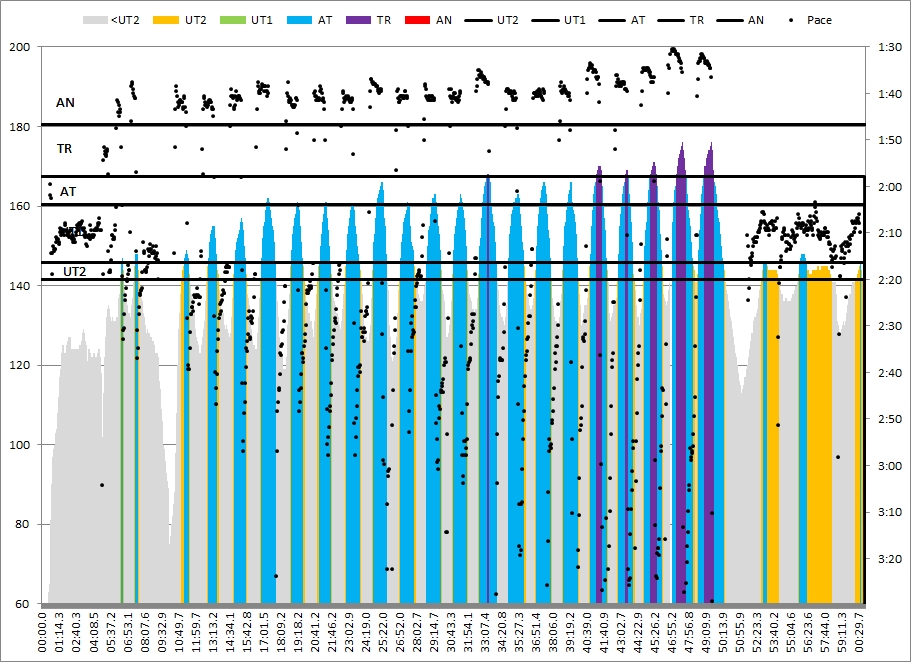
I decided to do only 3×20 minute of erging (vs 4×20 minutes). I would fulfill my training plan with that and my body is really longing for a rest day now. Did a 1402m warming up, so I could put some score on the 2016 Carole McNally memorial CTC, then 3x20min. I didn’t force the average to 200W, but let it evolve naturally.
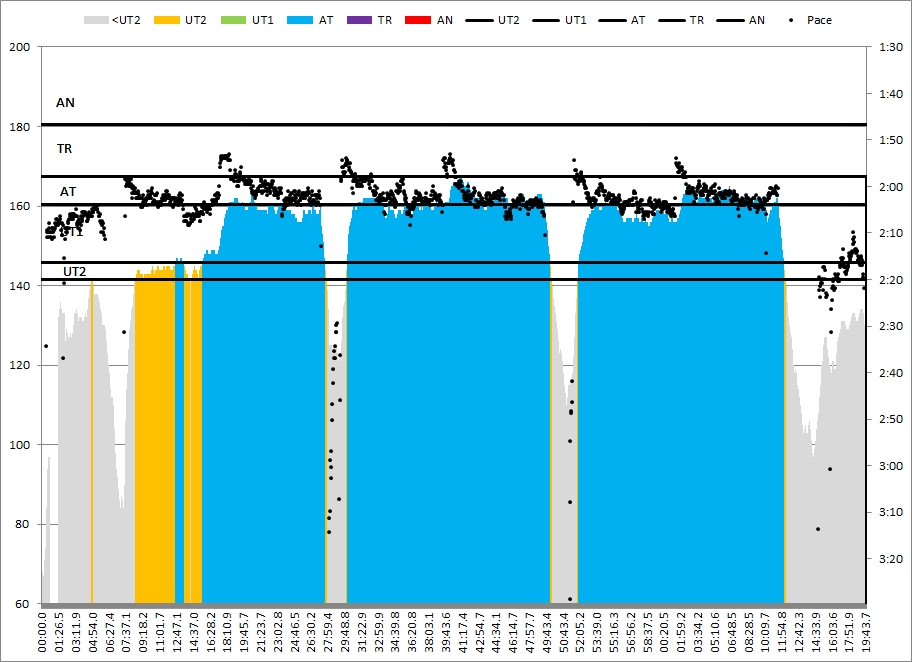
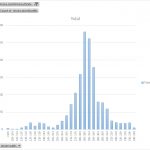
Added a stroke histogram to my Painsled spreadsheet, just for fun. The left graph is just the 20 minute intervals. The right one includes the warming up, cooling down, and rest periods.
Here are the stats, from the same spreadsheet:

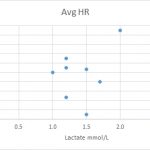
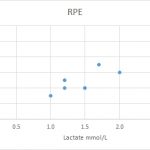
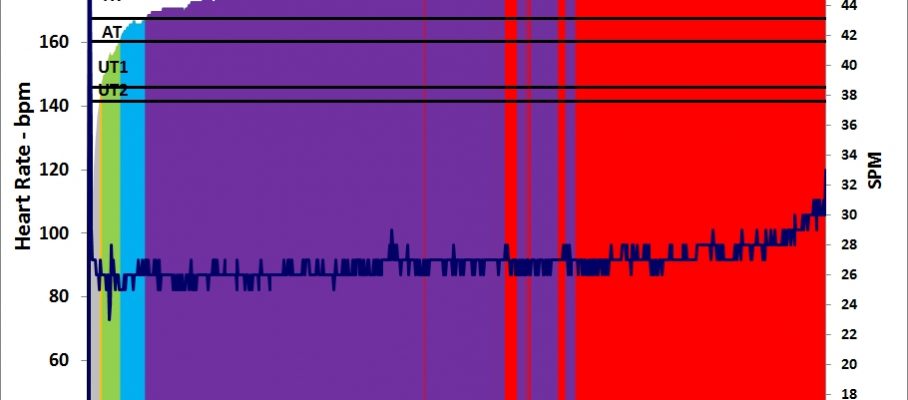
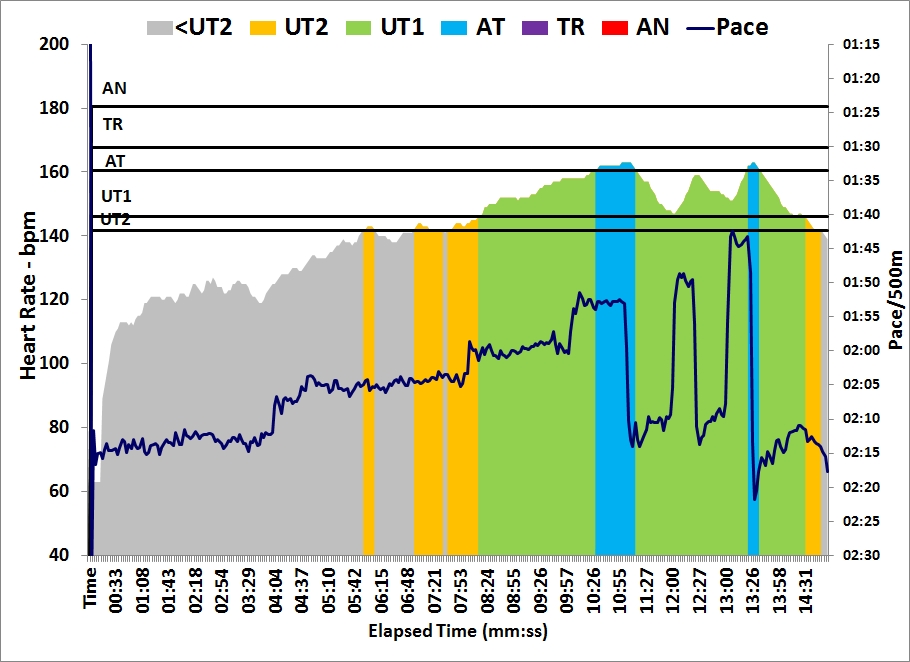
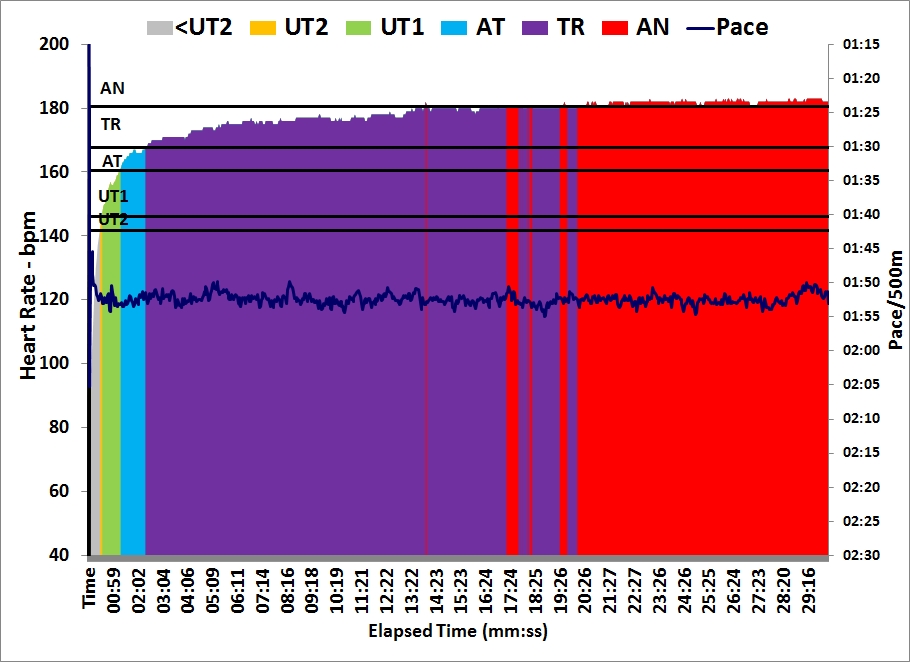
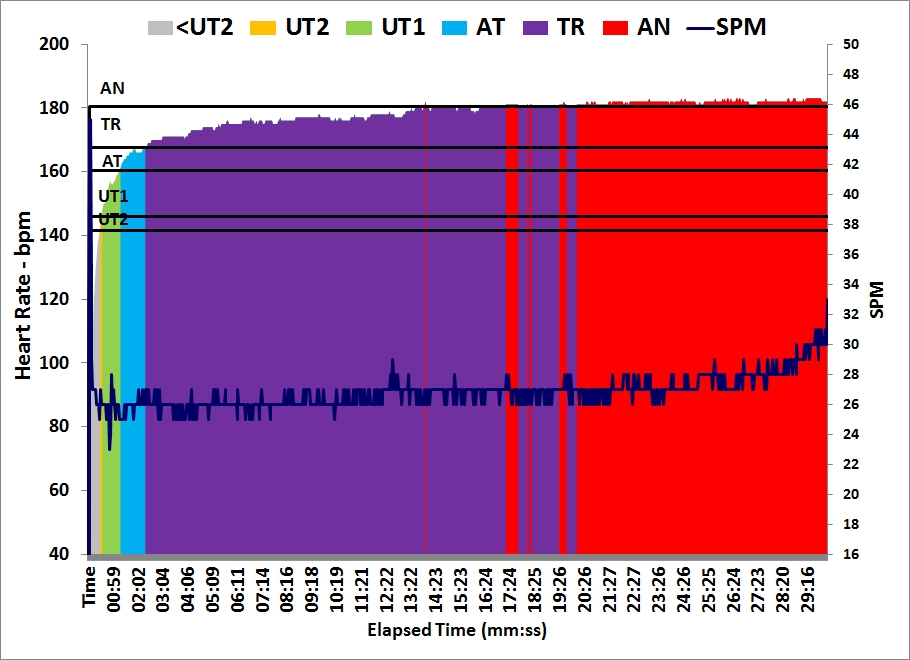
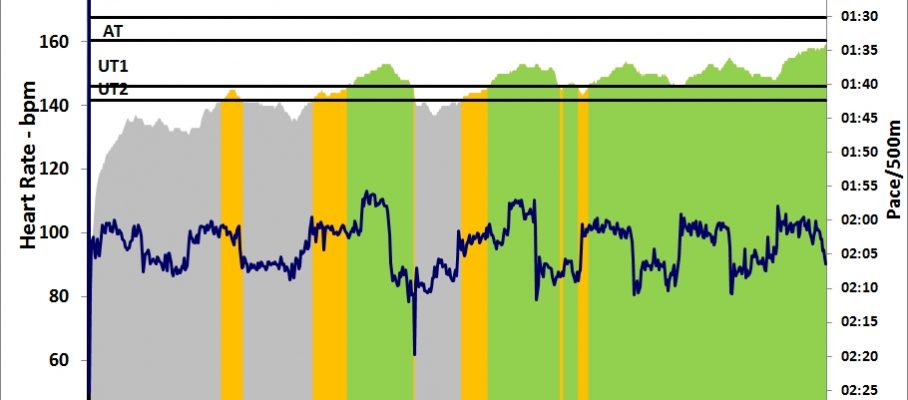
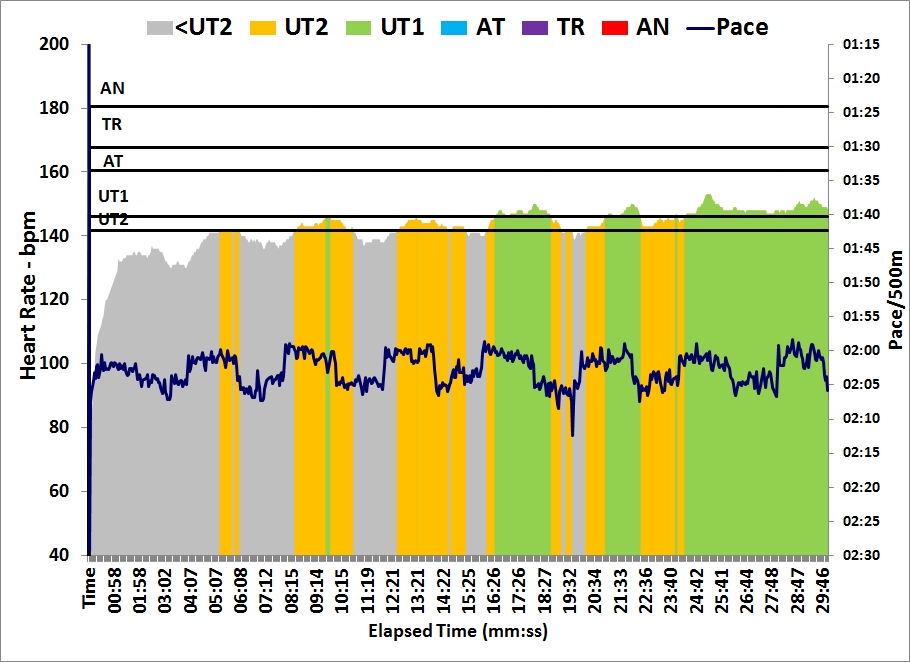
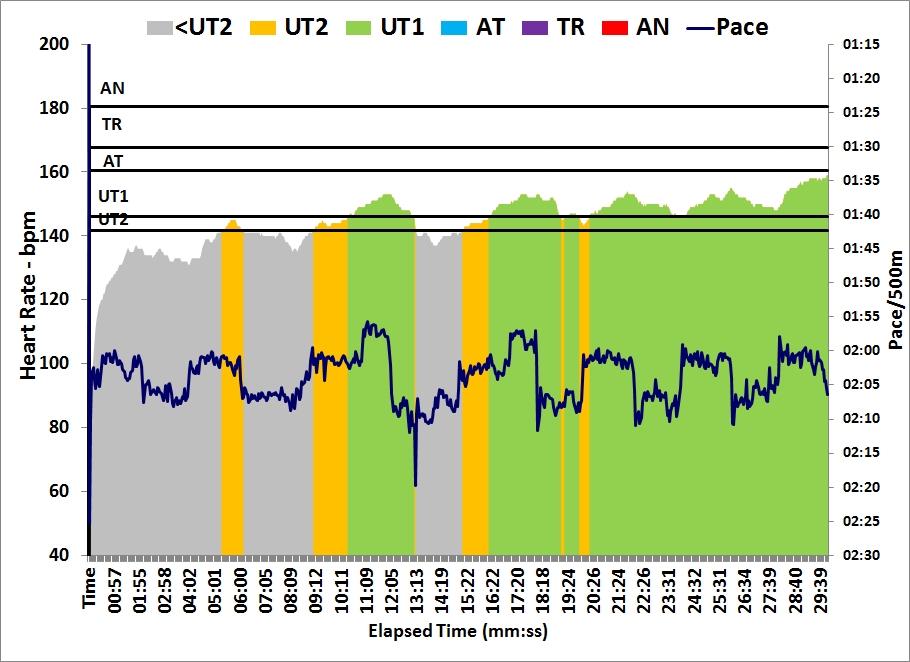
Heart rate was low on average. I am keeping track of lactate at 60min vs average heart rate and perceived exertion. All rows are between 190 and 202 W on average.
Left graph is heart rate vs Lactate. Not really a trend visible. The right graph is my subjective perceived exertion. It is a little suspicious because I write down this number already knowing the result of the lactate measurement … still I try to be honest and think about the number during the row, before I know the result. This measure correlates a lot better with the lactate measurement.
Next week: Low volume, a 1 minute test and a 6 km PB attempt. Tomorrow a rest day: Hurray.



Feb 17 2016
Trabant to Ferrari part 2
Monday
Flight to Brussels. Sit in hotel room to prepare meeting. No training. Rest day.
Tuesday
Before work, I spent an hour in the hotel fitness. A thought crossed my mind: How many marathons have I run on these two treadmills in this particular hotel? Difficult to estimate. I ran for 20 minutes, then did a 40 minute strength session, partly exercise machine, partly body weight.
Tough negotiations at which I cannot say anything. Except perhaps that I personally managed to stall the negotiations for 4 hours. I won’t say what I think about the outcome. Mystery, mystery.
Dinner in Brussels with my sister. We had a good time.
Wednesday
Up at 4AM to catch the flight home. A long day.
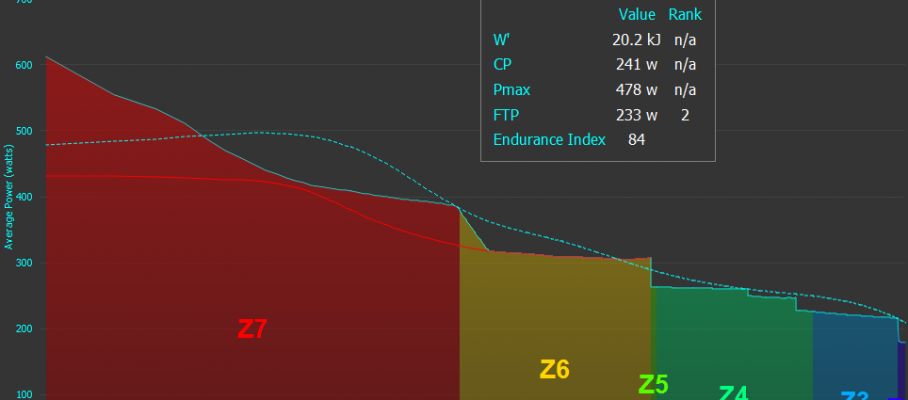
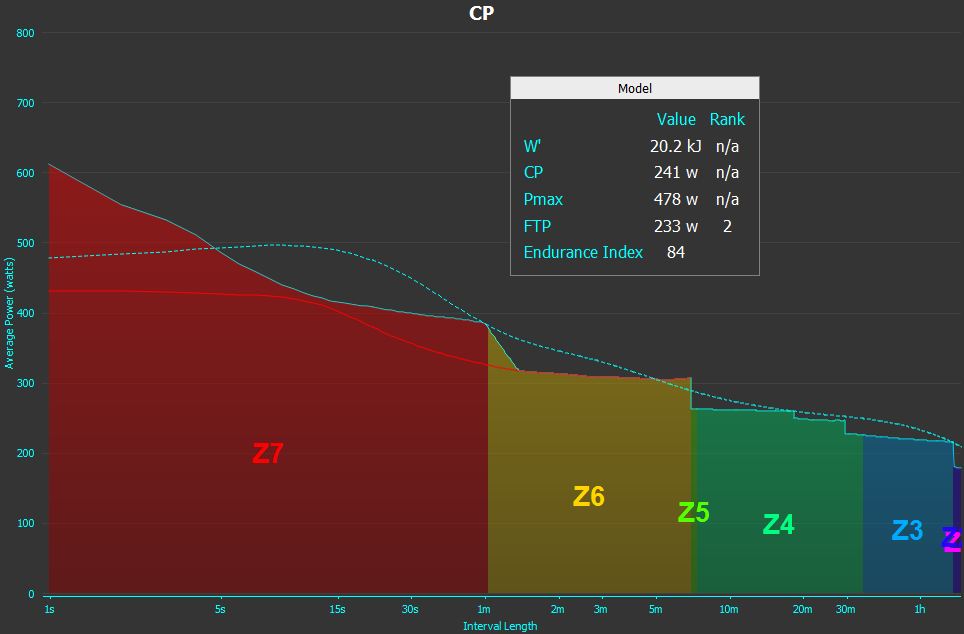
Despite travel tiredness and noticable DOMS in shoulders, legs and arms from yesterday’s strength training, I decided that today was the day I would repeat the 1 minute test I did in november, described in this post. Here’s the graph from back then:
Here is the graph from today (blue curve today, dark green curve November):
Here is a table comparing the results:
The targets are from the “Rowing Faster” book and are an age-corrected range for lightweight male rowers. Still at the bottom of the range. Somehow my “peak power” has decreased, although I think it is more an artifact of the November test, where I basically hit 611 W in the first stroke and then dropped to 550W in the next stroke. Today, I started low (500W and then brought it up to 550 and held it for ten strokes. After about 30 seconds the two curves are suspiciously close. One could even call them “identical”.
Improved the average power by 17W. Not sure how significant that is. The drop off times and value are influenced quite a lot by the peak power. Perhaps I did the test wrong today. Not sure. Looking purely at the graphs, I think I should conclude I am slightly better in terms of “average power over first 10 seconds” and the overall level of the curve is significantly higher in the first 30 seconds.
Next test for this week: A full out 6K. Should be a PB attempt.
By sanderroosendaal • Uncategorized • 1 • Tags: anaerobic, concept2, erg, OTE, rowing, testing