
Sep 25 2016
Friday – 20×60’/60′ rest
Thursday
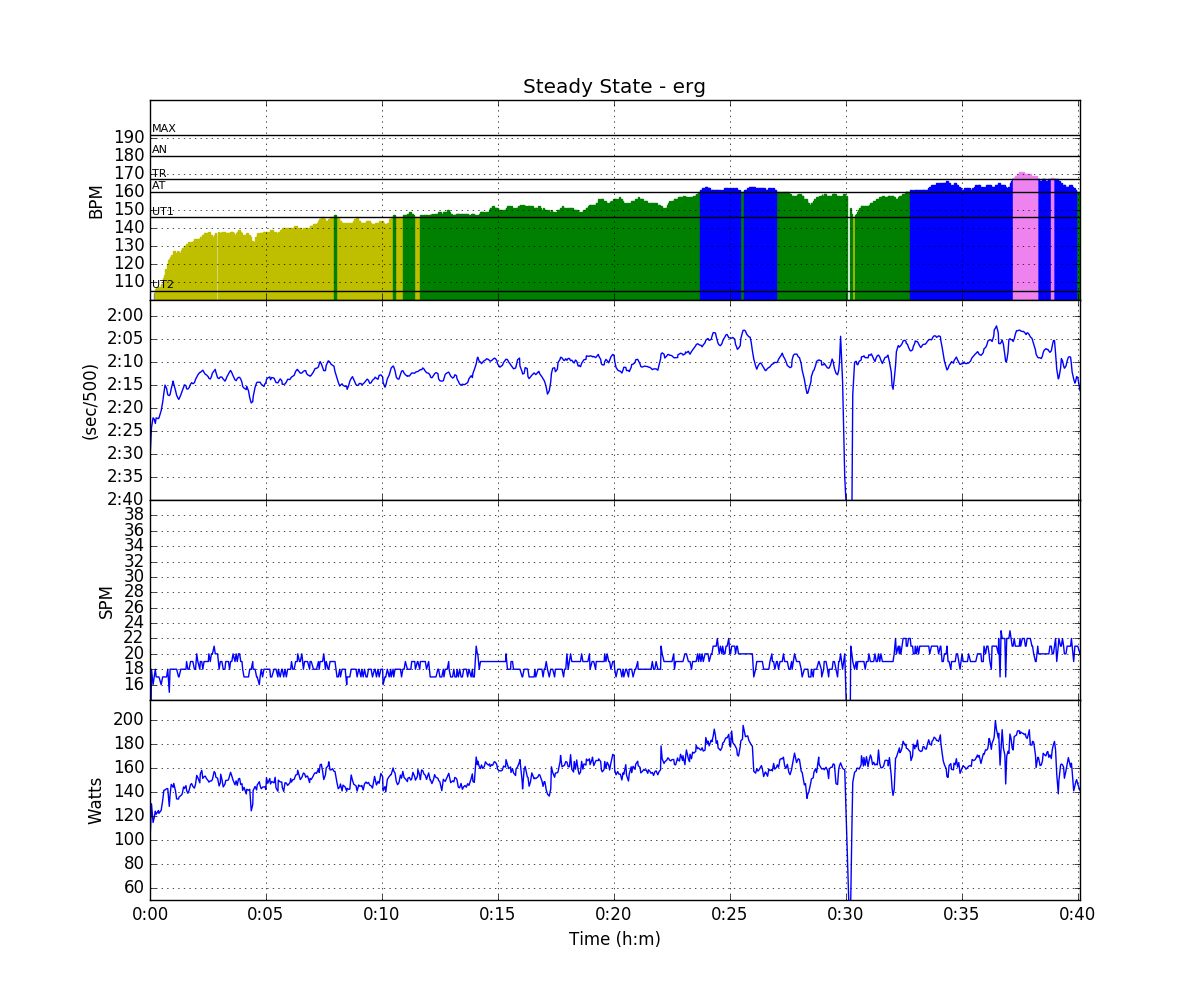
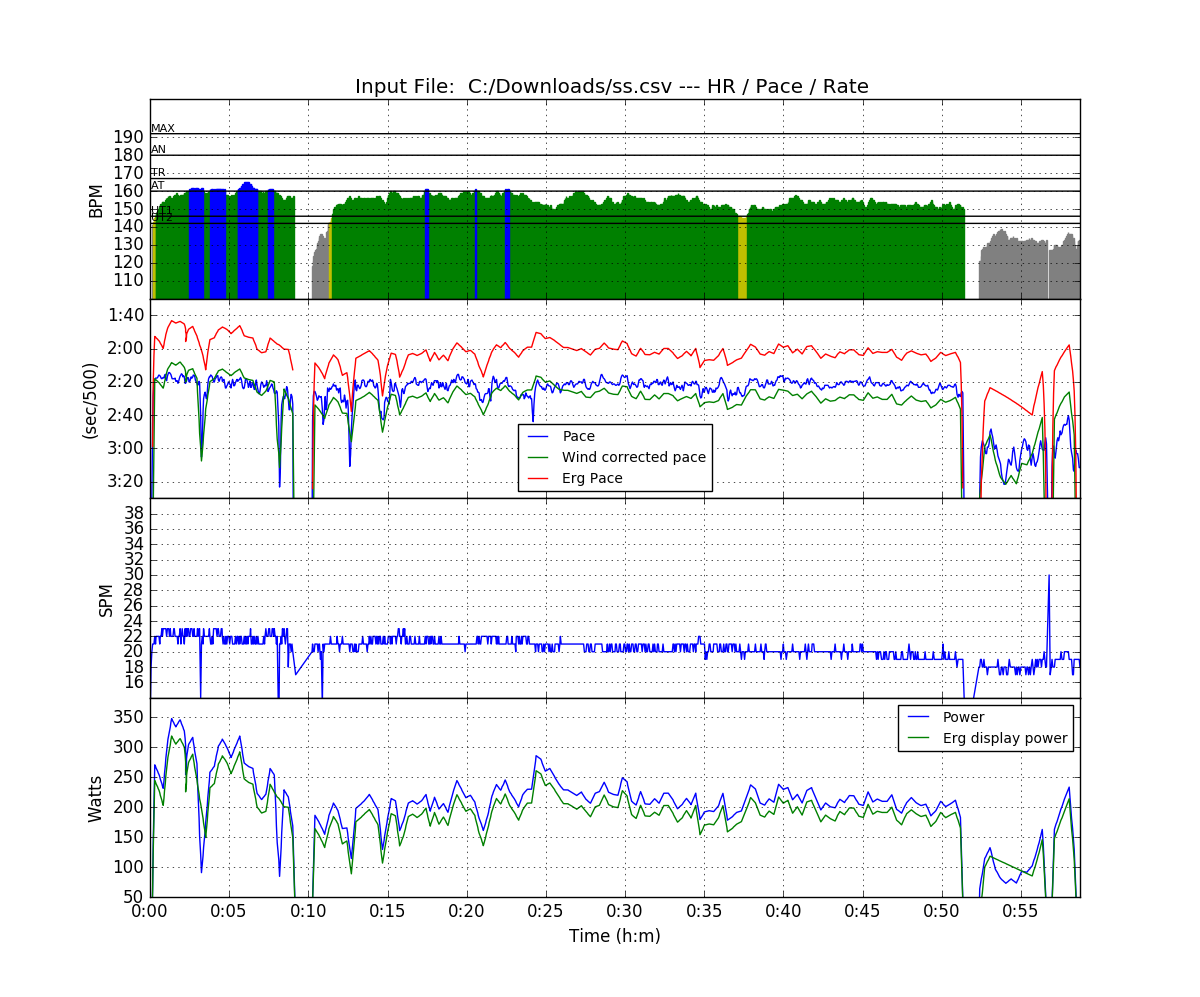
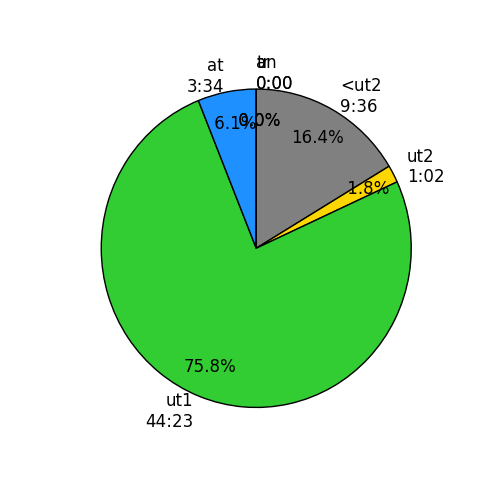
My parents are visiting from the Netherlands, so training was squeezed for social reasons. On Thursday, I did a steady state session in the morning. Only 40 minutes, and because it felt very hard, at a low power. I just started rowing, following a few Wolverine Plan L4 stroke rate sequences, and stopped after 40 minutes:
Friday
Another session in the morning, to have the rest of the day for work (partly) and being a tour guide around Brno.
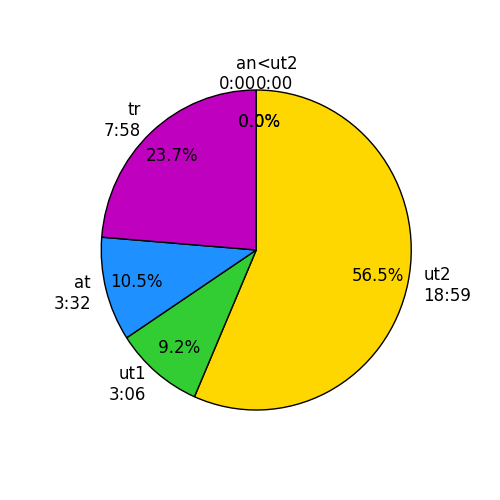
This time it was 20x1min/1min rest. In the past winter, I have done this at much faster average pace, but ok.
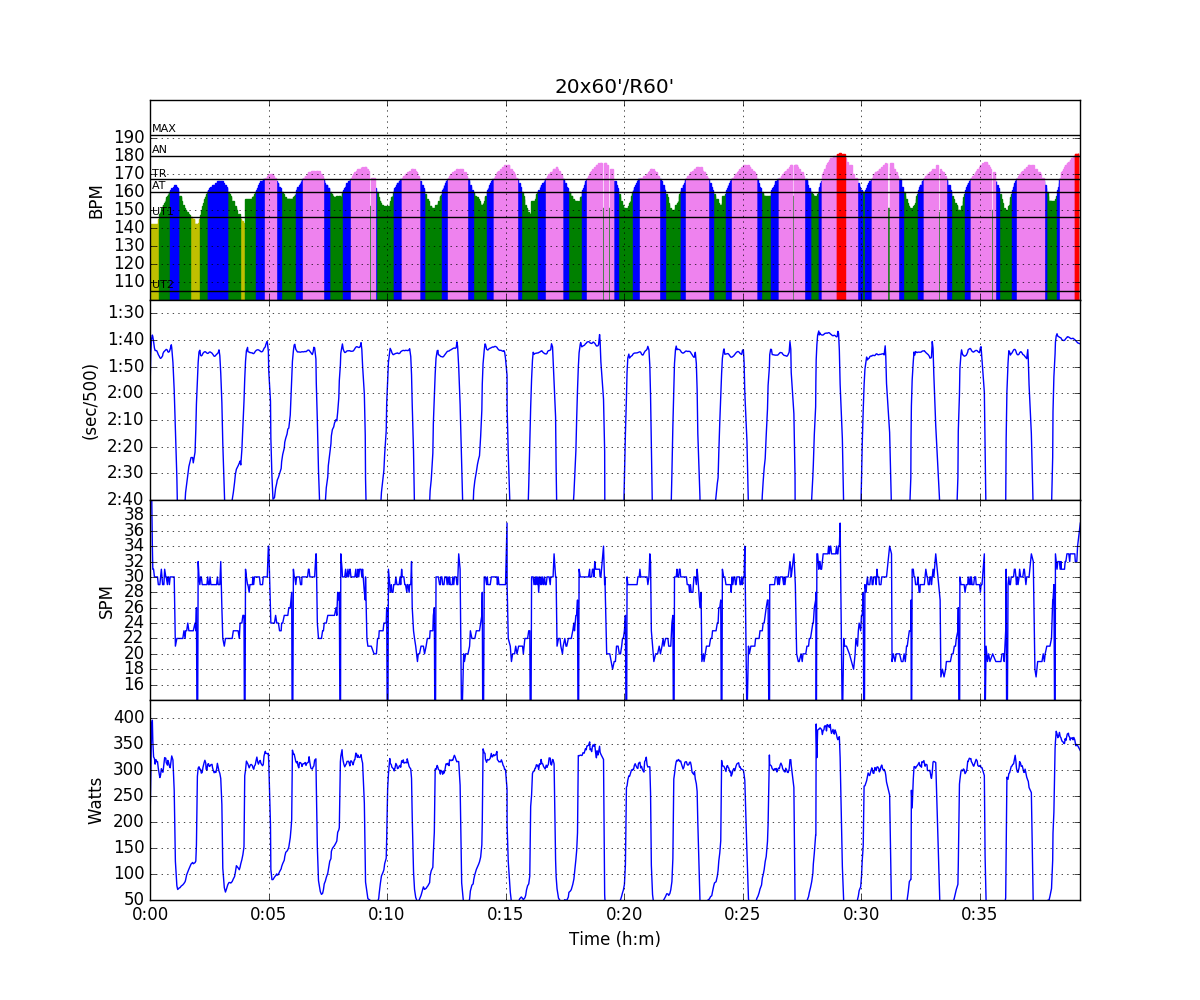
According to the PM5, I did an average pace of 1:43.6. We had a great night out at the Brno Opera theatre.


Sep 25 2016
Saturday – 2 speed Lactate test and some thinking
Time for the 2 speed lactate test again. The protocol is simple.
Then you plot the 1 minute values against power.
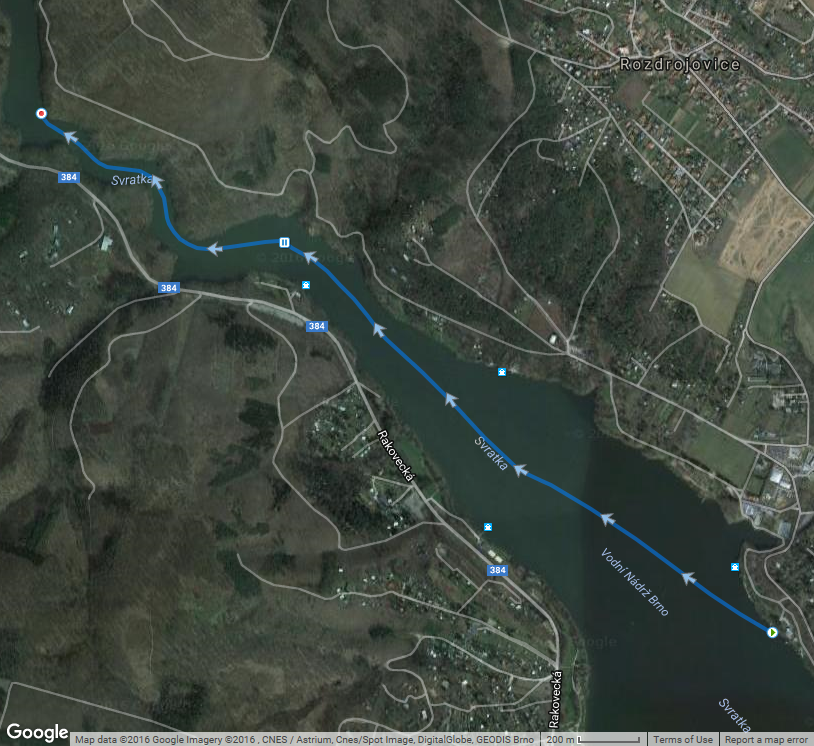
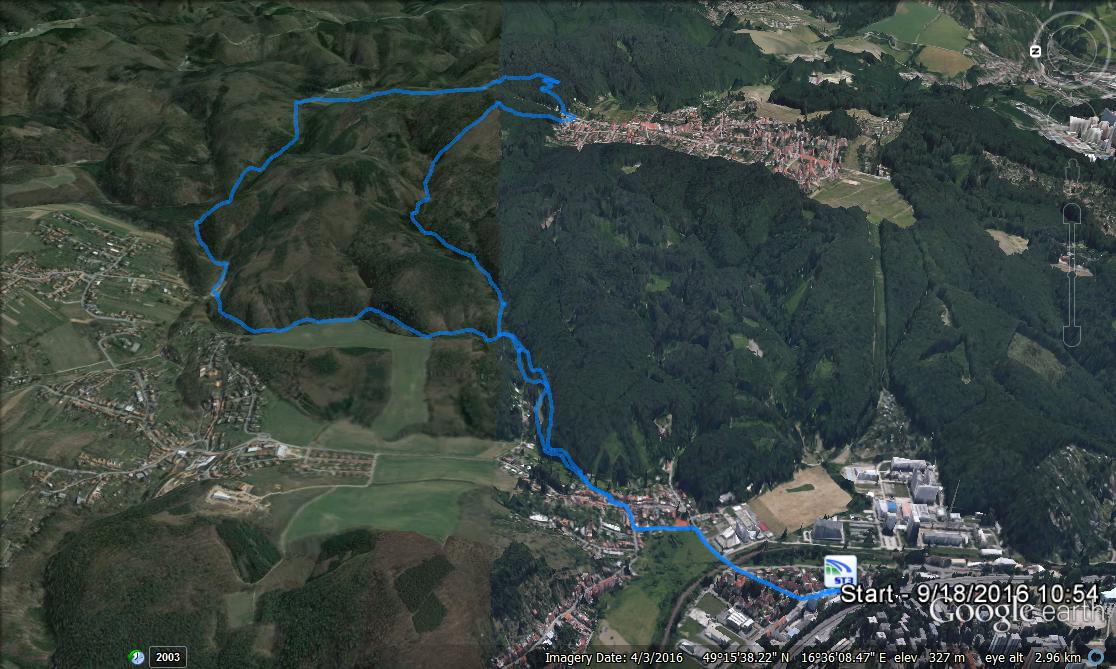
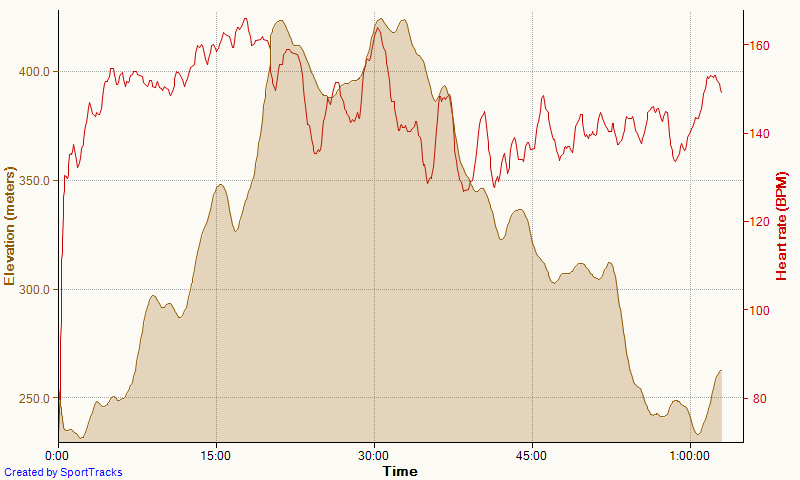
I started with a 20 minute warming up:
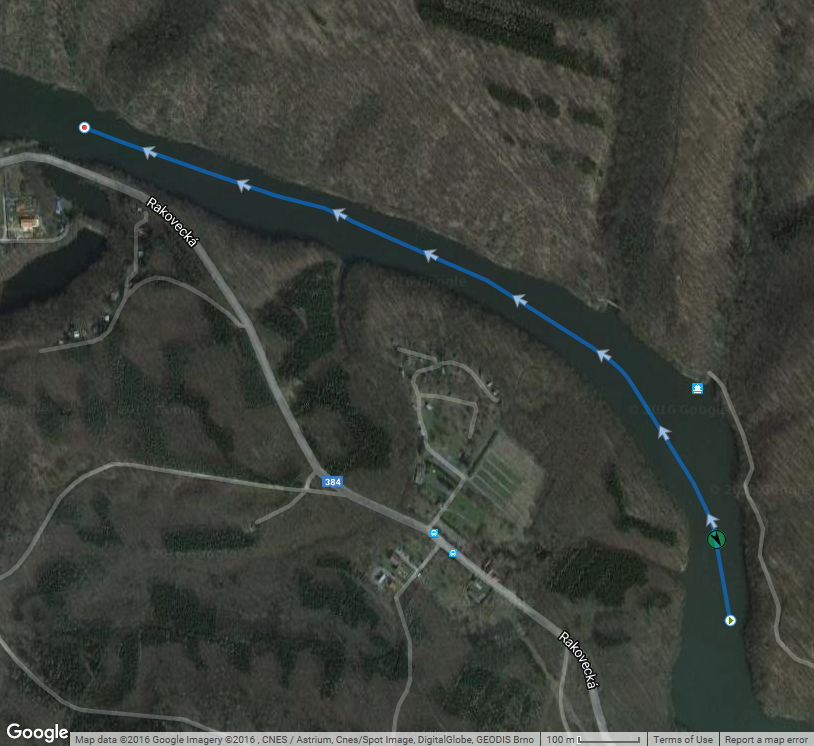
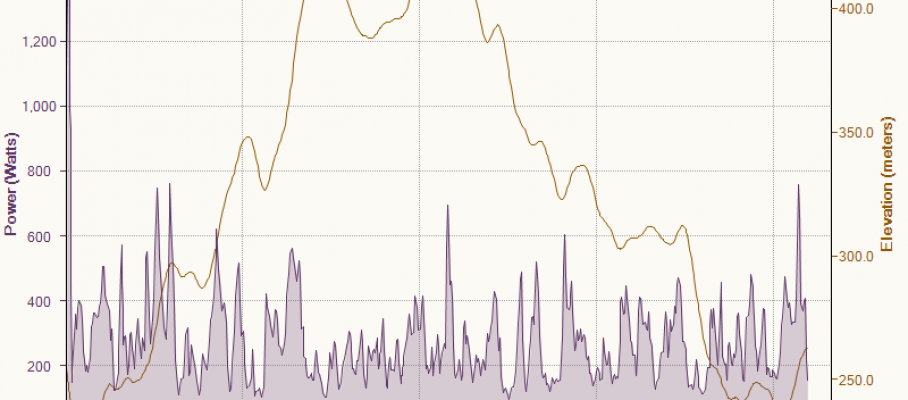
Then I did the first 1k:
Pretty evenly paced. I measured 5.4 mmol/L of lactate after 1 minute and 4.5 mmol/L after 3 minutes. I paddled until 15 minutes was gone, at roughly 150-160W pace.
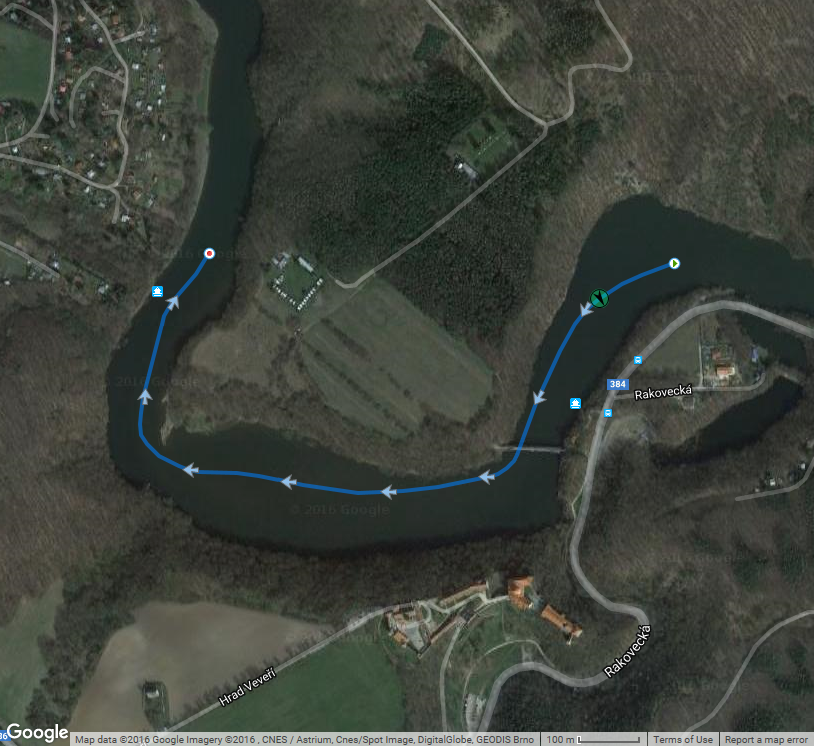
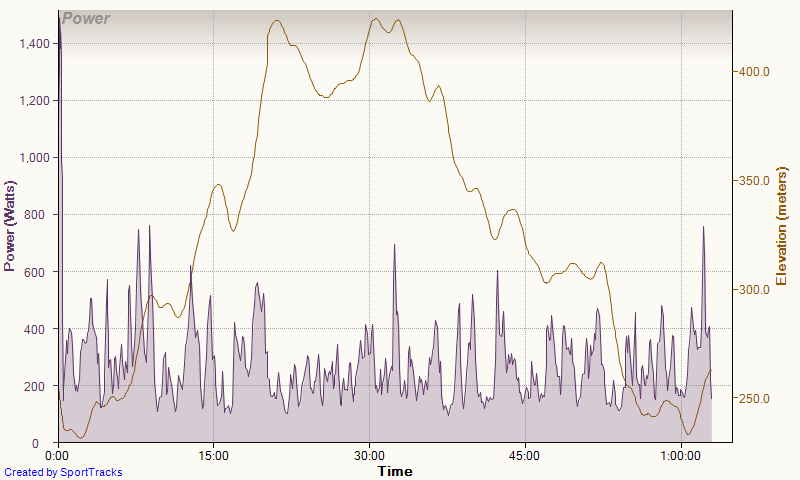
Then I did the second 1k:
I knew this wasn’t going to be a very fast 1k, so after 10 hard strokes at the start, I settled for 300W, then tried to crank it up with 500m to go.
So here is the result (lactate in mmol/L).
The droplet of blood after 1 minute after the full out 1k was a little smaller than normal. I think the measurement was OK. It seems the lactate concentration in the muscle was just much higher and it took time to flush out the lactate. This would explain the higher value after 3 minutes.
Here is the graph of all 2 speed tests I had done in the past 12 months:
The chart looks like a game of Mikado (or pick-up sticks) and it is hard to understand what is going on. I have been rereading on Lactate, especially this article. I picked up my old simple numerical model and tried to model the recent three series of lactate step tests I did in September.
Not an ideal fit but it is interesting to look at the parameters.
Pthreshold is the threshold Power. The parameter “beta” is a parameter which governs lactate usage as fuel in the aerobic pathway (higher values mean more lactate can be used as fuel during aerobic exercise). “C_La_rest” is the rest value of lactate (which I measured today), and “V_La_max” is a parameter which governs how fast lactate is produced once you are above the threshold. So the hypothesis is that my threshold power has shifted to the left (bad), but I am better at burning lactate during aerobic exercise. At the same time, I have become better at producing a lot of lactate when above the threshold.
The model should be taken with a very big grain of salt. It’s all very crude and simplified at the moment. Take it as an illustration of my current understanding of lactate “science”. Instead of looking at individual test results, you have to build a model of how blood lactate is generated and used. In “Olbrecht” language, my Aerobic Capacity has slightly decreased, but my Anaerobic Capacity has improved a lot.
Now, if I knew what that means in terms of race performance, and how to use the result to fine tune my training plan … that would be great.
By sanderroosendaal • Uncategorized • 0 • Tags: lactate, lactate testing, OTE, rowing, training