Rowsandall
Training diary and random remarks around my rowing
RSS
  • Home
  • Season’s Bests
  • Wolverine Scores 2015/16
  • About
  • OTW
  • OTE
  • testing
  • Privacy Policy
myimage (37)

Feb 6 2017

Short Recovery Row

Nothing special to report. The training plan said “40 minutes bike or running” but cycling or running in the dark and on the melting snow is not really what I fancied.

It was clear that I wasn’t going to row really hard or long. I want this to be a light week after the intensive cross-country skiing. Also, I felt that I needed another light day. Tomorrow’s session looks quite “interesting”.


Workout Summary - media/20170206-1915180o.csv
--|Total|-Total-|--Avg--|-Avg-|Avg-|-Avg-|-Max-|-Avg
--|Dist-|-Time--|-Pace--|-Pwr-|SPM-|-HR--|-HR--|-DPS
--|08140|35:37.0|02:11.3|161.3|19.3|142.1|158.0|11.9
W-|07046|30:00.0|02:07.7|167.6|19.4|141.6|158.0|12.1
R-|01097|05:37.0|02:33.7|118.9|18.1|143.7|158.0|11.6
Workout Details
#-|SDist|-Split-|-SPace-|-Pwr-|SPM-|AvgHR|MaxHR|DPS-
00|03284|14:00.0|02:07.9|166.6|19.3|133.4|148.0|12.1
01|03304|14:00.0|02:07.1|170.2|19.6|150.0|158.0|12.0
02|00458|02:00.0|02:11.0|156.5|19.1|139.7|150.0|12.0

Wanted to do 45 minutes but stopped after 35.

By sanderroosendaal • Uncategorized • 1 • Tags: erg, OTE, recovery, rowing, training

stravafitness

Feb 5 2017

Using Fitness, Fatigue and Training Load graphs

Over on RowingMusings (read that blog!), a recent post discussed Stravistix, a Chrome plugin to add some stats to Strava. The most interesting add-on is a Fitness & Fatigue graph, based on the TRIMP measure of your training load.

SportTracks and TrainingPeaks also have something similar implemented. The PC version of SportTracks has a plugin that does the same. When you are a Masters rower who trains regularly, it is very helpful to monitor graphs of Fitness, Fatigue, and Training Load.

The principle of these metrics is quite straightforward.

  1. For each session calculate a “Training Impact” Number. This “suffer score” (or Training Stress Score) is one number that indicates how hard the training was. There are various ways to calculate such a number. It is basically a weighted average of training intensity over the time. Various proxies are available for training intensity: Power, Speed, Heart Rate.
  2. From the training impact, calculate “Chronical Training Load” (CTL) and “Acute Training Load” (ATL). Both are usually exponentially weighted average of the Training Impact. The CTL averages over a long period (42 days typicall) while the ATL averages over a short period (7 days)
  3. Calculate the Training Stress Balance (TSB) which is the difference between CTL and ATL. As your CTL represents your Fitness and your ATL represents your Fatigue (the opposite of Freshness), the TSB represents “Form” (Fitness+Freshness).

I think this is a great way to help you monitor overtraining and detect stagnating fitness. But you have to know how to interpret the graphs.

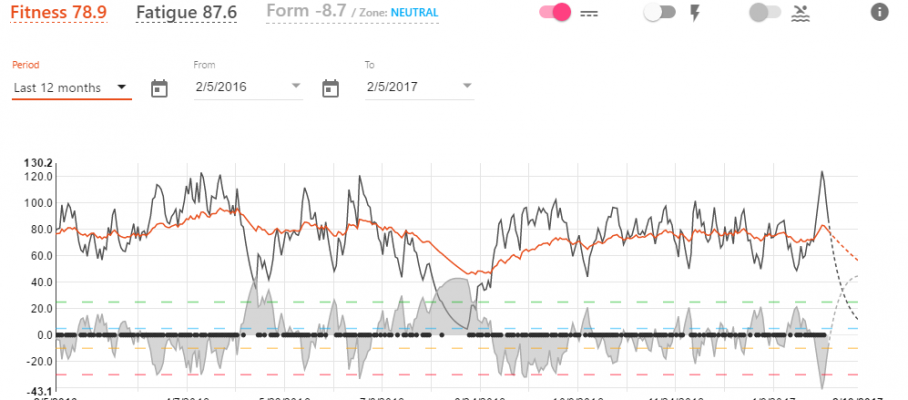
Here are example graphs from my training diary. I keep all my data on Strava, SportTracks (PC) and SportTracks.mobi, so it is easy for me to compare:

Fitness graph in Strava
Fitness graph on sporttracks.mobi
Fitness graph on SportTracks (PC)

I use the standard out-of-the-box values for all parameters used in the calculations. So do these graphs tell the same story? All of them show roughly the past 12 months of training. Somewhere in March 2016, I switched from erg based training to boat training. I tried to peak for races in mid July and early August. Then I took a vacation with low training intensity, which was great for mental recovery from the racing season. In September, I resumed training for a head race in October, and then on to the winter erg training from November onward.

Looking at “Form”, SportTracks (PC) puts my best form (highest TSB) in the middle of my vacation. Sporttracks.mobi (the Performance graph on the right) shows three peaks, and then seems to suggest that I greatly reduced training intensity (and thus form) after the vacation. Strava has a Form peak in May and a peak in the middle of my vacation.

Regarding fitness, the PC version of SportTracks and of Strava come much closer to my gut feeling, but SportTracks.mobi seems to be more in line with my erg scores. The main difference seems to be that the SportTracks.mobi has a much shorter time period to measure CTL. On this site, you get fit faster, but when you reduce the training load, your fitness drops almost immediately. This seems to give a better representation of what happened during my vacation.

I think the truth is somewhere in the middle.

The book Training and Racing with a Power Meter gives some good advice about using the Fitness graphs. One of the observations in the book is that athletes show their best performance when TSB turns positive, but not overly, especially for shorter duration events with a larger anaerobic contribution (think 1km sprint racing for Masters rowers).

So while a positive TSB value is an indication of good form, a higher positive value does not necessarily mean better form. All this is quite interesting stuff to think about when you plan your taper for an important race.

In my experience, how I feel is more related to relative changes in the graphs than in the absolute values. For example, today, after one day of full rest after a very intensive week of cross-country skiing, I still feel highly fatigued. My fatigue scores are roughly equal to the values that I had during the entire period of April to July, but I am sure I am more fatigued now and I badly need a “light” week. Looking at the graphs, I see a very steep growth of both CTL and ATL as a result of last week. I expect to fully recover in a few days of rest and light exercise. This doesn’t mean my TSB value will be positive, but it is going in the right direction.
By sanderroosendaal • Uncategorized • 8 • Tags: fatigue, fitness, rowing, training, TSB

IMG_1281

Feb 4 2017

A great week in the mountains

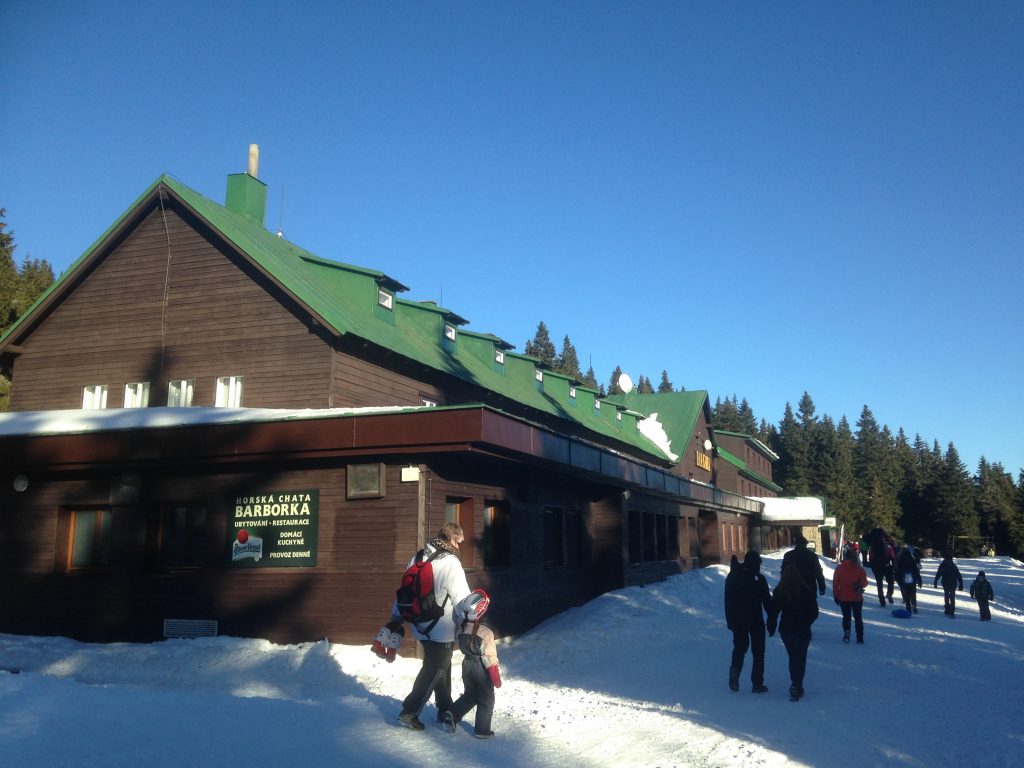
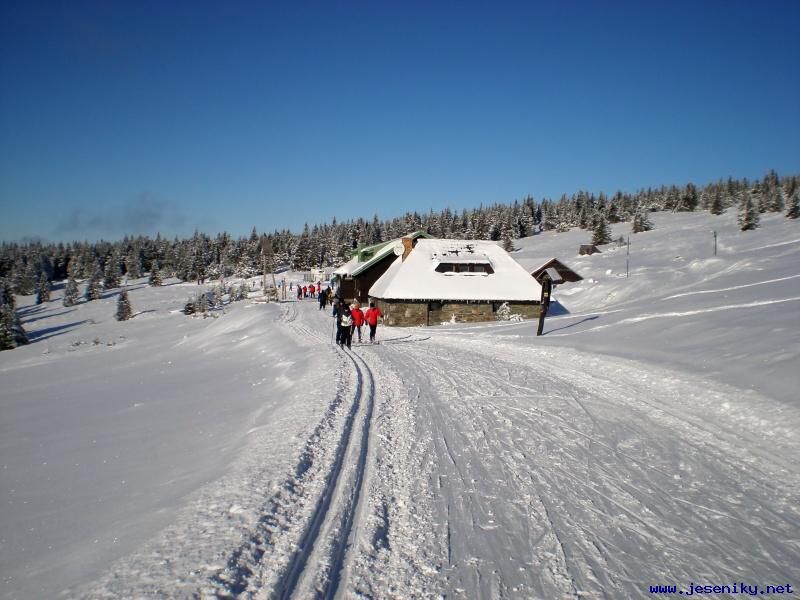
That was a great week. Romana organized the cross-country skiing training week in the Jesenik mountains. On Sunday, a bus picked us up in Brno, brought us to Ovčárna and from there we hiked 1.5 km to our mountain hut Barborka:

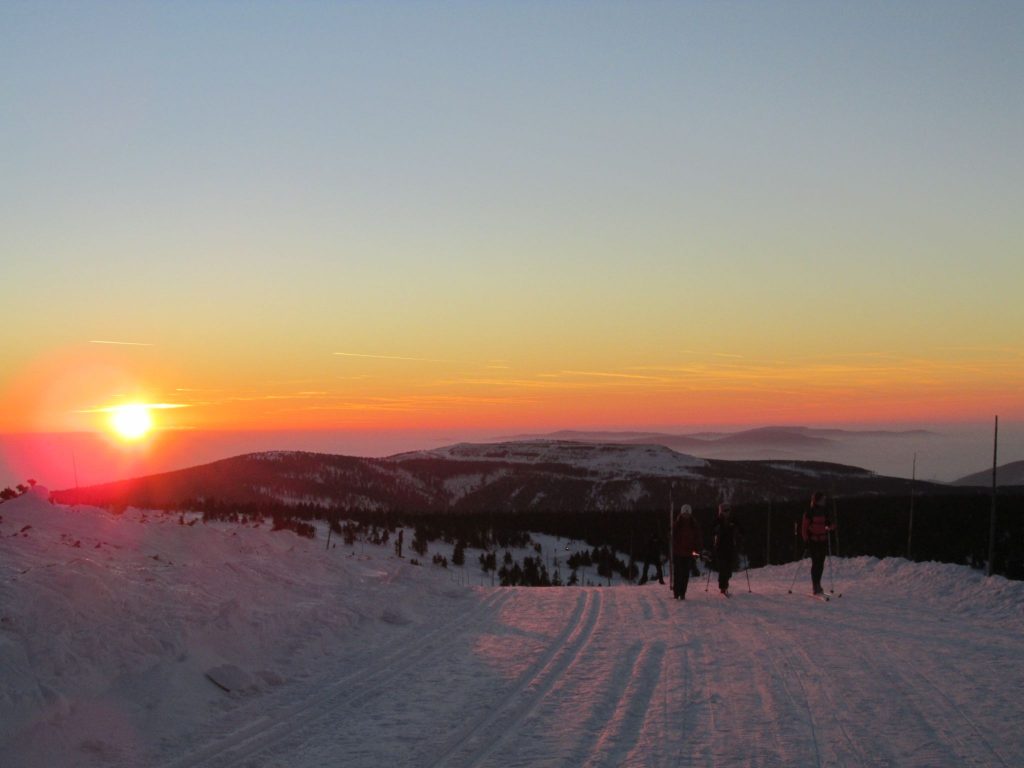
Just before sunset, we managed our first cross country run.

Here are a few pictures I shot:

This slideshow requires JavaScript.

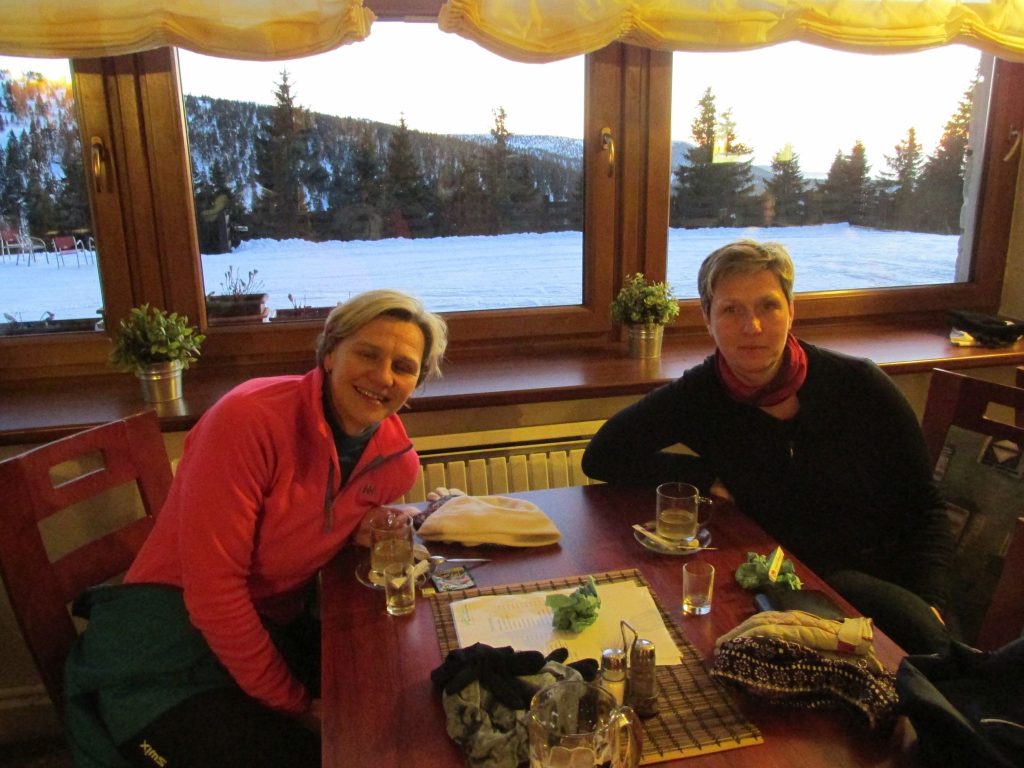
After that, I took a picture of the sun setting and we had a drink at another mountain hut:

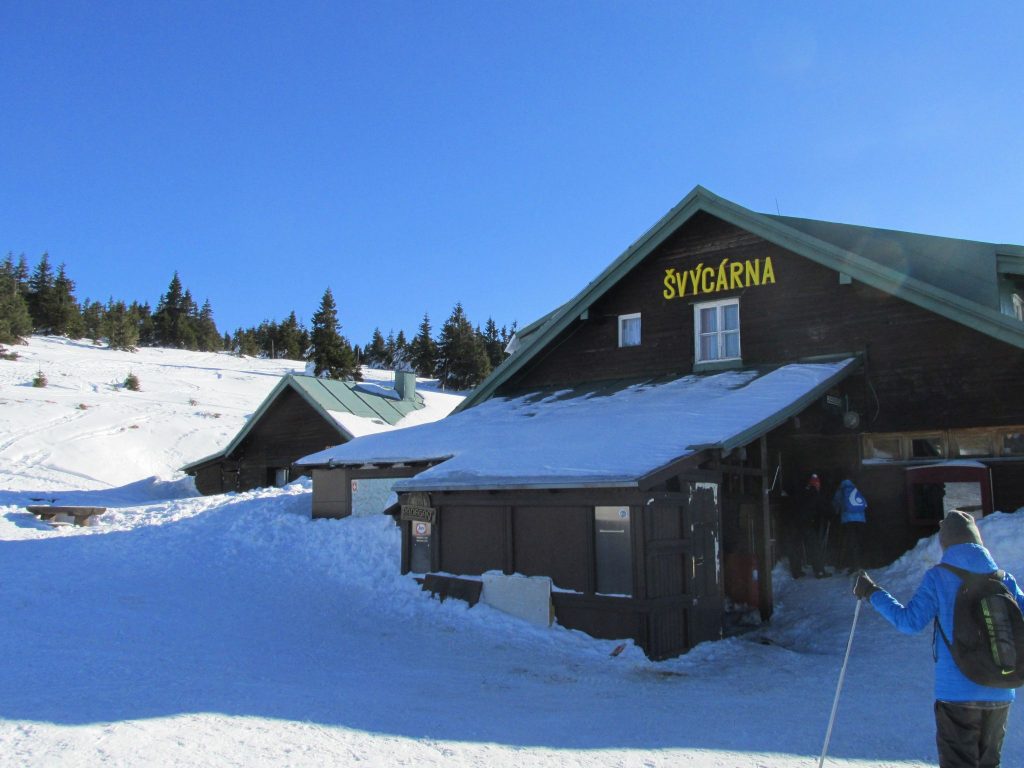
On Monday morning, we did a XC ski run to Svycarna:

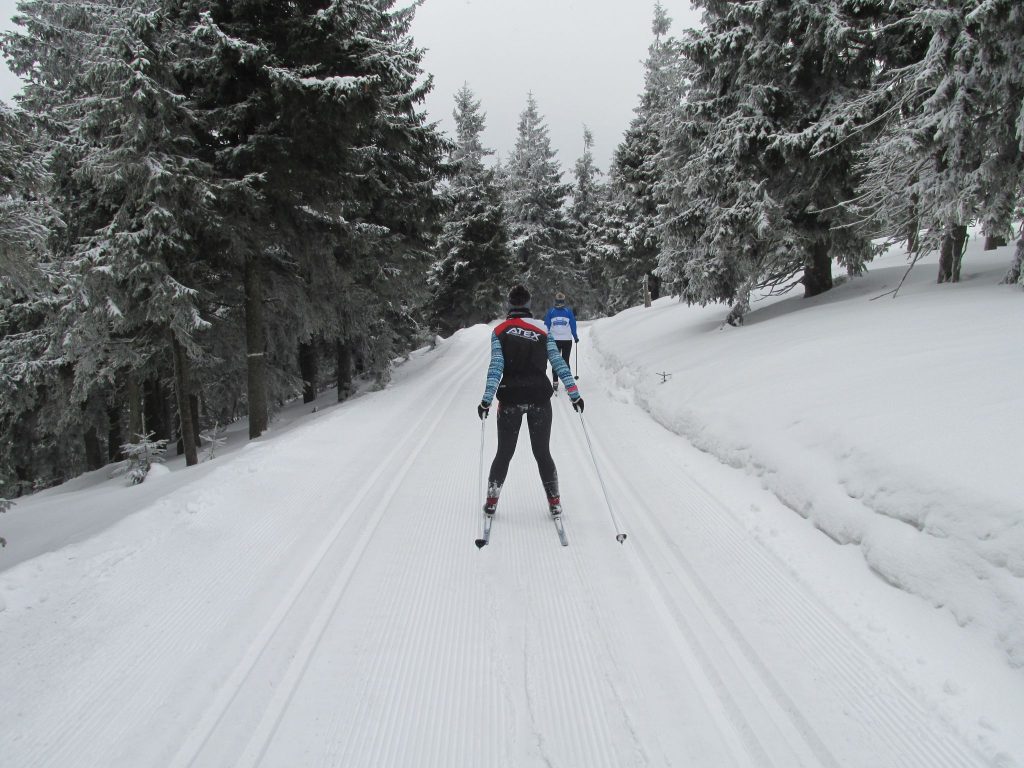
In the afternoon, we hit the training loops close to our hut:

On Tuesday, the sunny weather was gone. It was snowing hard. We decided to stay close to the hut and hit the training loops again:

After lunch, I ran to Svycarna and back in heavy snowfall:

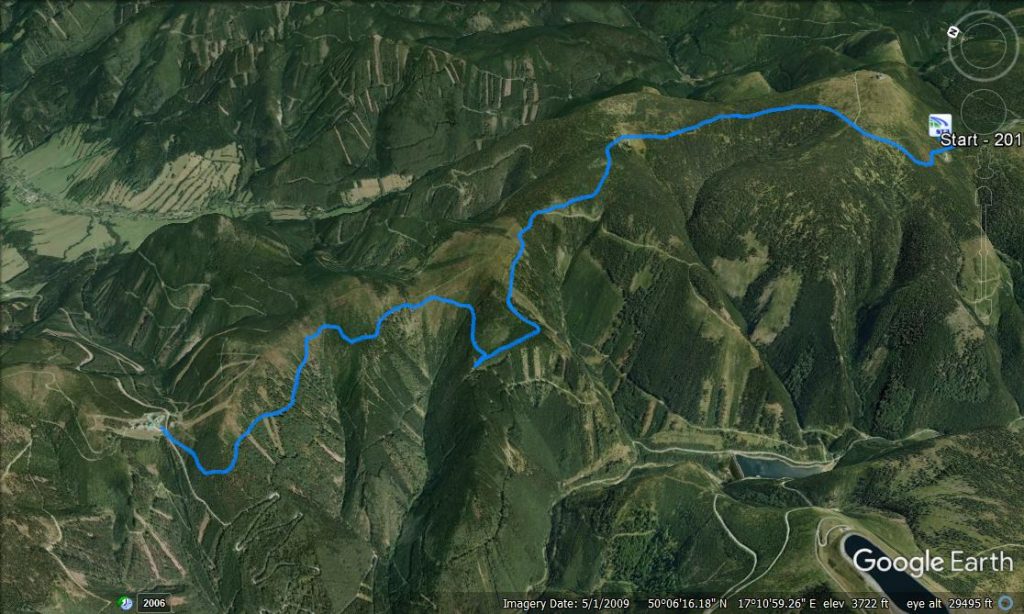
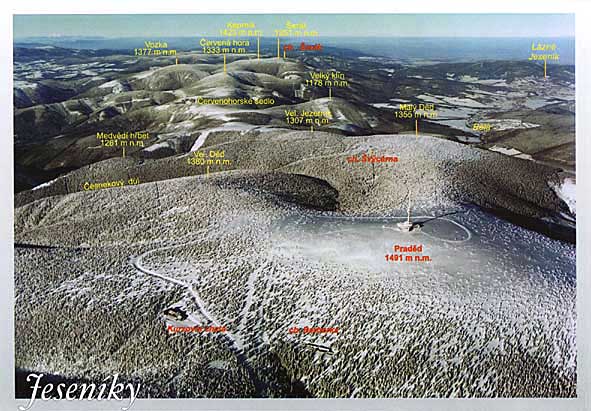
On Wednesday the weather started to turn good and I took the three most experienced girls on a long tour, to the Cervenohorske Sedlo (“Red Mountain Saddle”, a mountain pass and hotel).

We were lucky. At Svycarna we met the snow groomer and we had freshly groomed trails all the way to the Saddle pass:

In the afternoon, we didn’t do a training, but we hiked back to the bus stop and visited the nearby village. Very nice woodenn mountain architecture:

This slideshow requires JavaScript.

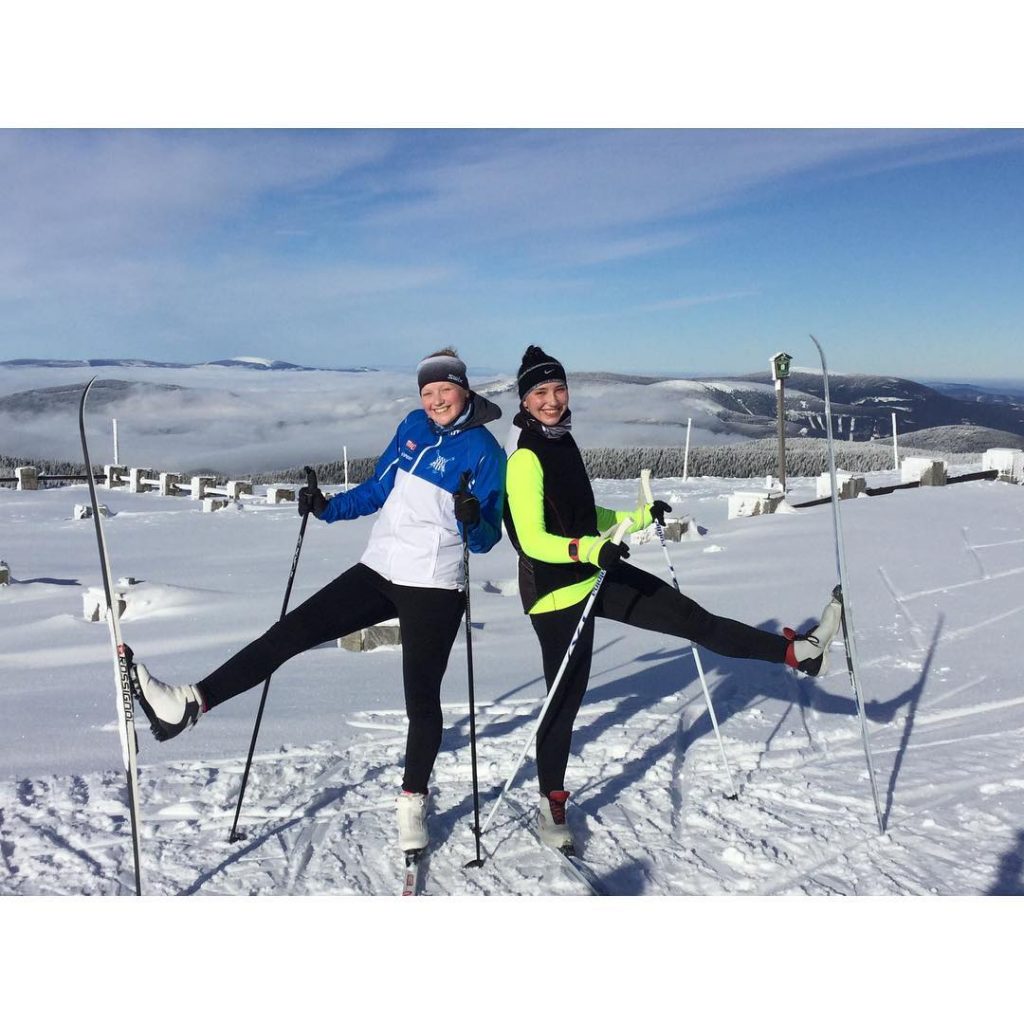
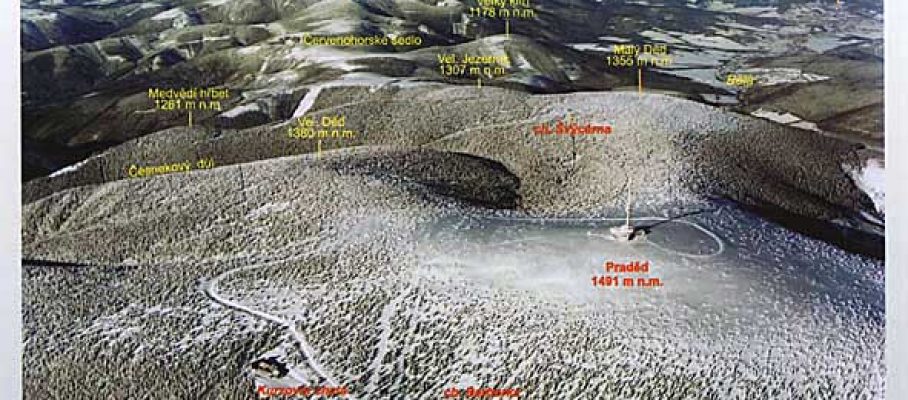
On Thursday, the beautiful weather had returned. We decided to ski up Praded mountain. The girls took the elevator to the top floor of the TV tower and enjoyed the view. I did a few more km by skiing to Kamzik and back.

I took many pictures when we climbed up to the TV tower on Praded mountain:

This slideshow requires JavaScript.

In the afternoon, we were back on the training loops and did the 5k loop twice. By this time, I was already pretty tired, and my daughter Lenka skated away from me in the second loop and there was nothing I could do. Let’s say I let her win to boost her confidence, but to be honest I am not sure about it.

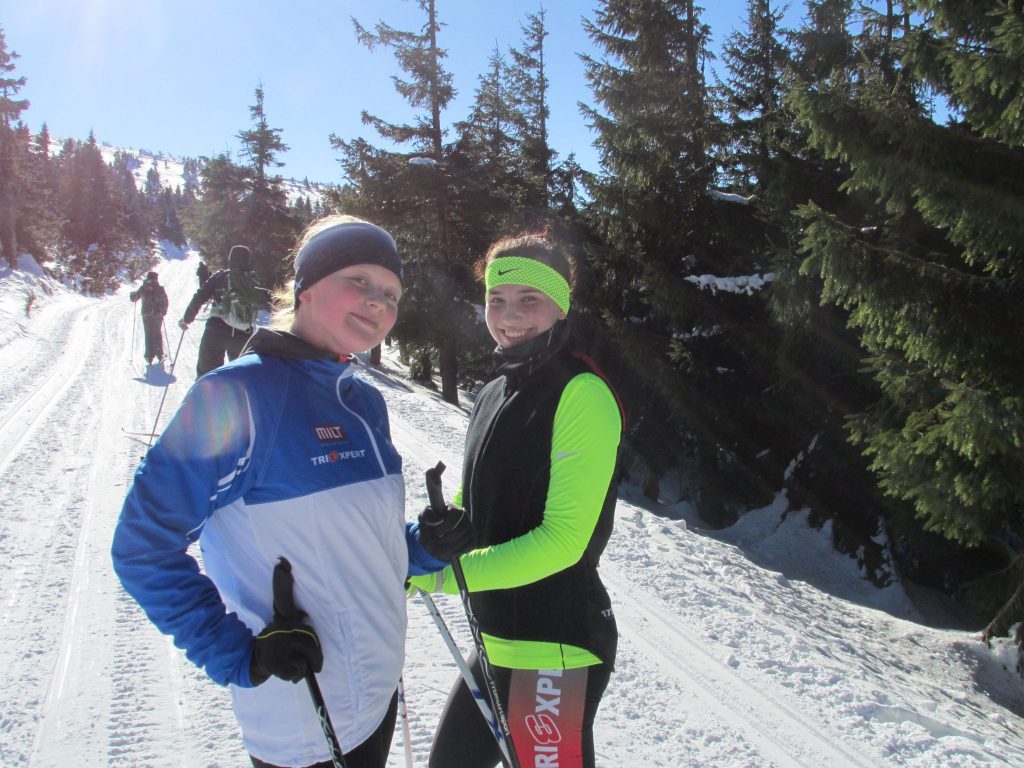
Actually, all the girls had by now made tremendous progress in their cross-country skiing. Romana taught them some technique, a few different styles, and they were all enjoying themselves.

On Friday morning, I took a very easy run to Svycarna, where we had coffee. On the way back, my son Dominik was getting the hang of the skating technique (on thawing, icy trails), and I did a sort of interval training, running up the hill until I caught up with Radka, the lady who was accompanying us, then going downhill back to Dominik who was struggling but not giving up, turning around, and repeat.

In the afternoon, we organized XC team races. Each team consisted of three athletes, and each of them would run 2 loops of 2km, 4km in total, 12km per team. During the coffee break at Svycarna, we had carefully arranged the teams in such a way that all had a chance to win. Here are the pictures from the race:

This slideshow requires JavaScript.

My job was to measure the times. At the end, I did the 4k myself. My time was 15 minutes and 52 seconds.

This morning we packed and hiked back to the road. A two hour coach ride later we were back in Brno. From the sunny mountains to a smoggy Brno, with just the memories of a nice stay in the mountains:

Today: Rest.
Tomorro: Rest & Sauna.

By sanderroosendaal • Uncategorized • 3 • Tags: mountains, rowing, ski, training, XC

Image uploaded from iOS

Jan 28 2017

I must be doing something wrong

So the Masters rowers of our club want to go to the Masters Worlds in Bled this year, and I am one of the guys who has been urging everyone to train hard this winter. I even put up a list on the notice board where people are supposed to write their 6k and 2k erg scores (fall, spring and summer values).

Today, there is an erg race in Pardubice, where I was supposed to compete. However, our boys have been sick. They are recovered now, but we decided that it is better I stay at home with them, a day before we go to the mountains.

The instructions of our coach were clear: “Masters compete in Pardubice. Who cannot make it, rows a 2k on Saturday and sends me the score.”

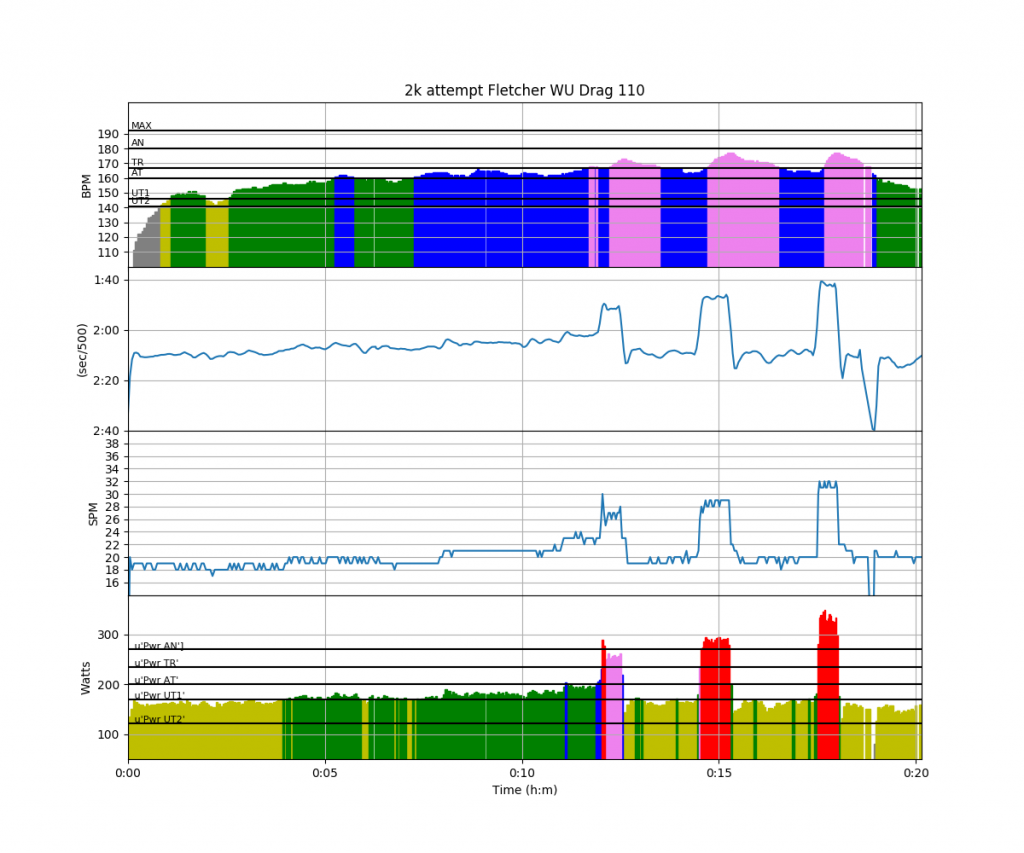
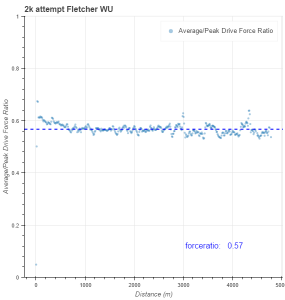
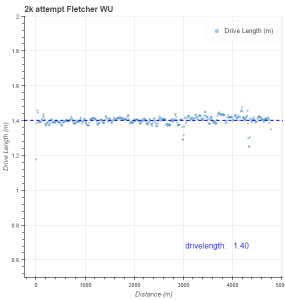
So at the end of the morning I headed down to the basement and started doing the Fletcher warming up for 1:44 pace. I thought I was in shape for a PB attempt. Actually, I had difficulty not going faster than the paces prescribed by Fletcher, at his prescribed rates. Here is the warming up:


Workout Summary - media/20170128-1025200o.csv
--|Total|-Total-|--Avg--|-Avg-|Avg-|-Avg-|-Max-|-Avg
--|Dist-|-Time--|-Pace--|-Pwr-|SPM-|-HR--|-HR--|-DPS
--|04786|20:09.0|02:06.3|184.3|20.9|160.2|177.0|11.3
W-|04790|20:09.0|02:06.2|179.6|20.6|159.6|177.0|11.7
R-|00000|00:00.0|00:00.0|000.0|00.0|000.0|177.0|00.0
Workout Details
#-|SDist|-Split-|-SPace-|-Pwr-|SPM-|AvgHR|MaxHR|DPS-
00|00932|04:00.0|02:08.8|161.1|18.3|140.1|157.0|12.8 "18spm 2:11"
01|00949|04:00.0|02:06.4|173.3|19.3|159.2|164.0|12.3 "20spm 2:07"
02|00724|03:00.0|02:04.3|181.7|21.0|162.9|166.0|11.5 "22spm 2:05"
03|00248|01:00.0|02:01.2|196.2|23.0|165.5|168.0|10.8 "24spm 2:03"
04|00136|00:30.0|01:50.5|257.3|26.8|168.1|172.0|10.1 "26-28spm 1:52"
05|00467|02:00.0|02:08.6|167.9|19.9|167.9|173.0|11.7 "18spm 2:11"
06|00211|00:45.0|01:46.6|285.4|28.4|171.0|177.0|09.9 "28-30spm 1:47"
07|00523|02:15.0|02:09.0|165.3|20.0|169.0|177.0|11.6 "18spm 2:11"
08|00147|00:30.0|01:41.9|330.6|31.3|171.0|177.0|09.4 "30-34spm 1:41"
09|00454|02:09.2|02:22.3|151.2|20.1|162.9|177.0|10.5 "18spm 2:11"

In the last interval, my son came down to ask me something, so I stopped and answered.

And here are the metrics charts:

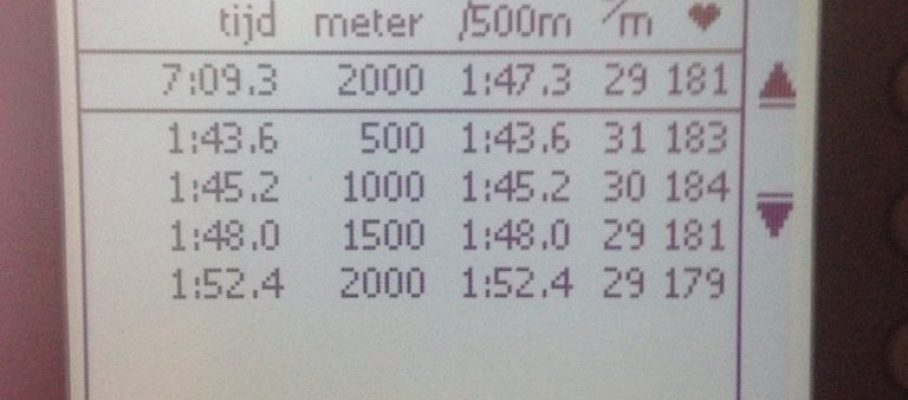
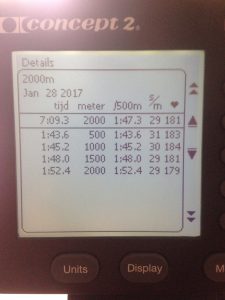
Then I did some stretching and set up the PM for a 2000m. Here are the stats:


Workout Summary - media/20170128-1025190o.csv
--|Total|-Total-|--Avg--|-Avg-|Avg-|-Avg-|-Max-|-Avg
--|Dist-|-Time--|-Pace--|-Pwr-|SPM-|-HR--|-HR--|-DPS
--|02000|07:08.0|01:47.0|285.6|29.9|179.8|184.0|09.4
W-|02000|07:08.0|01:47.1|284.9|29.9|179.9|184.0|09.4
R-|00000|00:00.0|00:00.0|000.0|00.0|000.0|184.0|00.0
Workout Details
#-|SDist|-Split-|-SPace-|-Pwr-|SPM-|AvgHR|MaxHR|DPS-
00|00250|00:50.5|01:41.1|322.8|31.2|164.8|178.0|09.5 - start and first 10
01|00250|00:52.3|01:44.6|306.1|30.4|180.5|183.0|09.4 - settle for 1:45 pace
02|00250|00:52.5|01:45.0|302.0|30.1|183.3|184.0|09.5 - keep 1:45
03|00250|00:52.7|01:45.4|299.6|30.2|183.6|184.0|09.4 - keep 1:45
04|00250|00:52.9|01:45.7|297.8|30.5|183.6|184.0|09.3 - power 10??
05|00250|00:55.2|01:50.3|262.3|29.2|182.3|183.0|09.3 - crisis 1
06|00250|00:54.7|01:49.4|266.7|29.6|181.1|182.0|09.3 - trying to save it
07|00250|00:57.7|01:55.5|230.6|28.5|179.5|181.0|09.1 - crisis 2

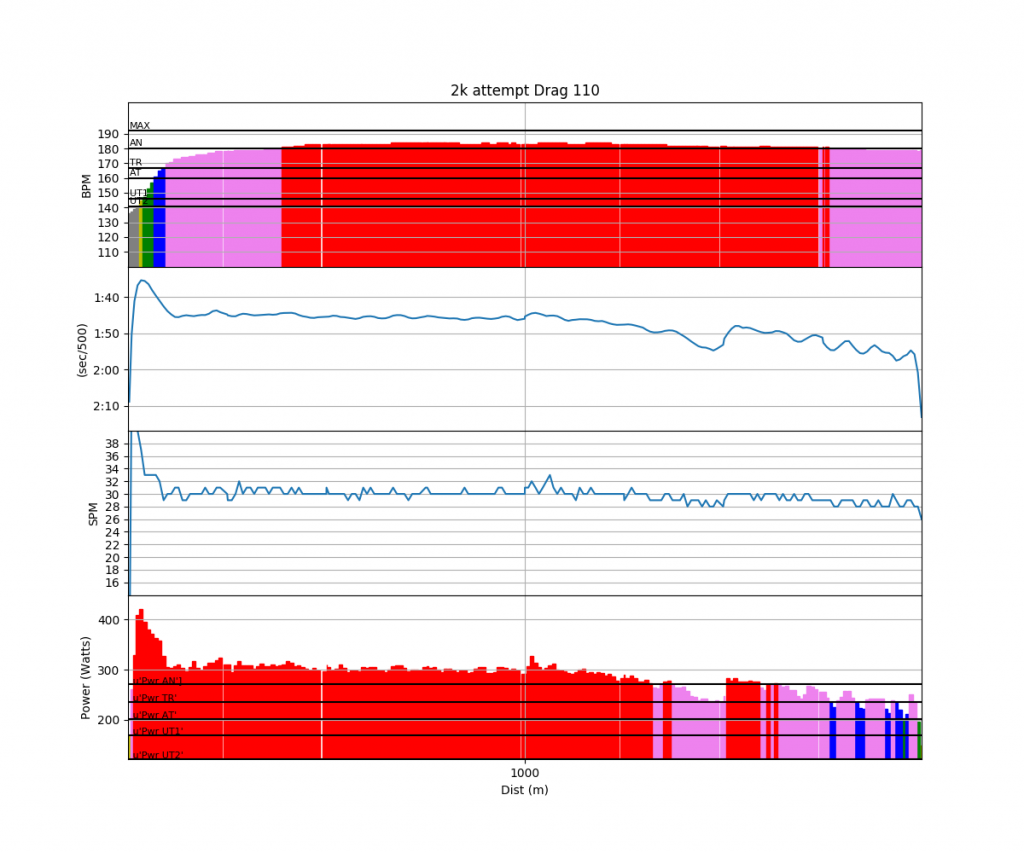
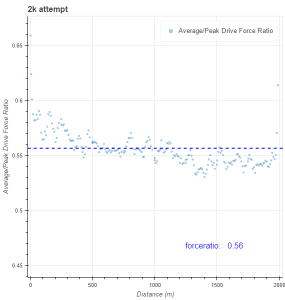
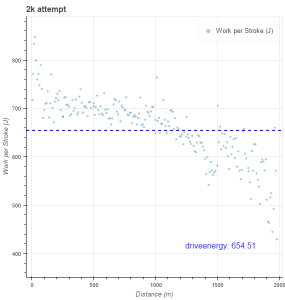
The story is simple. I set off at 1:44 pace. In the second 500m I retreated to 1:45 pace, seeing the occasional stroke at 1:46. At 1000m to go I did a power 10, hoping that would give me motivation to get through the dreaded third 500m. After the “power 10” I had difficulty finding the 1:45 pace again. Actually, pace slipped to 1:48 and I wasn’t able to react.

With 500m to go I told myself that all is not lost and with a strong final 500m I could at least set a decent time.

No way.

I sped up slightly, but that only brought me back to a terrible 1:48 pace. Then I let the pace slip back to 1:50 and worse …

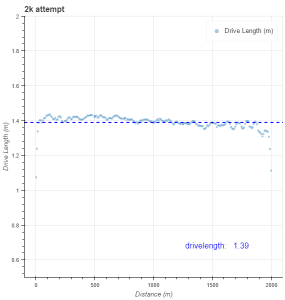
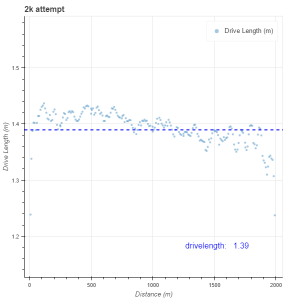
Here are the metrics charts:

After the row, I sent the score to the coach.

I guess I will not be going to Bled, unless I drastically improve something.

The problem is that I am not sure what I am doing wrong. I need to look at my training load of November and December, and compare it to the 2015/16 season. I need to find what I am doing wrong. There must be something.
By sanderroosendaal • Uncategorized • 5 • Tags: 2k, concept2, erg, OTE, rowing, test

sev_pohl

Jan 27 2017

Taper for 2k

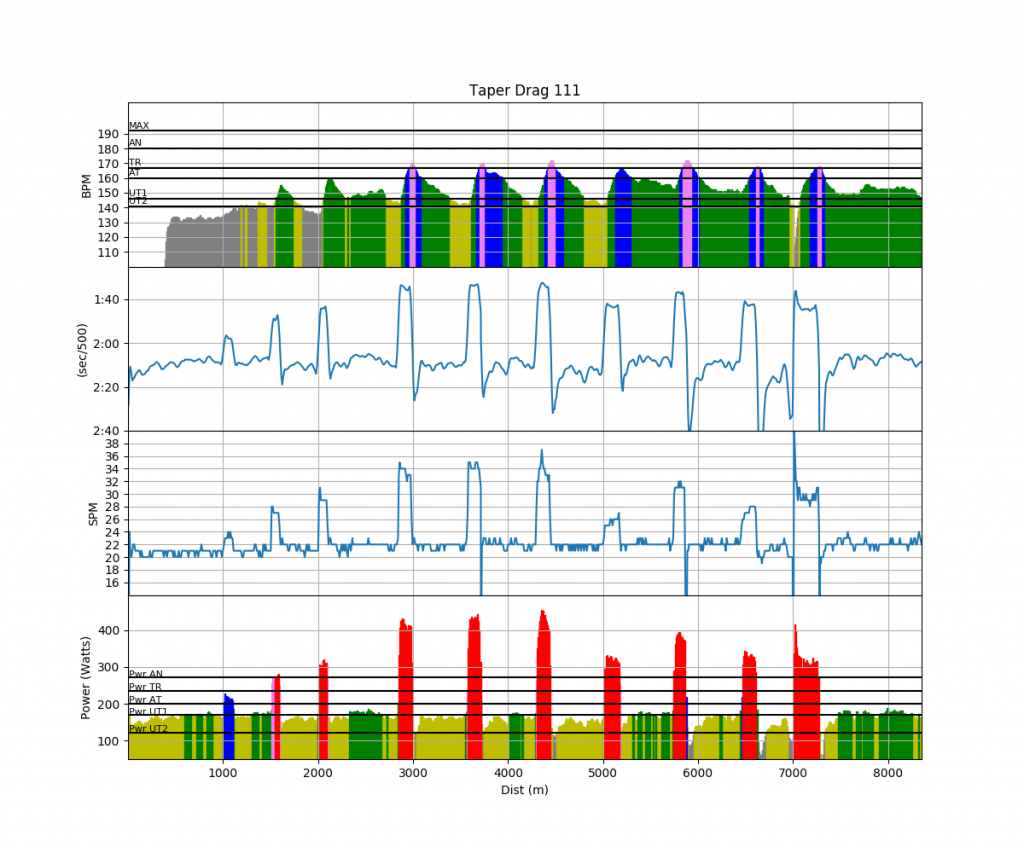
Today I did a Taper training as prescribed by our coach.

  • 3km Warming Up
  • 6 times 15 hard strokes, rest 2 to 3 minutes
  • Start+250m at 2k pace
  • Cooling Down

I wasn’t sure if the 15 hard strokes were to be done at a high stroke rate or a low stroke rate.


Workout Summary - media/20170127-1710200o.csv
--|Total|-Total-|--Avg--|-Avg-|Avg-|-Avg-|-Max-|-Avg
--|Dist-|-Time--|-Pace--|-Pwr-|SPM-|-HR--|-HR--|-DPS
--|08353|36:55.0|02:12.6|190.1|22.9|145.9|172.0|09.9
W-|08353|36:55.0|02:12.6|188.9|22.9|145.9|172.0|09.9
R-|00000|00:00.0|00:00.0|000.0|00.0|000.0|172.0|00.0
Workout Details
#-|SDist|-Split-|-SPace-|-Pwr-|SPM-|AvgHR|MaxHR|DPS-
00|07000|31:15.9|02:14.0|189.4|22.8|144.7|172.0|09.8
01|00250|00:51.4|01:42.7|319.3|29.2|148.8|167.0|10.0
02|01103|04:48.0|02:10.5|162.4|21.9|153.1|168.0|10.5

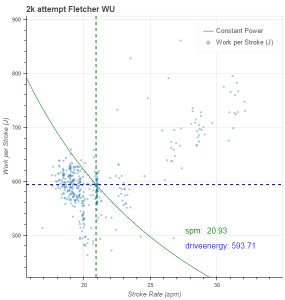
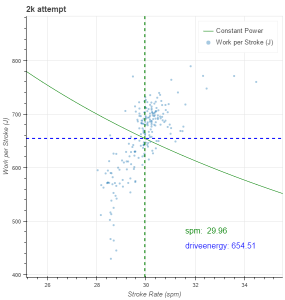
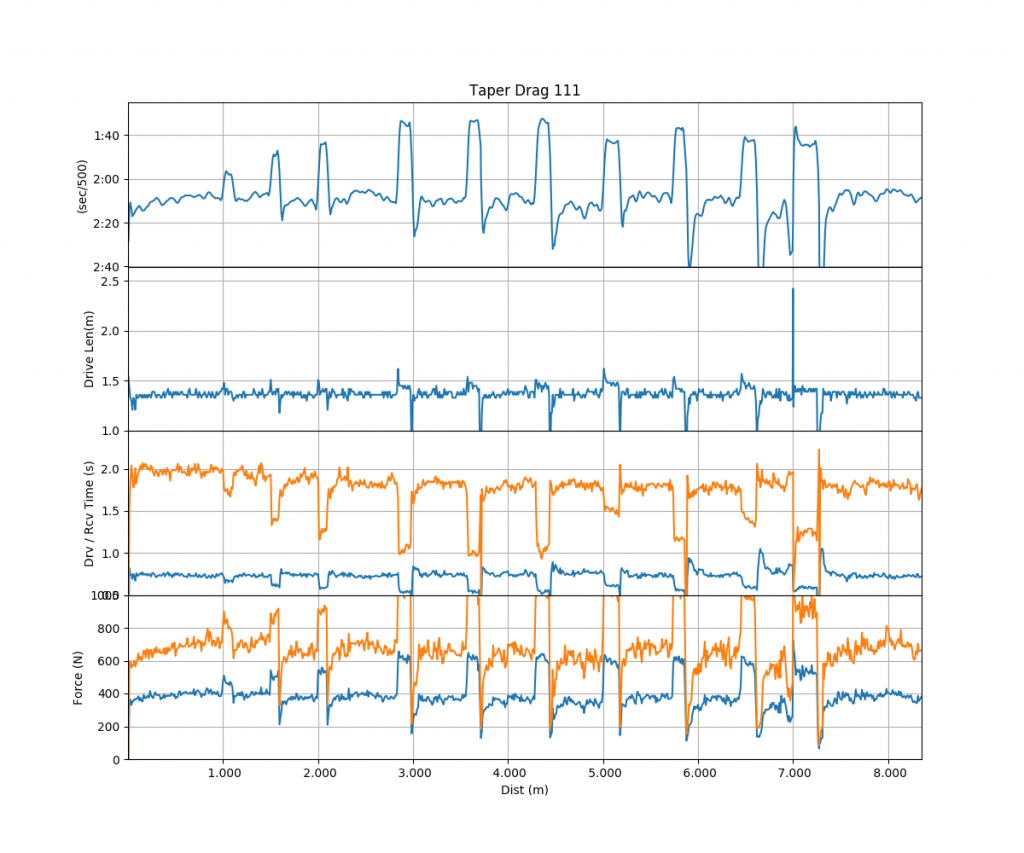
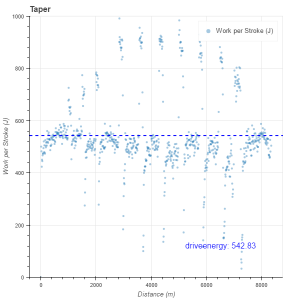
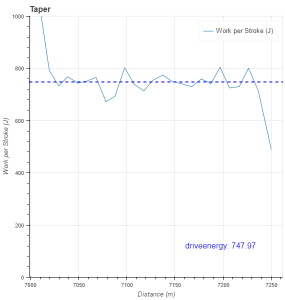
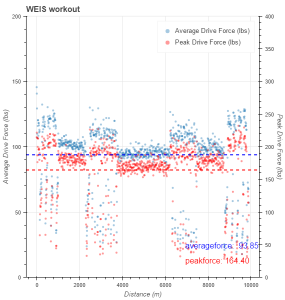
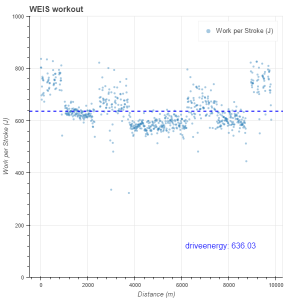
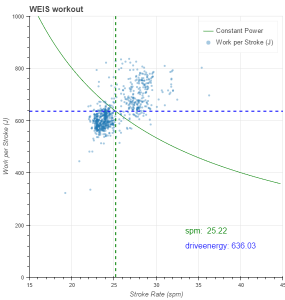
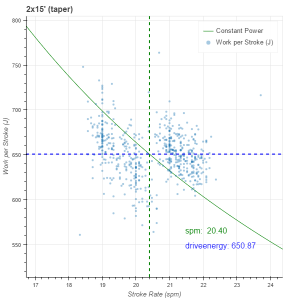
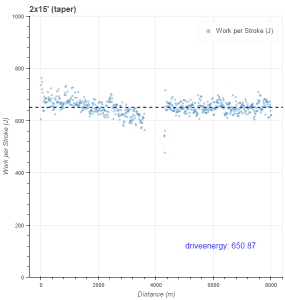
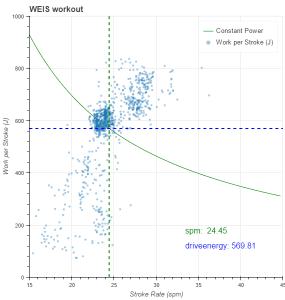
One thing that I am thinking about a lot is increasing power by stroke rate, rather than by increasing the drive force. I see that in my “power” intervals, I go substantially higher in “Work per Stroke”, which means that I increase the average drive force. A risk of doing that is that your muscle fatigue sets in earlier than aerobic fatigue (if that is a valid term). For tomorrow’s 2k, I want to rate high from the beginning (above 30spm) but keep the power checked at 1:44 pace, at least in the first 1500m.

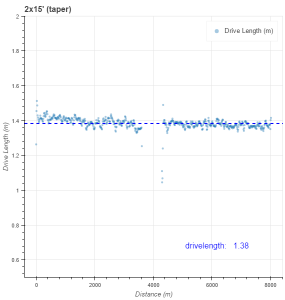
Here are the charts that show what I am doing:

Work per Stroke for entire workout
Work per Stroke during the 250m at 2k pace

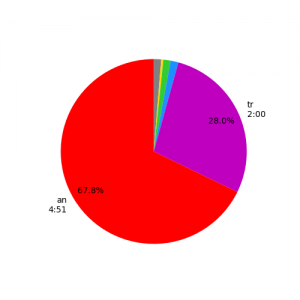
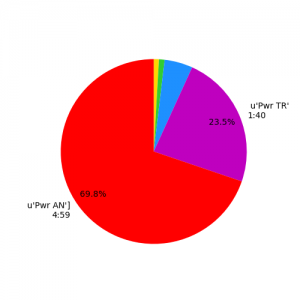
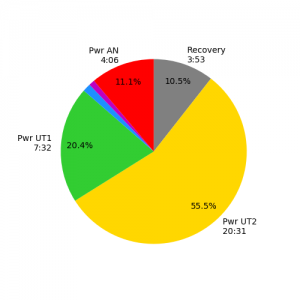
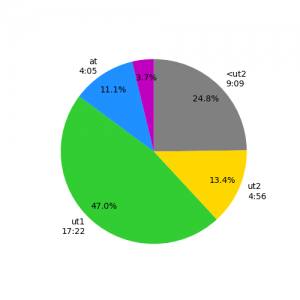
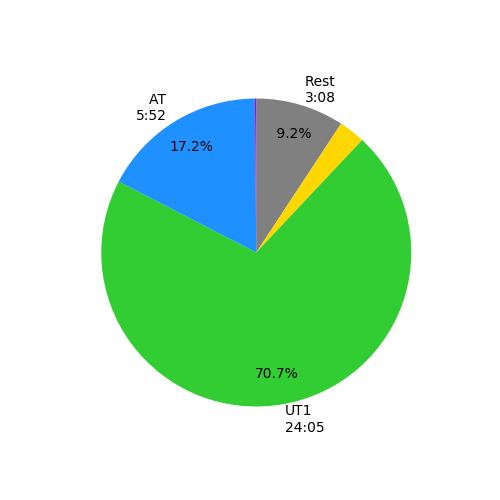
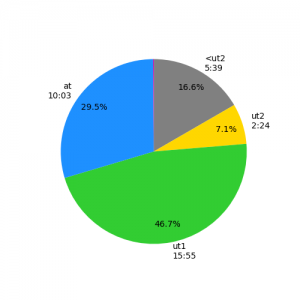
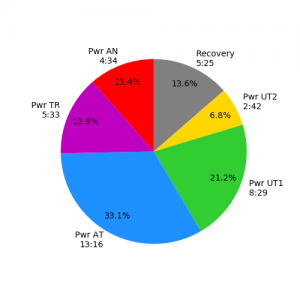
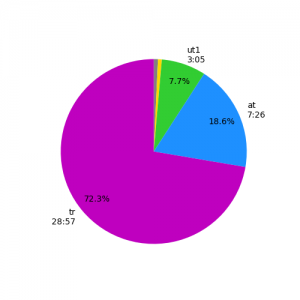
And here are the Pies:

So a 2k tomorrow, and then packing and on Sunday we’ll go to the mountains for a week of cross-country skiing:

Conditions look great: http://www.jeseniky.net/pocasi-snih#upravene-bezkarske-trasy

By sanderroosendaal • Uncategorized • 2 • Tags: concept2, erg, OTE, race prep, race preparation, rowing, taper

IMG_1270

Jan 26 2017

2k test workout

The official plan had a 2x750m at 2k pace, but I wanted to do a bit more and still get a feel for my 2k fitness.

On row2k, I found this workout, also described here, and I was intrigued. The only issue is that the two descriptions weren’t identical.

On the Concept2 Forum, it is described as:

WEIS

Set your erg for 40 minutes

4×30 seconds on , 30 seconds off at 98%

5 minutes on. 1 minute off at 88%
10×20 seconds on , 10 seconds off at 94%

10 minutes on at 86%

10×20 seconds on , 10 seconds off at 94%

5 minutes on ,1 minute off at 88%

4×30 seconds on,30 seconds off at 98%

The percentages are percentages of pace, and the example given is that a 98% of a 1:46 split is 1:48 split.
On row2k, it is described as:

-4 x 30″ on, 30″ off at two splits faster than your 2k split

-1 x 5′ on, 1′ off at three splits slower than your 5k split

-10 x 20″ on, 10″ off at two splits slower than your 2k split

-1 x 10′ at six splits slower than your 5k split (no rest between this and the next set)

-10 x 20″ on, 10″ off at two splits slower than your 2k split

-1 x 5′ on, 1′ off at three splits slower than your 5k split

-4 x 30″ on, 30″ off at two splits faster than your 2k split

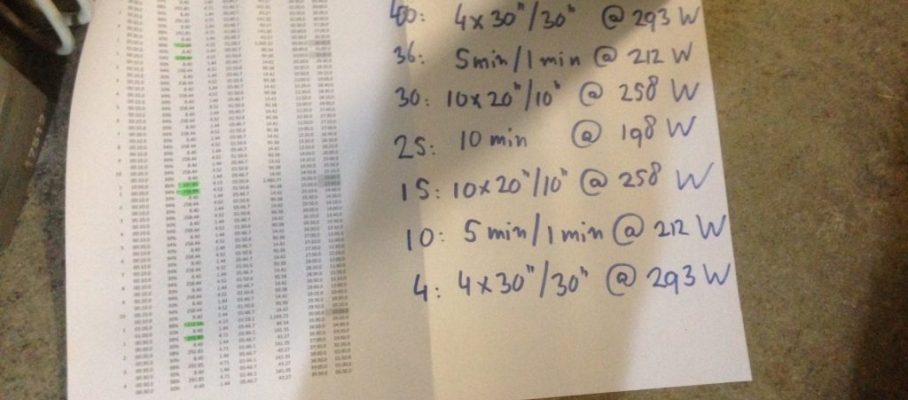
I translated the Concept2 prescription to Watts and, based on a 2k split of 1:44, I arrived at the following:

  • 4×30″ on 30″ off at 293W (1:46 split)
  • 5’/1′ at 212W (1:58 split)
  • 10×20″/10″ at 258W (1:50 split)
  • 10′ at 198W (2:01 split)
  • 10×20″/10″ at 258W (1:50 split)
  • 5’/1′ at 212W (1:58 split)
  • 4×30″ on 30″ off at 293W (1:46 split)

I found this quite OK to do, but when I wrote down the splits I didn’t know about the row2k description, which is much faster. Not sure if I did it right or wrong now and what it means for my 2k pace. I prepared a cheat sheet and did the workout.

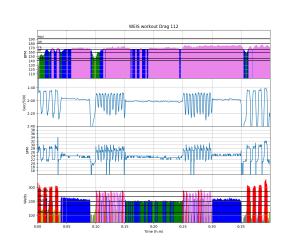
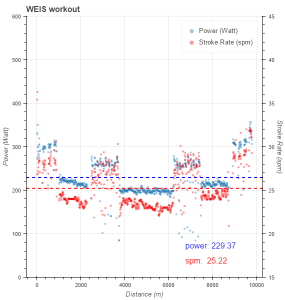
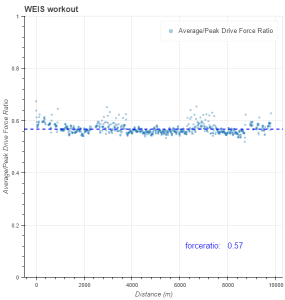
Here are the charts:

The Seismogram

Here are the Pie Charts. I think the Power Pie chart is a colorful beauty:

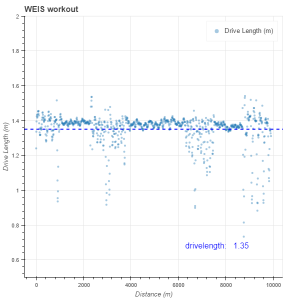
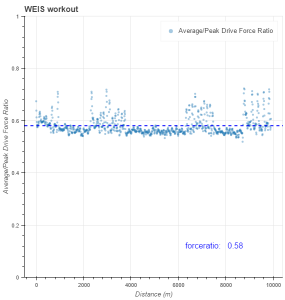
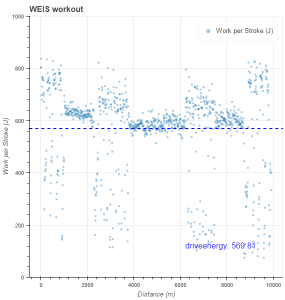
And the flex charts:

Unfortunately, there were too many intervals and they were too short for the interval editor to do its work well, so I couldn’t filter out the “rest” strokes. Well, at 20″ on, 10″ off, the rest strokes are not plenty.

Well, I guess I will do my 2k attempt at 1:44 pace … I should have listened to our coach and done the 2x750m.

Still, this was a fun workout to do. But I am afraid that at the paces described by row2k, it is a much harder one.

Update

I upgraded the interval parser, so now I could edit the intervals:


Workout Summary - media/20170126-1930210o.csv
--|Total|-Total-|--Avg--|-Avg-|Avg-|-Avg-|-Max-|-Avg
--|Dist-|-Time--|-Pace--|-Pwr-|SPM-|-HR--|-HR--|-DPS
--|09874|40:00.0|02:01.6|210.1|24.4|168.8|177.0|10.1
W-|07972|30:40.0|01:55.4|226.7|25.1|169.1|177.0|10.4
R-|01933|09:20.0|02:25.1|136.3|21.2|167.4|177.0|09.0
Workout Details
#-|SDist|-Split-|-SPace-|-Pwr-|SPM-|AvgHR|MaxHR|DPS-
00|00146|00:30.0|01:42.9|277.9|27.6|134.3|152.0|10.6
01|00142|00:30.0|01:45.4|291.1|27.8|158.4|165.0|10.2
02|00143|00:30.0|01:44.8|294.3|28.1|164.0|170.0|10.2
03|00143|00:30.0|01:45.2|300.2|28.4|165.1|170.0|10.0
04|01281|05:00.0|01:57.1|218.0|23.8|167.6|171.0|10.7
05|00091|00:20.0|01:49.5|253.5|26.1|152.6|158.0|10.5
06|00090|00:20.0|01:51.6|247.7|26.4|159.2|162.0|10.2
07|00090|00:20.0|01:50.9|254.9|27.4|165.4|168.0|09.9
08|00090|00:20.0|01:51.3|253.9|27.1|167.8|169.0|09.9
09|00089|00:20.0|01:52.6|233.4|26.8|169.6|170.0|09.9
10|00090|00:20.0|01:51.2|246.6|27.1|170.6|172.0|09.9
11|00089|00:20.0|01:52.3|244.9|27.7|169.9|171.0|09.7
12|00089|00:20.0|01:52.4|234.9|26.4|170.8|172.0|10.1
13|00090|00:20.0|01:50.9|251.2|27.6|170.4|171.0|09.8
14|00090|00:20.0|01:51.7|250.7|27.6|172.7|173.0|09.7
15|02481|10:00.0|02:00.9|197.5|23.2|168.6|172.0|10.7
16|00091|00:20.0|01:49.6|256.9|26.5|173.0|176.0|10.3
17|00089|00:20.0|01:52.6|247.0|27.3|173.8|175.0|09.8
18|00088|00:20.0|01:53.4|231.4|27.0|173.7|175.0|09.8
19|00088|00:20.0|01:53.8|231.8|26.8|171.3|172.0|09.8
20|00089|00:20.0|01:52.4|238.7|27.9|171.4|173.0|09.6
21|00089|00:20.0|01:51.8|247.0|28.0|173.2|175.0|09.6
22|00089|00:20.0|01:51.8|243.1|27.8|173.4|174.0|09.7
23|00089|00:20.0|01:52.5|239.2|27.7|174.3|176.0|09.6
24|00088|00:20.0|01:53.9|230.1|27.3|174.1|175.0|09.6
25|00089|00:20.0|01:52.3|240.4|27.9|174.8|176.0|09.6
26|01272|05:00.0|01:57.9|213.1|24.4|174.9|177.0|10.4
27|00144|00:30.0|01:44.2|304.2|28.8|166.0|173.0|10.0
28|00143|00:30.0|01:44.9|297.4|28.6|171.2|175.0|10.0
29|00144|00:30.0|01:43.9|302.3|29.1|173.5|177.0|09.9
30|00146|00:30.0|01:42.5|327.6|31.2|173.5|176.0|09.4

By sanderroosendaal • Uncategorized • 2

myimage (17)

Jan 25 2017

Taper for no race

I am following the official training plan of the Masters group of our club now. It’s a watered down version of what the Juniors are doing. We’re tapering for an erg regatta coming Saturday.

Unfortunately, I probably won’t be able to travel to Pardubice. We have a couple of sick kids in the family. Gotta stay at home and do the 2k on my own rower. Oh well.

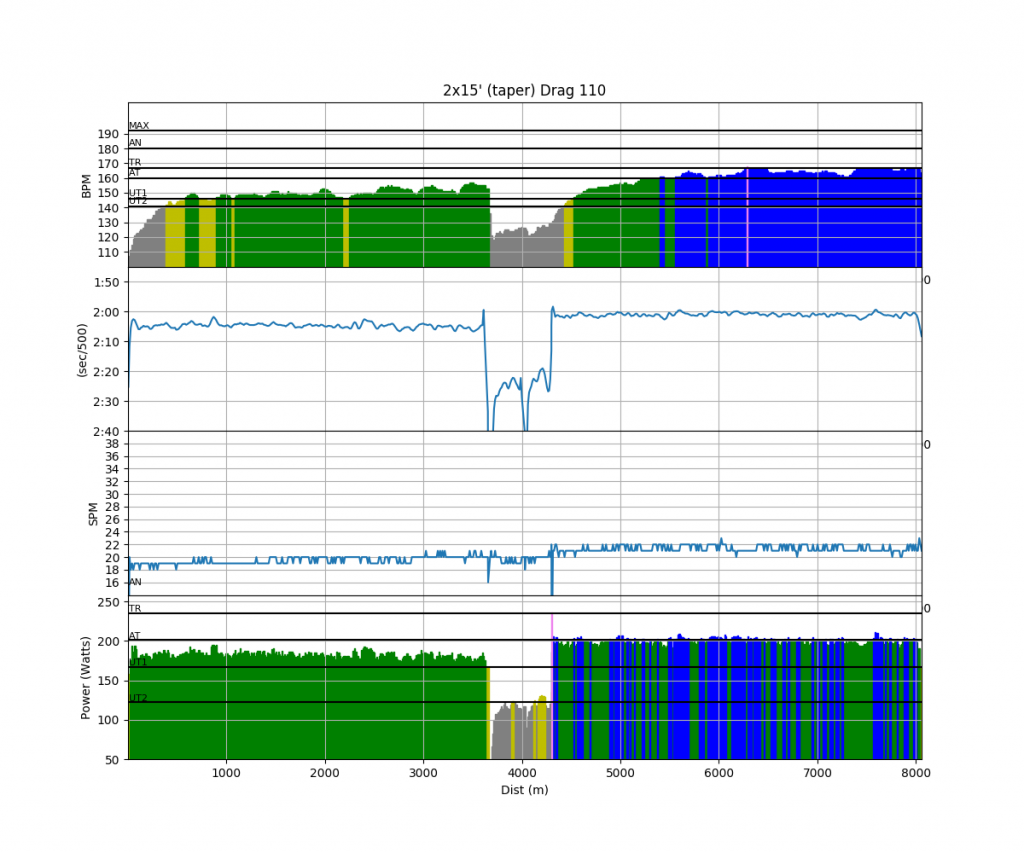
Today was 2k warming up, followed by 2×15 minutes at 19 and 21spm. A luxurious 4 minutes of rest.


Workout Summary - media/20170125-1943230o.csv
--|Total|-Total-|--Avg--|-Avg-|Avg-|-Avg-|-Max-|-Avg
--|Dist-|-Time--|-Pace--|-Pwr-|SPM-|-HR--|-HR--|-DPS
--|08056|38:00.0|02:21.5|184.2|20.3|151.8|168.0|10.4
W-|07373|30:00.0|02:02.1|191.1|20.4|154.1|168.0|12.1
R-|00685|08:00.0|05:50.2|138.8|20.2|144.8|168.0|00.2
Workout Details
#-|SDist|-Split-|-SPace-|-Pwr-|SPM-|AvgHR|MaxHR|DPS-
00|03639|15:00.0|02:03.6|182.2|19.4|147.7|157.0|12.5
01|03733|15:00.0|02:00.5|199.9|21.4|160.5|168.0|11.7

Something cool about the Power Pie Chart (at least in my opinion). On Rowsandall.com, I have made the Power Zones more flexible. You can now name them as you want and change the zone boundaries to your liking. So I named the lowest zone “Rest”.

By sanderroosendaal • Uncategorized • 0 • Tags: concept2, erg, OTE, rowing, taper, training

«< 54 55 56 57 58 >»

Calendar

May 2025
M T W T F S S
 1234
567891011
12131415161718
19202122232425
262728293031  
« Jan    

Tags

1x 2x 4x2km 6k 8+ 1000m concept2 crewnerd cross-training cross training crosstraining ctc double eight erg ergometer head race head race prep intervals lactate lake masters mix OTE OTW pete plan quad race race prep racing river rowing running single sprint sprintervals steady state strength taper technique test testing threshold training training plan

↑

© Rowsandall 2025
Powered by WordPress • Themify WordPress Themes
We use cookies to ensure that we give you the best experience on our website. If you continue to use this site we will assume that you are happy with it.Ok