Jan 9 2018
Steady State, Swim, 1k erg and some Math
This is going to be a very brief summary of the past three days of training, plus some math related to a big upgrade planned for rowsandall.com.
Sunday
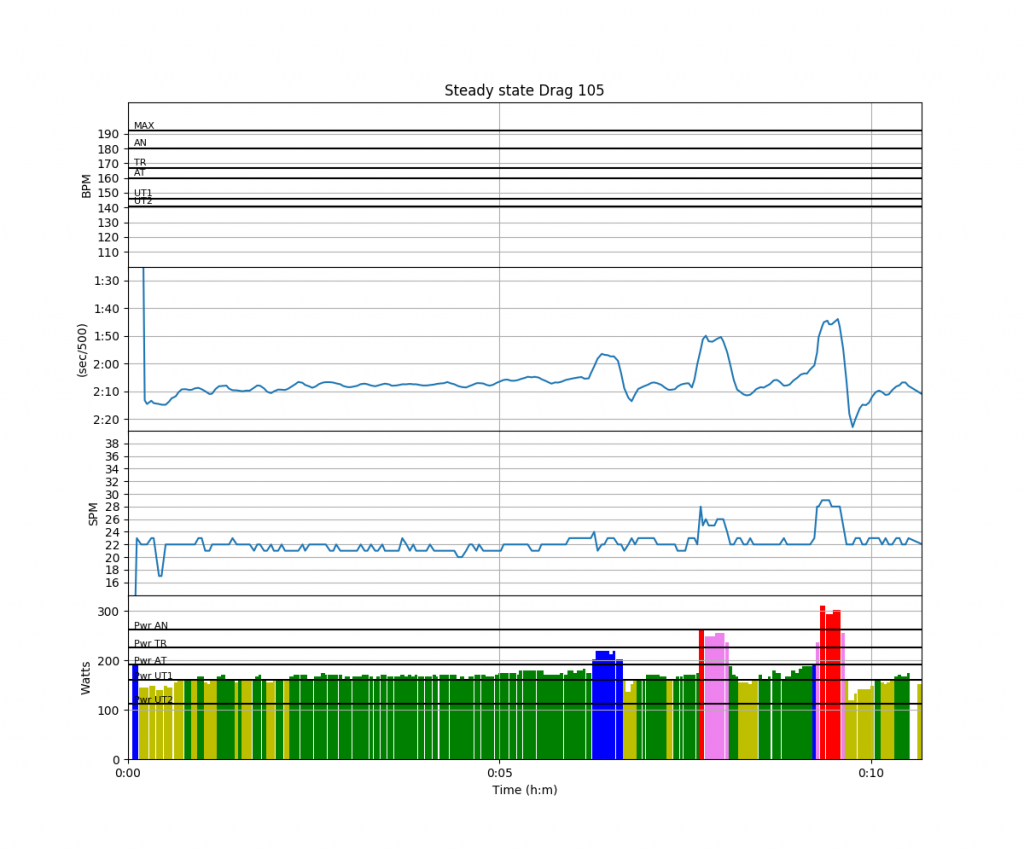
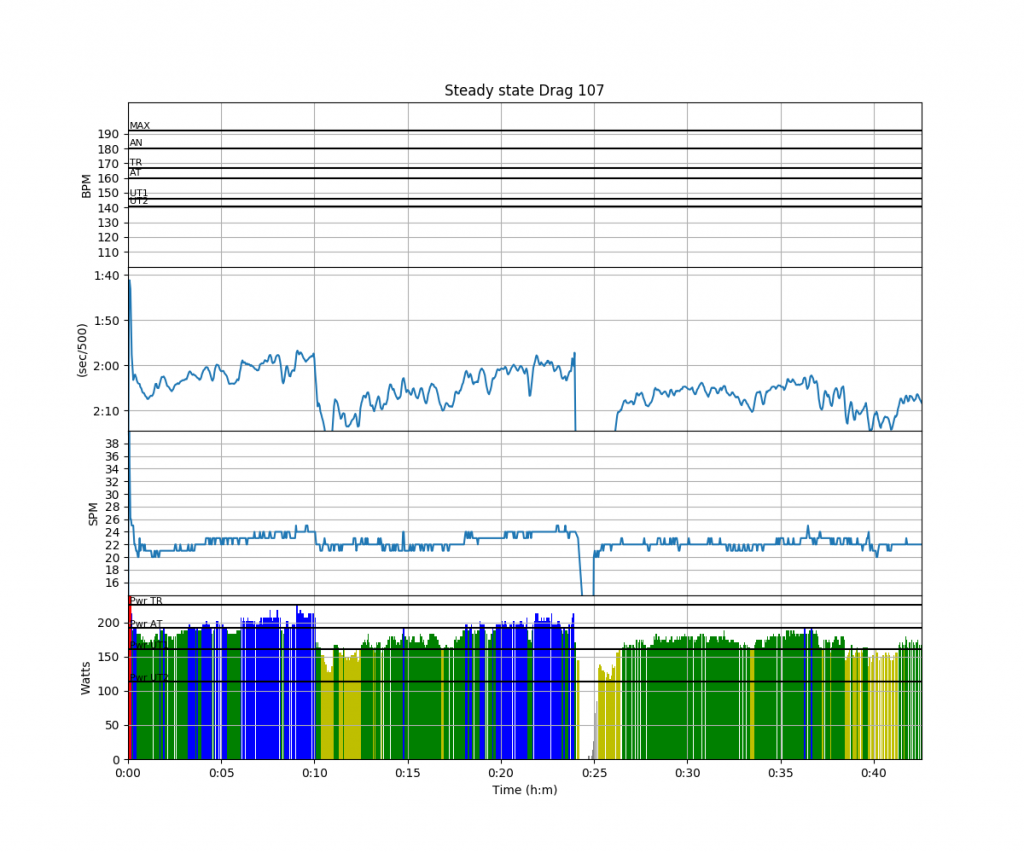
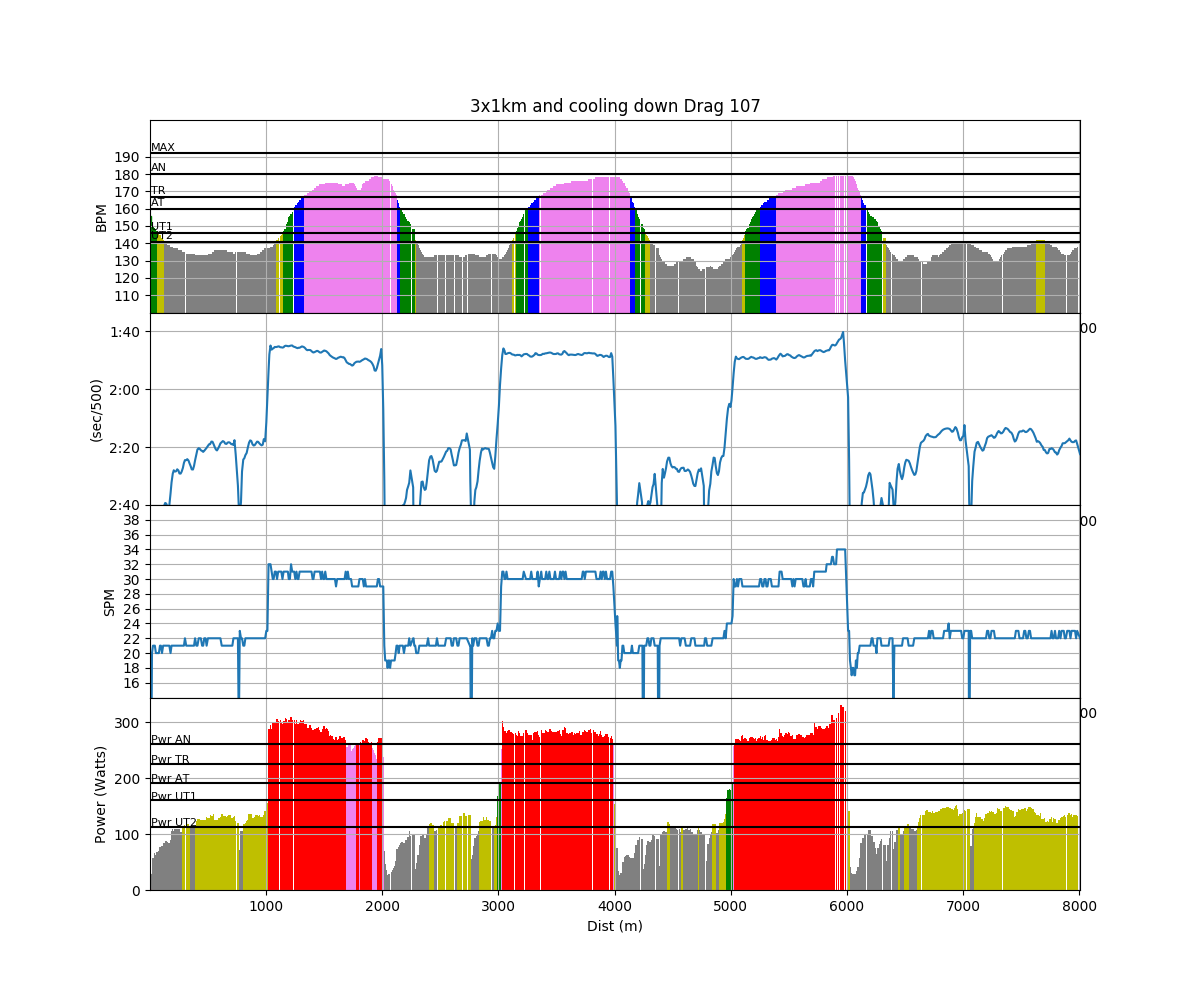
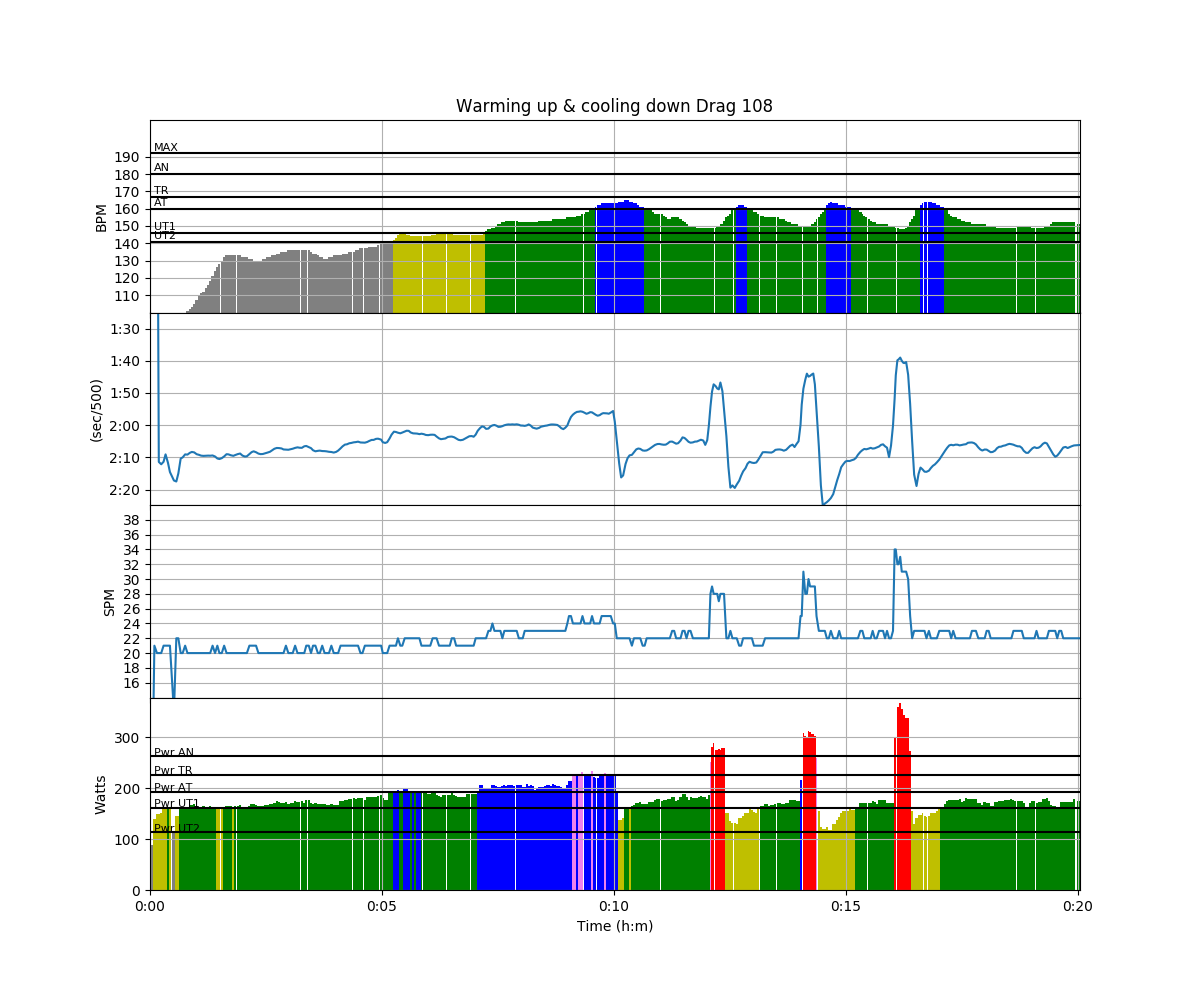
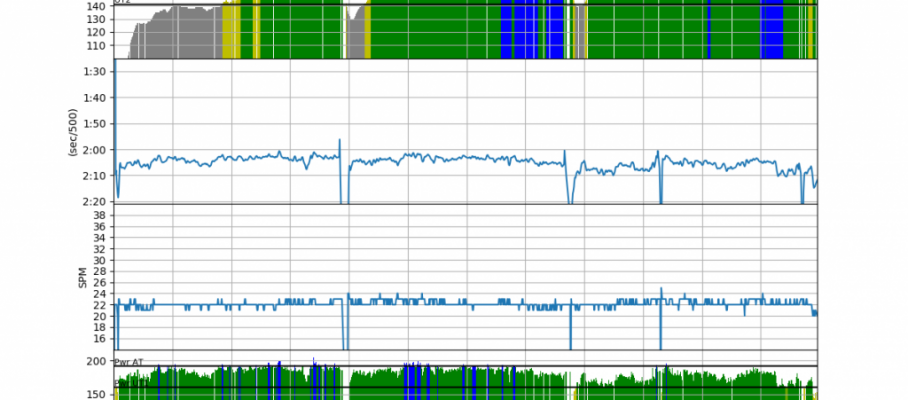
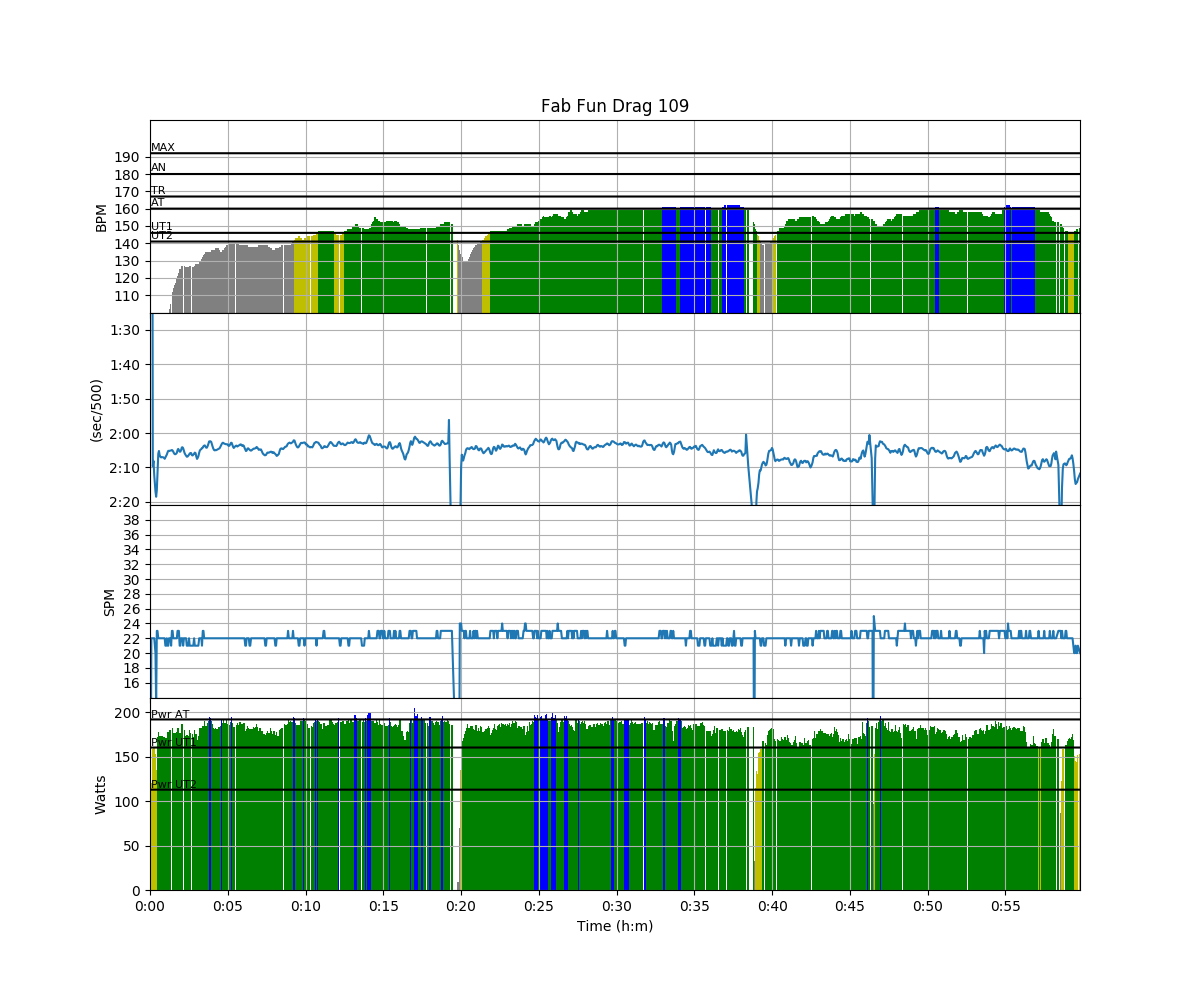
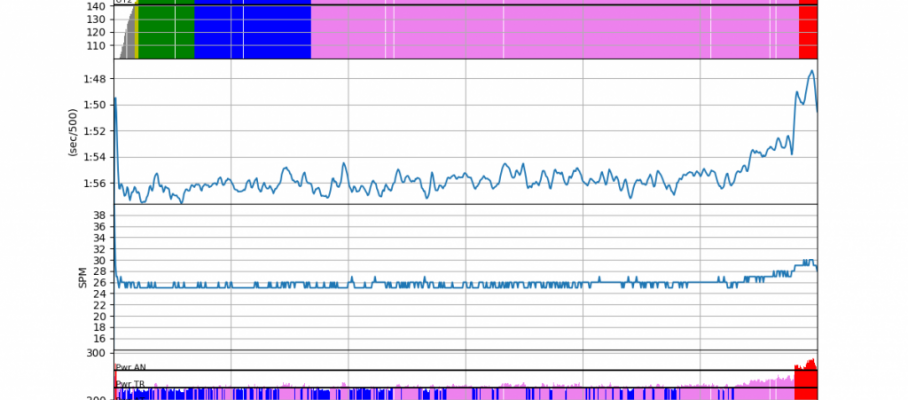
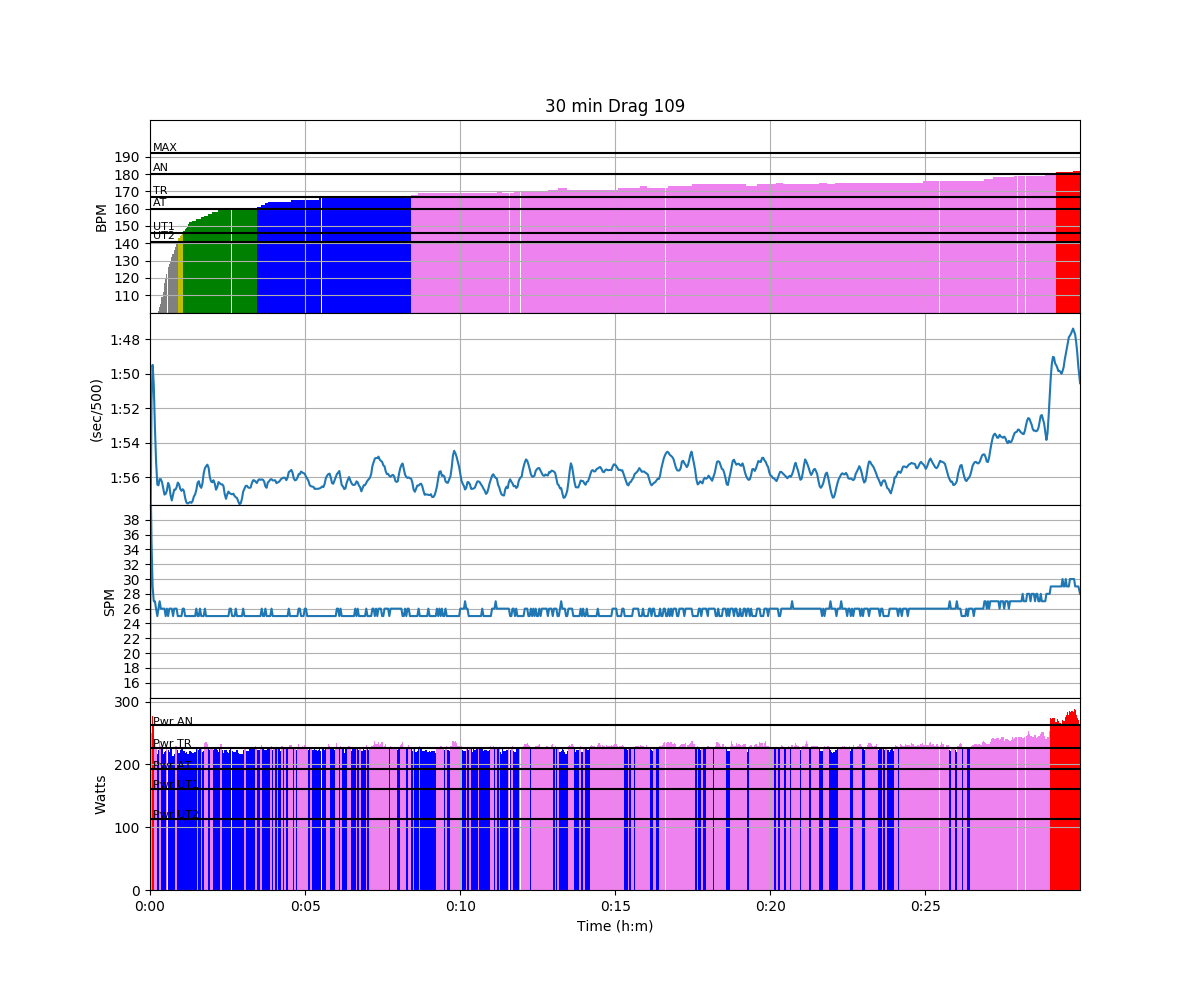
Steady state at the rowing club. As the others were doing some 10 minute intervals, with increasing intensity during the 10 minute, my steady state was reflecting that, at a milder intensity and a less steep power increase.
One hour in total.
Monday
A long day at work and meetings late into the evening. So I went swimming in the morning. I wore the Tickr X heart rate belt, which has an internal memory. Unfortunately, it doesn’t record heart rate well in the pool. The summary said total time 78 minutes (correct), maximum heart rate 161 bpm (could be right), average heart rate 109 bpm (definitely wrong). I think the average is somewhere around 140-145 bpm.
Tuesday
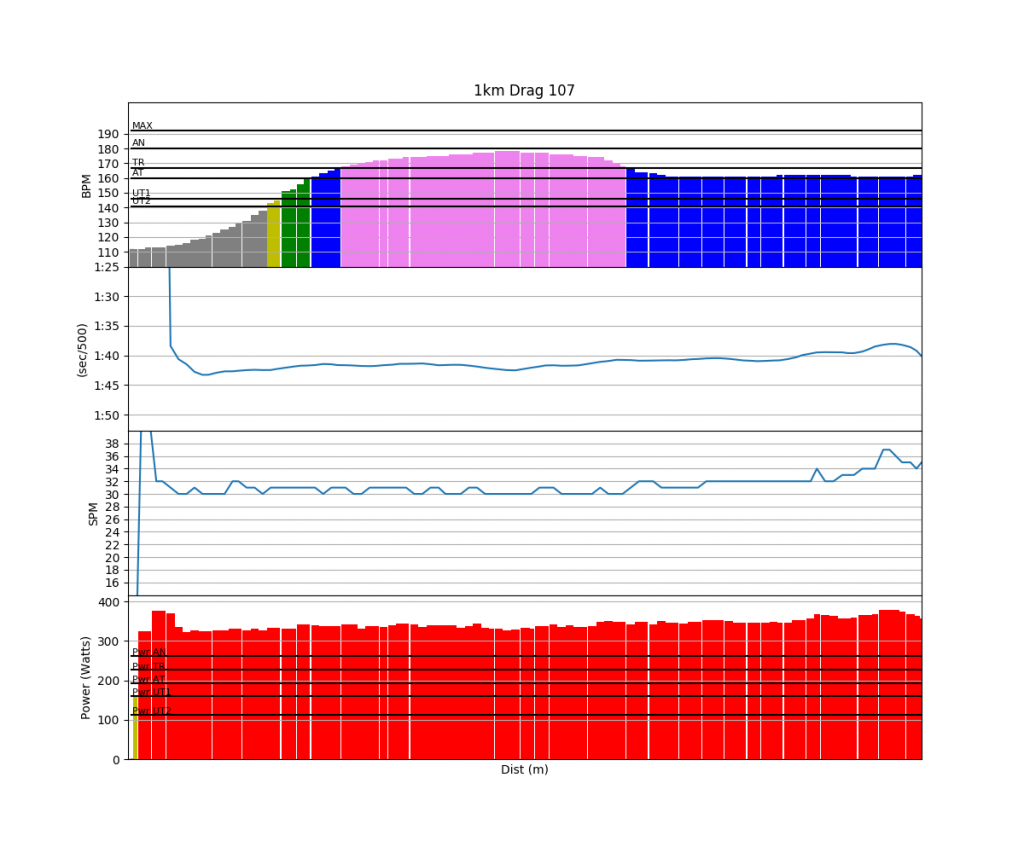
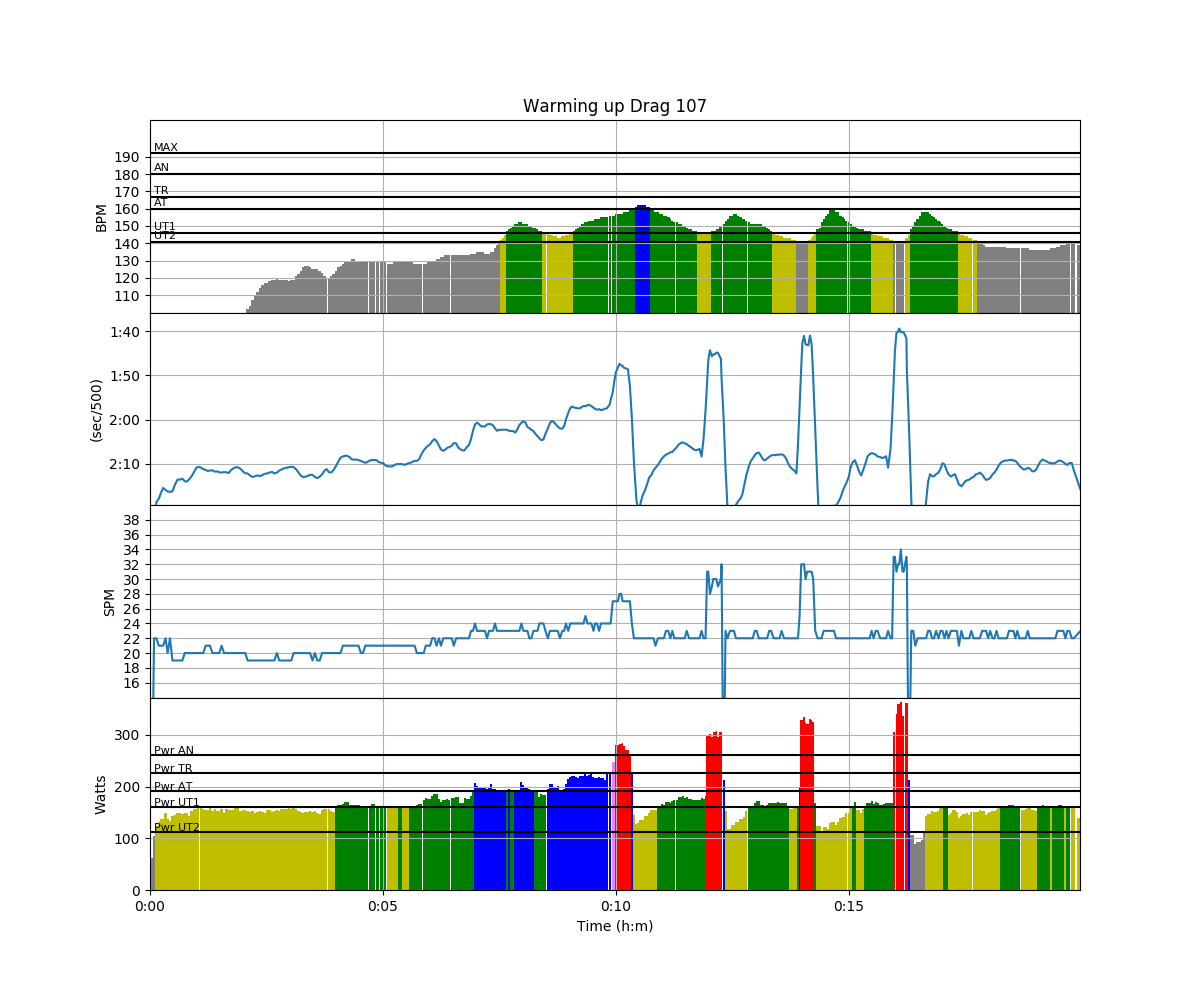
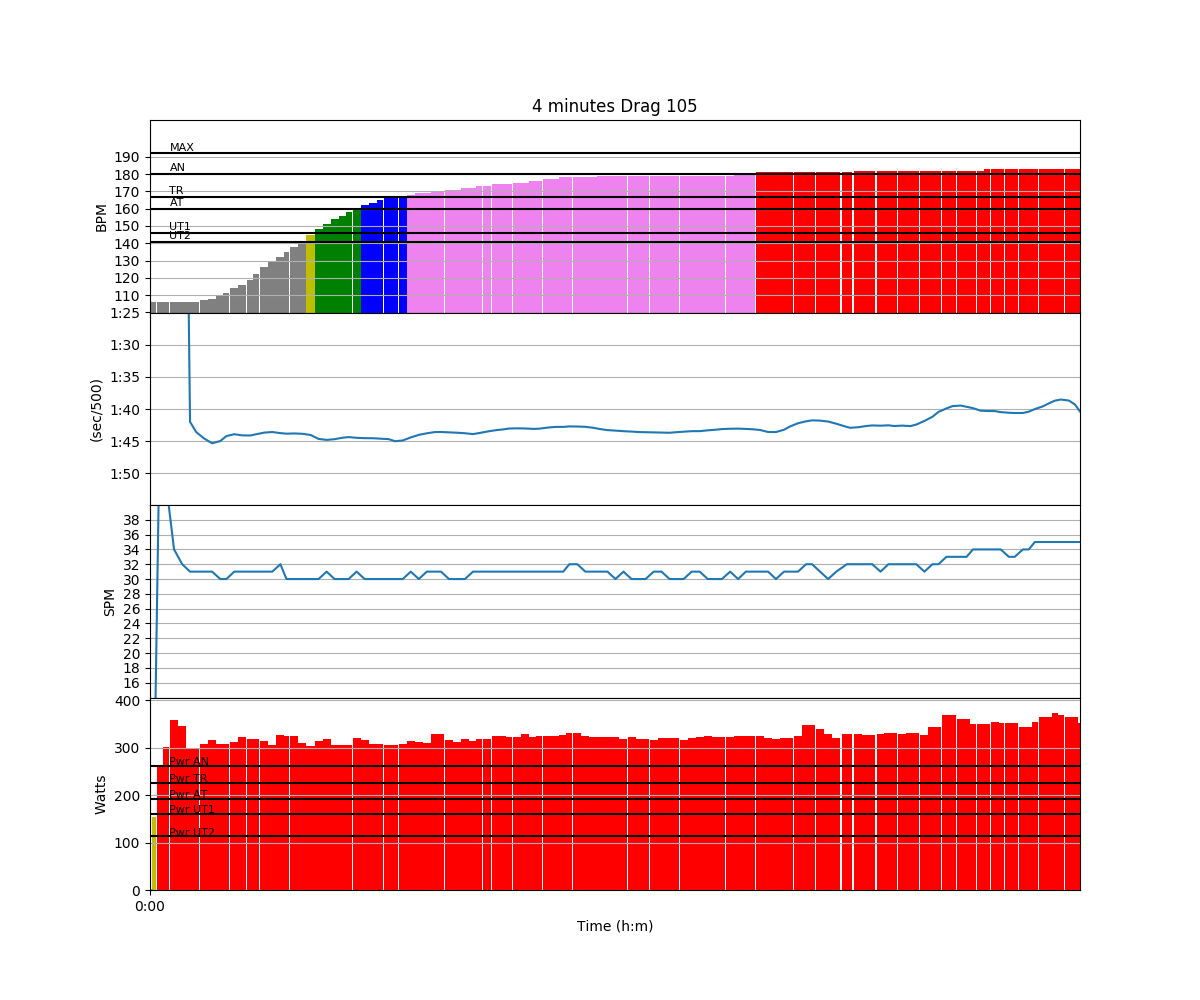
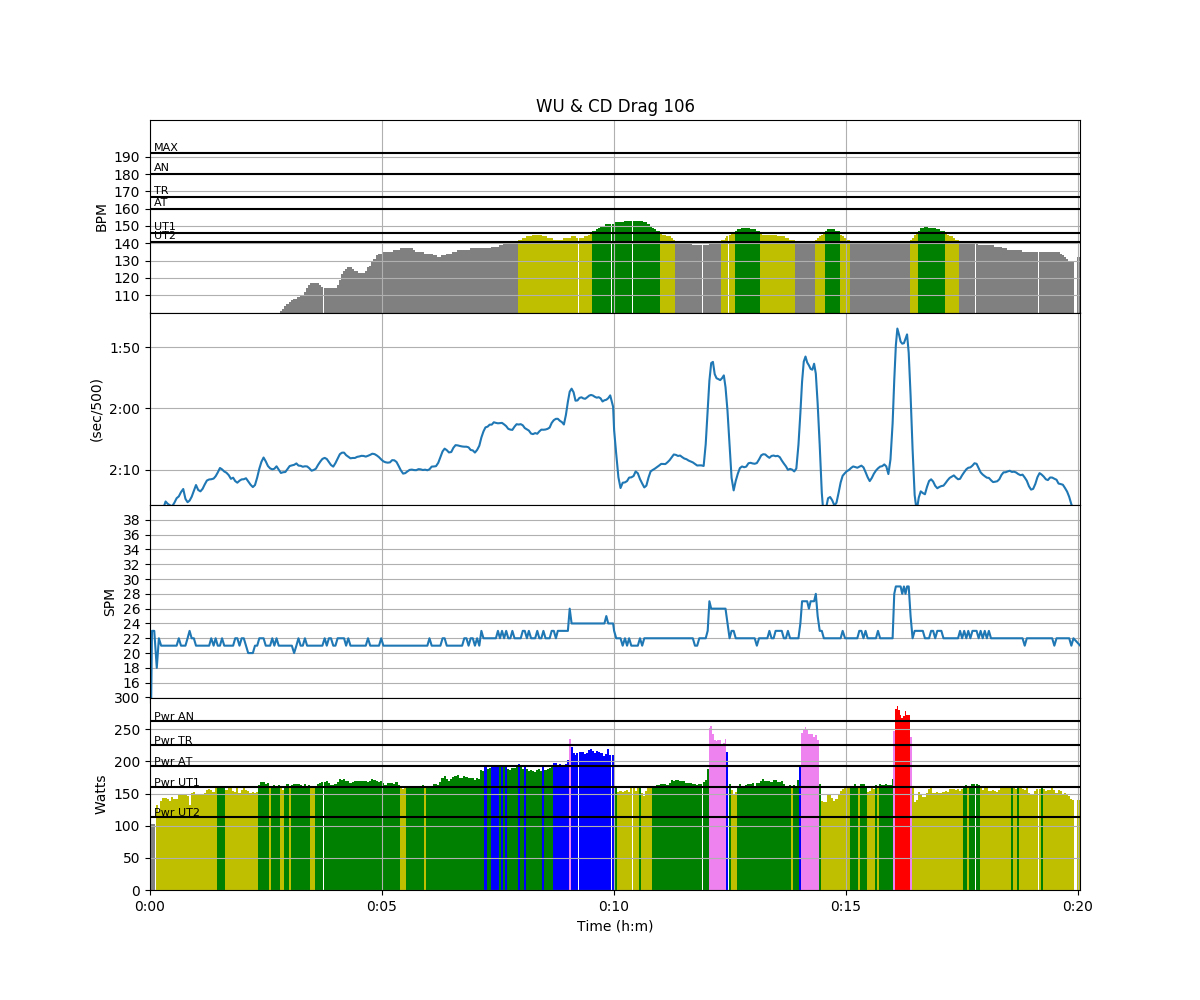
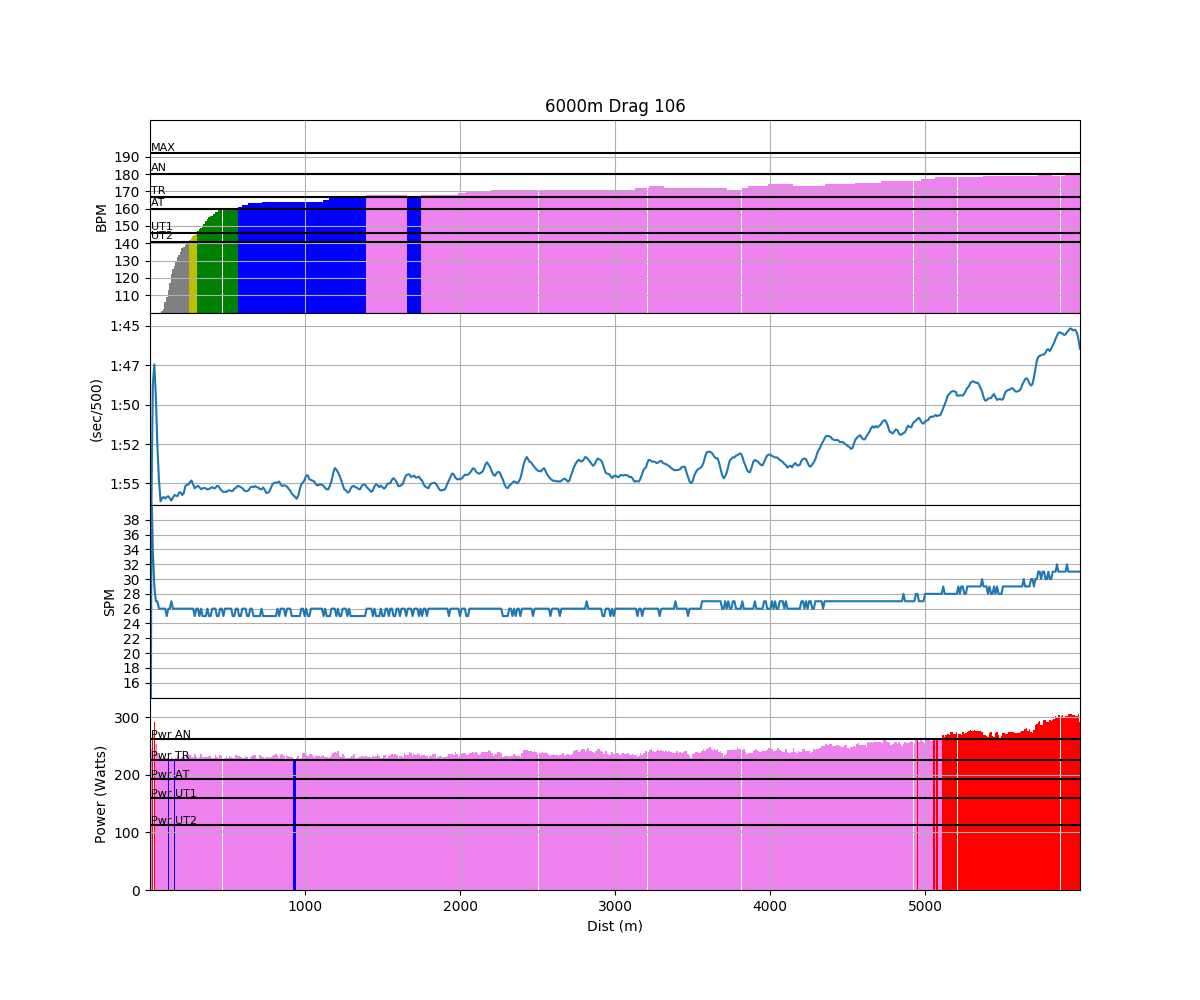
Another long day at work, then a quick dinner, followed by a 1k full out. Twenty five minutes of warming up. Ten minutes of cooling down. My volume is decreasing as a taper for Saturday’s race.
Funny heart rate values. I don’t believe them much.
Workout Summary - media/20180109-1905300o.csv

--|Total|-Total-|--Avg--|-Avg-|Avg-|-Avg-|-Max-|-Avg

--|Dist-|-Time--|-Pace--|-Pwr-|SPM-|-HR--|-HR--|-DPS

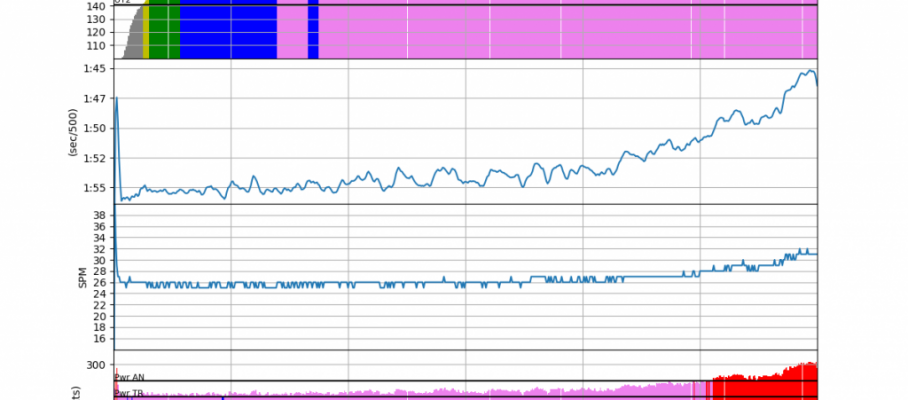
--|01000|03:21.4|01:40.7|339.2|31.1|158.2|178.0|09.6

W-|01000|03:21.4|01:40.7|339.4|31.1|159.0|178.0|09.7

R-|00000|00:00.0|00:00.0|000.0|00.0|000.0|178.0|00.0

Workout Details

#-|SDist|-Split-|-SPace-|-Pwr-|SPM-|AvgHR|MaxHR|DPS-

00|00094|00:18.0|01:36.0|294.6|27.6|114.3|119.0|11.3

01|00094|00:19.1|01:42.0|329.1|30.8|131.7|145.0|09.5

02|00107|00:21.7|01:41.3|337.3|30.7|161.9|170.0|09.6

03|00097|00:19.6|01:40.9|339.1|30.8|173.3|175.0|09.7

04|00096|00:19.6|01:41.5|334.5|30.2|176.8|178.0|09.8

05|00107|00:21.7|01:41.1|337.6|30.4|175.8|177.0|09.8

06|00095|00:19.1|01:40.4|346.8|31.0|165.1|172.0|09.6

07|00103|00:20.6|01:40.2|347.8|31.7|161.0|161.0|09.4

08|00096|00:19.1|01:39.4|354.2|32.2|161.8|162.0|09.4

09|00111|00:22.1|01:39.4|366.5|34.6|161.3|162.0|08.7
Well, that was better than expected. I aimed for 330-335W. Not bad for a regular weekday evening, after a long workday.
Finally, Some Math
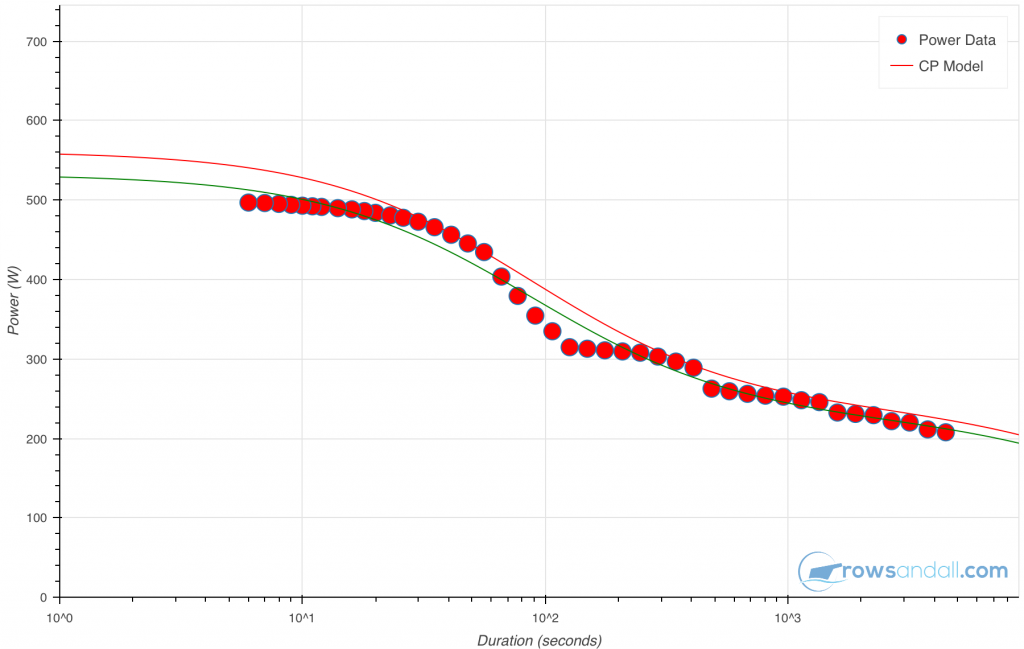
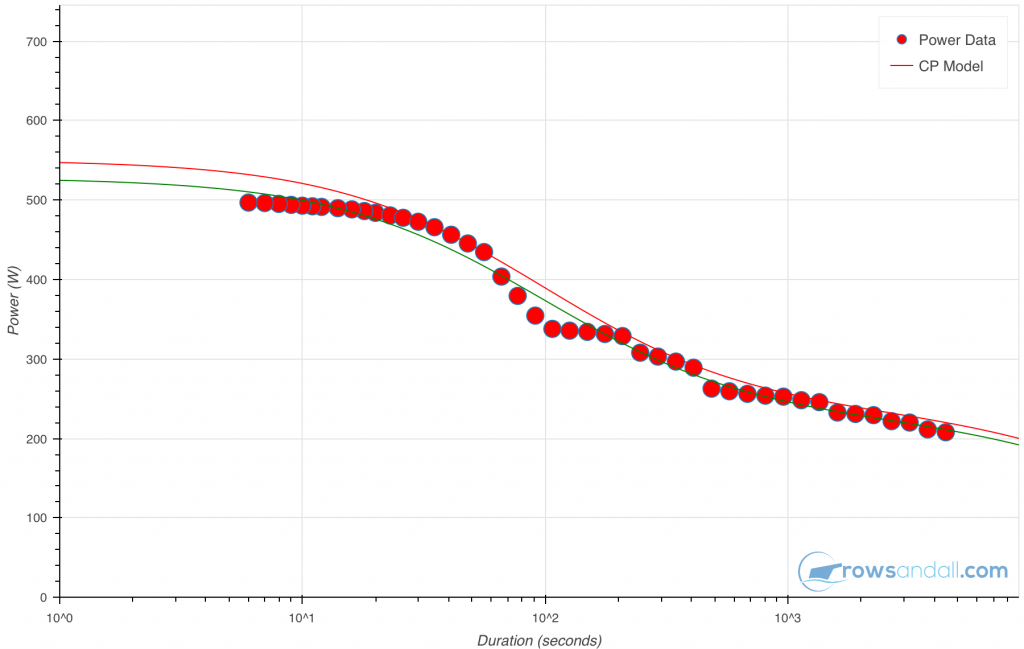
In case you want to find the highest average power interval of a certain duration in a workout, or perhaps all “fastest” intervals for all interval lengths, you can use the following.
Your workout data is a series of metrics measured at equidistant times . Similar to the time vector
there is a power vector
. Calculate the vector
given by:
We then calculate a matrix :
The average power for an interval starting at and ending at
is then given by:
.
If represents the
th diagonal of
, counting from 0, the 0th diagonal being “the” diagonal
,
and
then this vector represents all values of the average power for a time segment of duration . Then you simply take maximum value of this vector.
When written like this, the calculation is just a few lines of code, with the help of the numpy library.
So now you know what we do to your rowing data.





Jan 14 2018
Friday – remaining ranking distances
In the morning, during short breaks from finalizing this year’s performance assessments for my group, I worked down a long checklist to release and publish about the latest and greatest on rowsandall.com.
After that, I took the train home. Before going to the erg basement, I visited the Honda dealer close to my home. We’ve been contemplating getting rid of one of the cars (Romana’s Skoda Fabia), keeping only one as a “family car”. The idea would be to get a scooter for those rides around our town that cannot be done on the bike.
A typical round that I do in the OTW season is
A scooter would save fuel and usually be faster through the traffic. I still have to get used to the idea though. The issue for us Masters rowers is that we still believe we look like this:
Anyway …
The workout for the day wasn’t really a workout. After Thursday’s rest day, Friday was meant to be both a confidence booster (for Saturday’s 2k erg race) and a way to get two of the remaining ranking distances out of the way. So I did:
I managed the 500 in 1:33.4, which is a nice score. As you can see from the chart, power was oscillating between 440 and 460W, and it started to drop when the wheels came off in the final 150m.
Then I did a 2km paddle followed by a 100m at a slightly higher drag factor, which I managed around 600W. This resulted in the following series of ranking pieces rowed this season:
The other interesting thing is that the 500m piece looks like the best of the series. The 100m piece average is below 600W because it takes too many strokes to get up to 600.
By sanderroosendaal • Uncategorized • 0 • Tags: 100m, 500m, concept2, ergometer, ranking, rowing, training