Sep 18 2016
Recovery Run – through the woods
The title says it all. It’s a recovery run. I decided to run instead of erg, because the weather was unexpectedly dry (rain was forecasted) and I was really eager to start hitting the trails again.
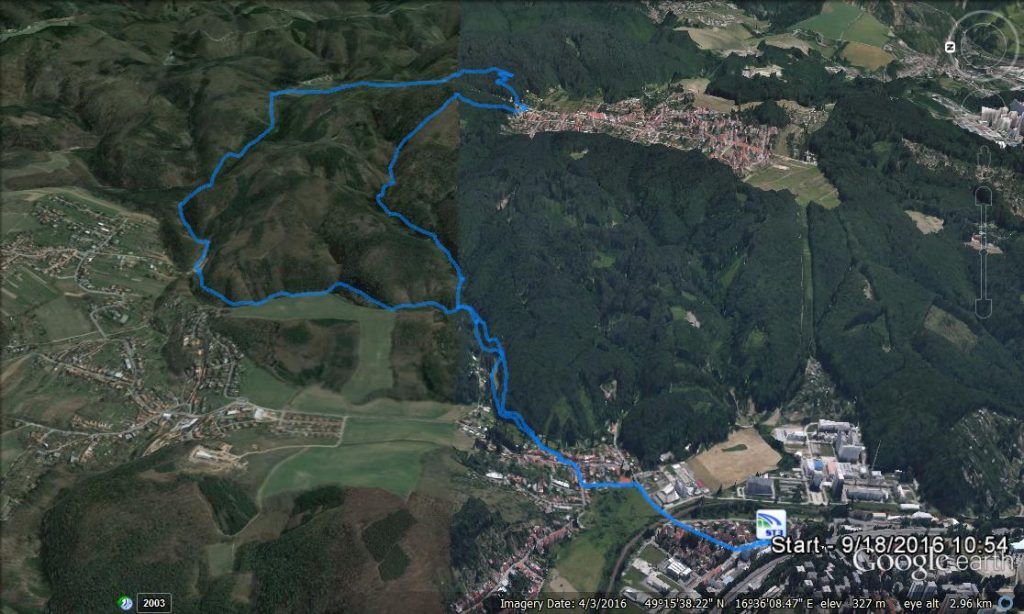
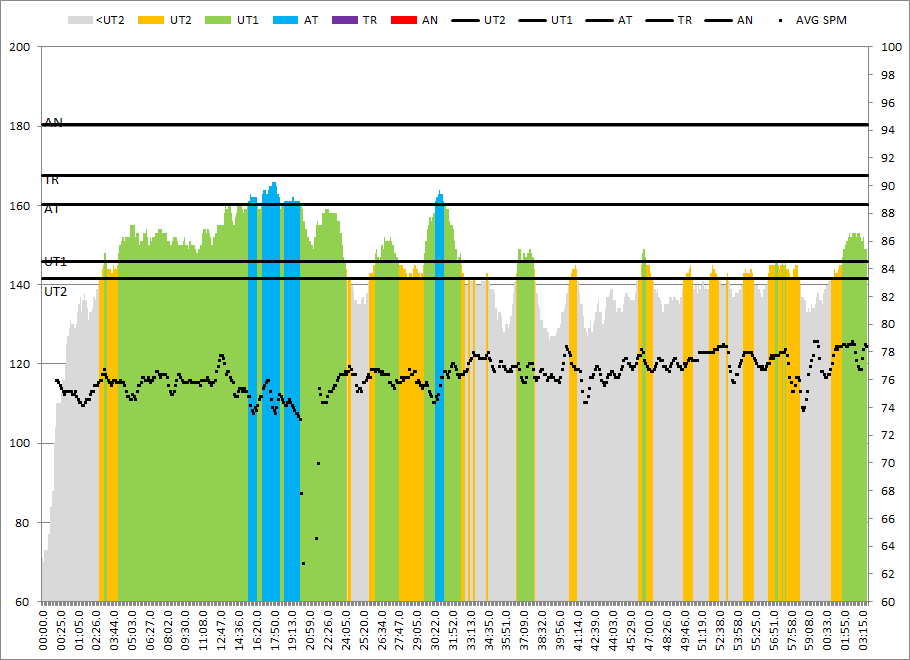
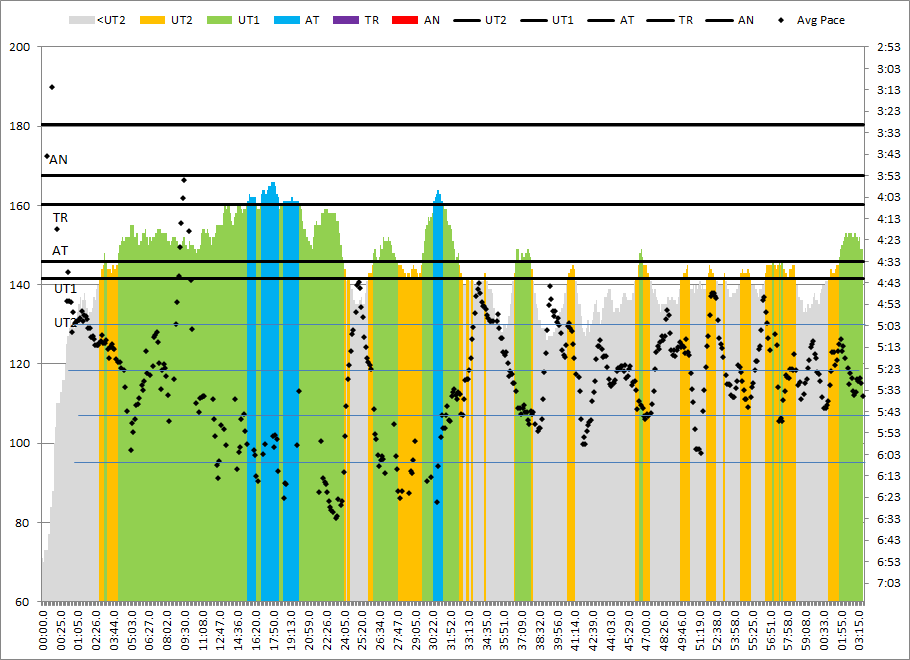
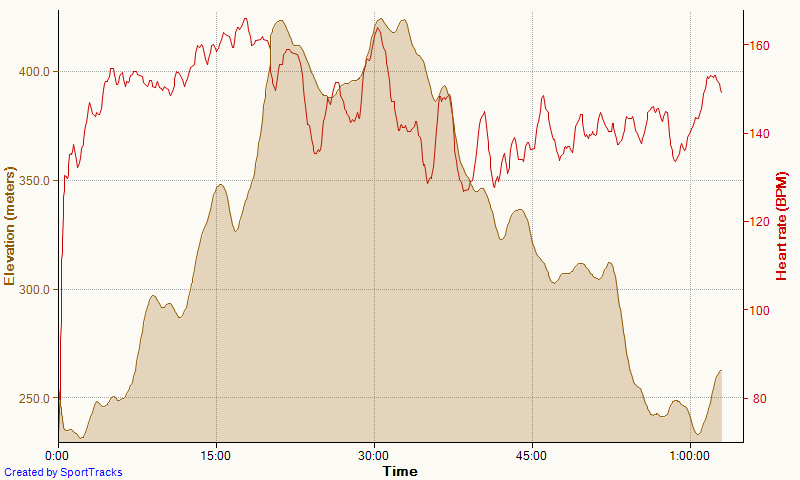
I slowed down whenever my heart rate was approaching 160 bpm. First, I wanted to do my regular 12 km “benchmark” run, but in the end I decided to take it easy and use the opportunity to take some trails that I normally don’t run on. I made up the loop as I ran it, trying to be around 10km. In the end I ran 11km.
A few of the new trails I followed were actually “roads” for forest workers. The trails were soft, sandy, and at places muddy. Also, there were a lot of cut branches. I tripped only once and landed quite elegantly, in the mud. No damage to muscles or bones, luckily.
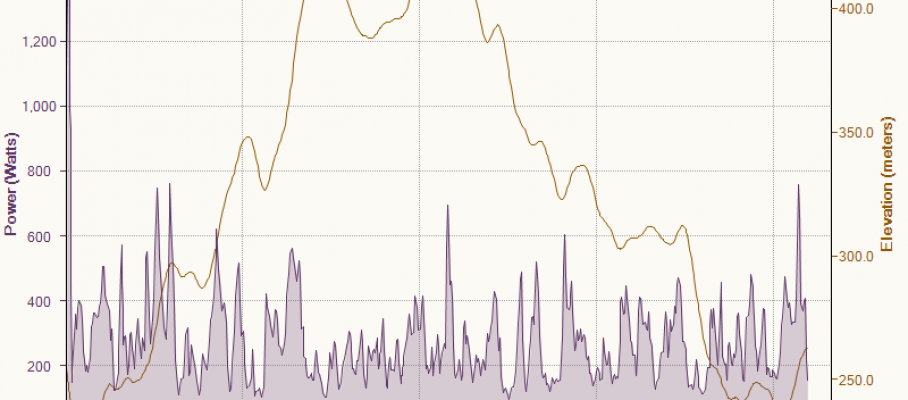
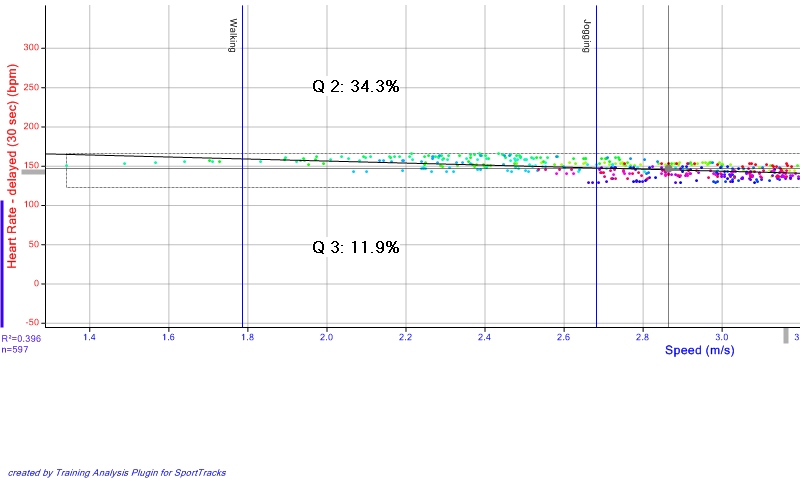
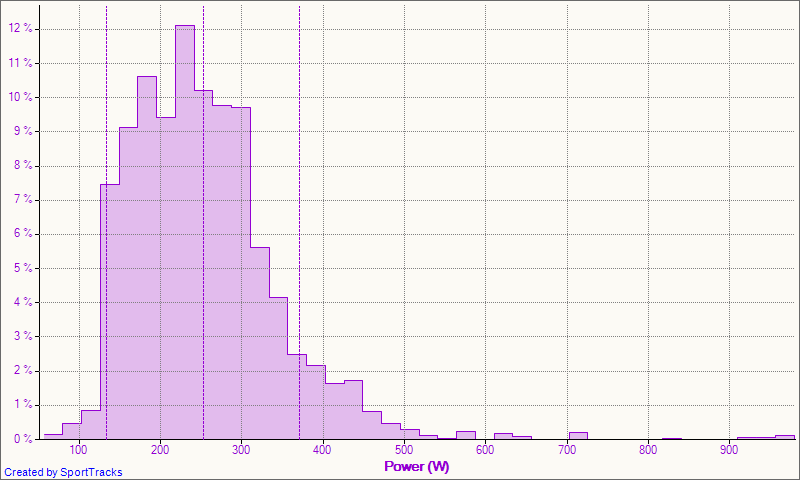
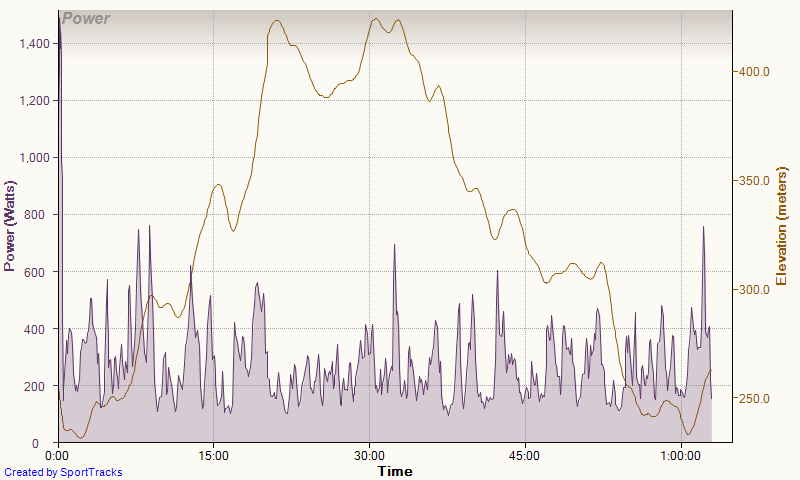
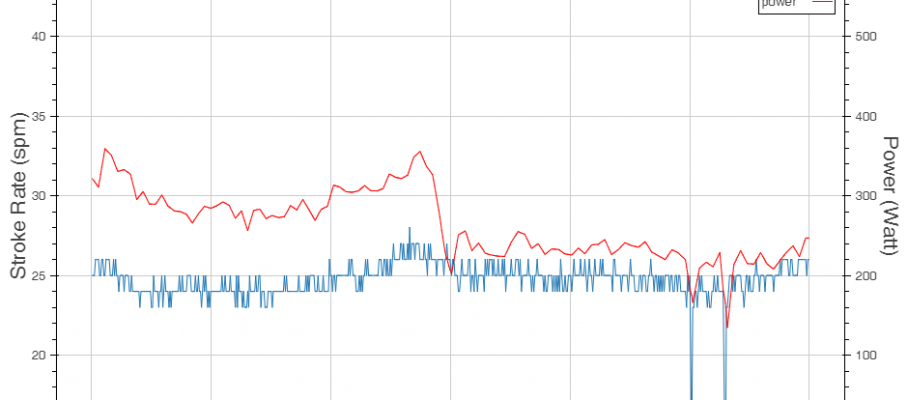
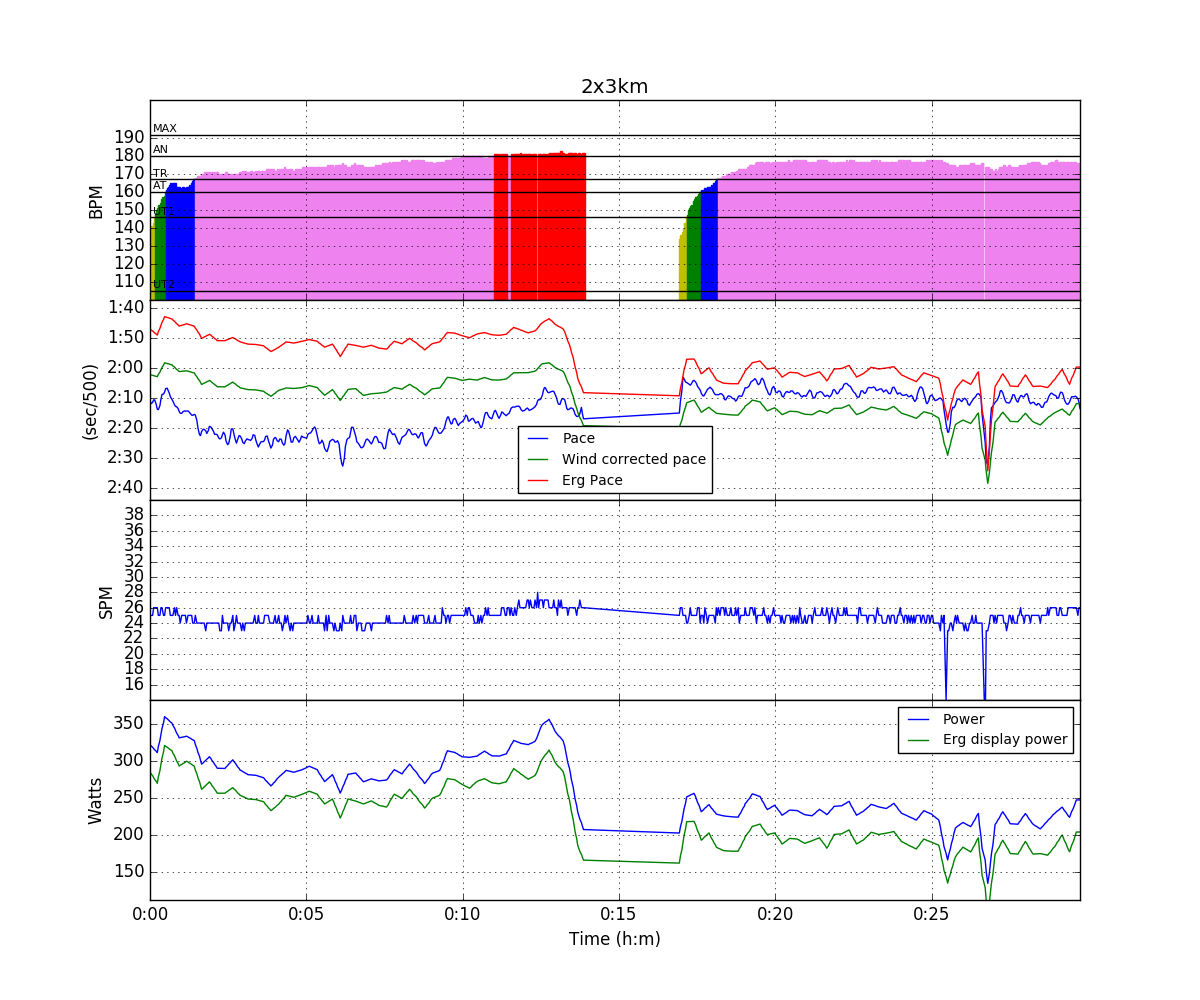
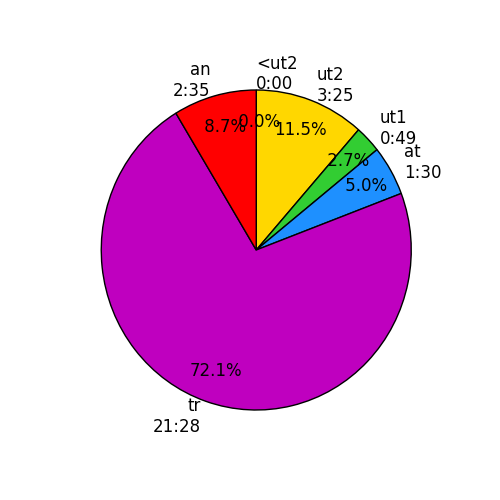
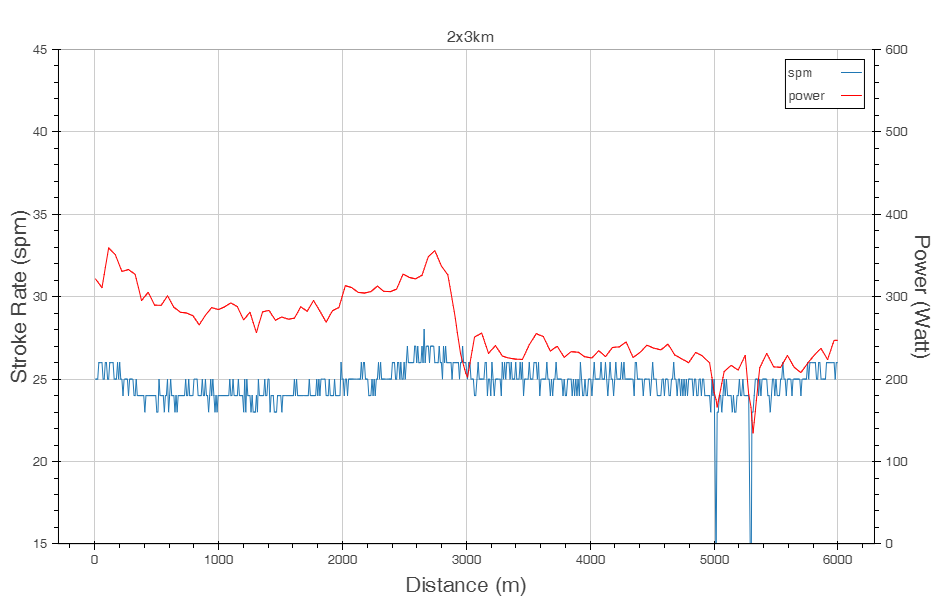
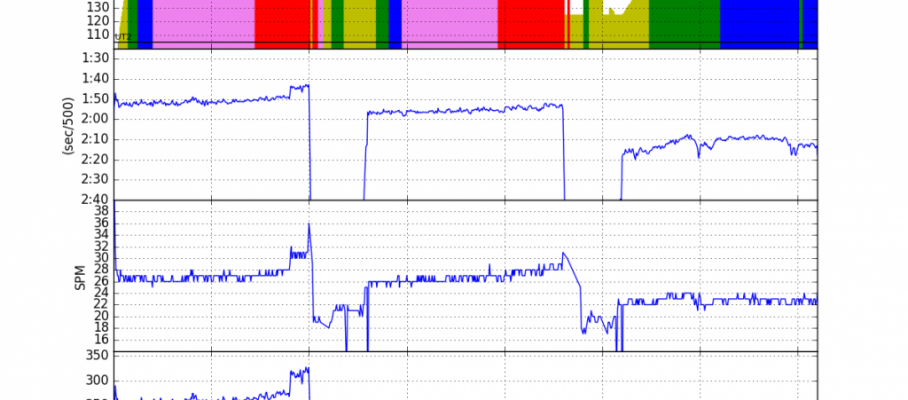
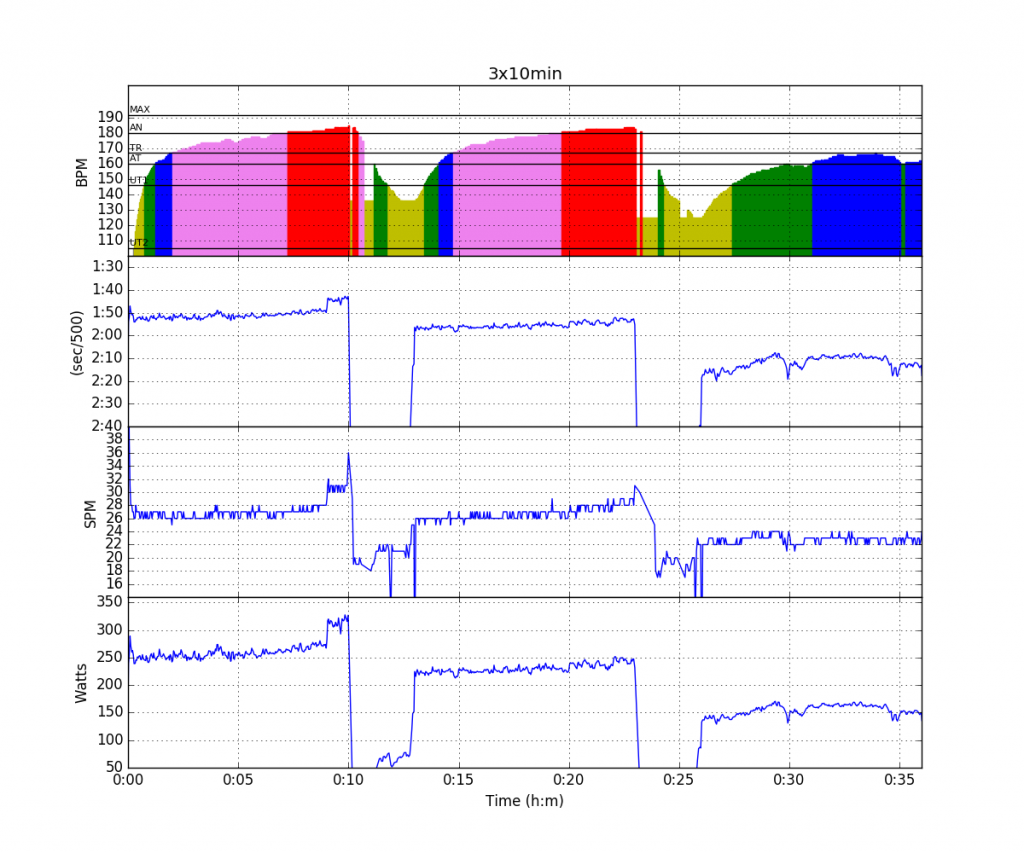
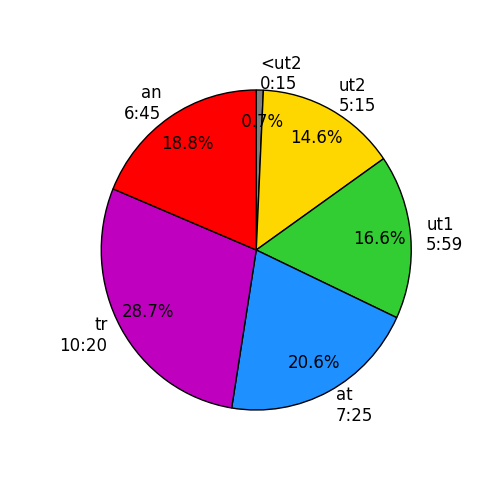
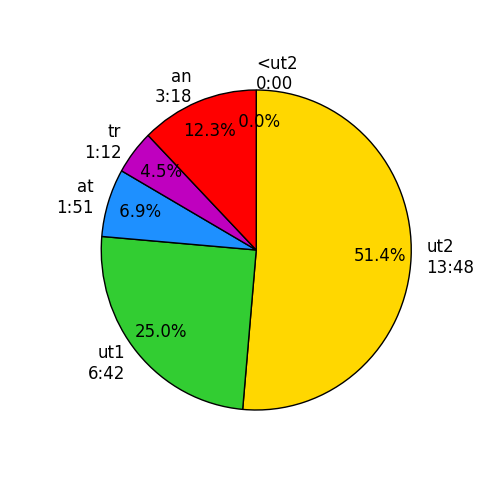
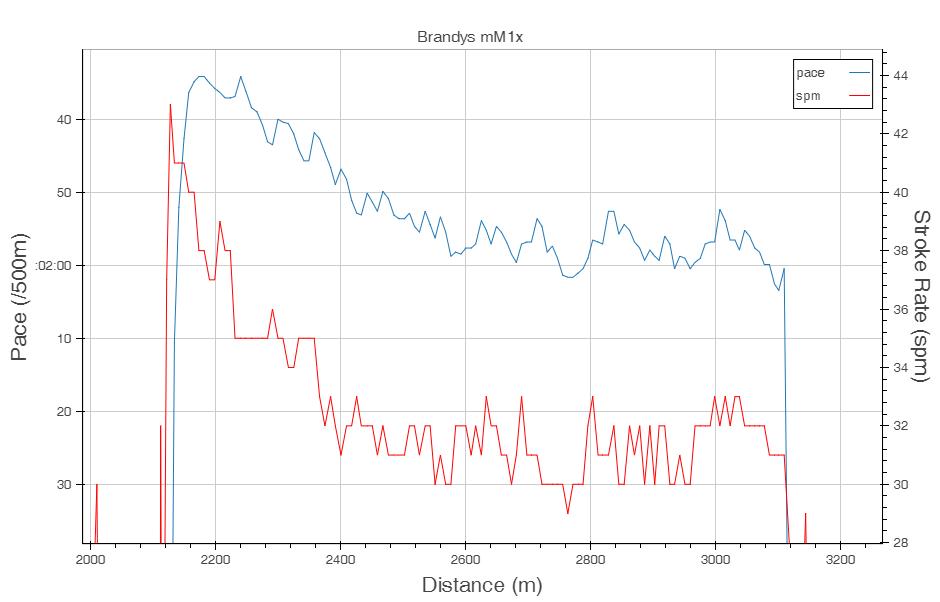
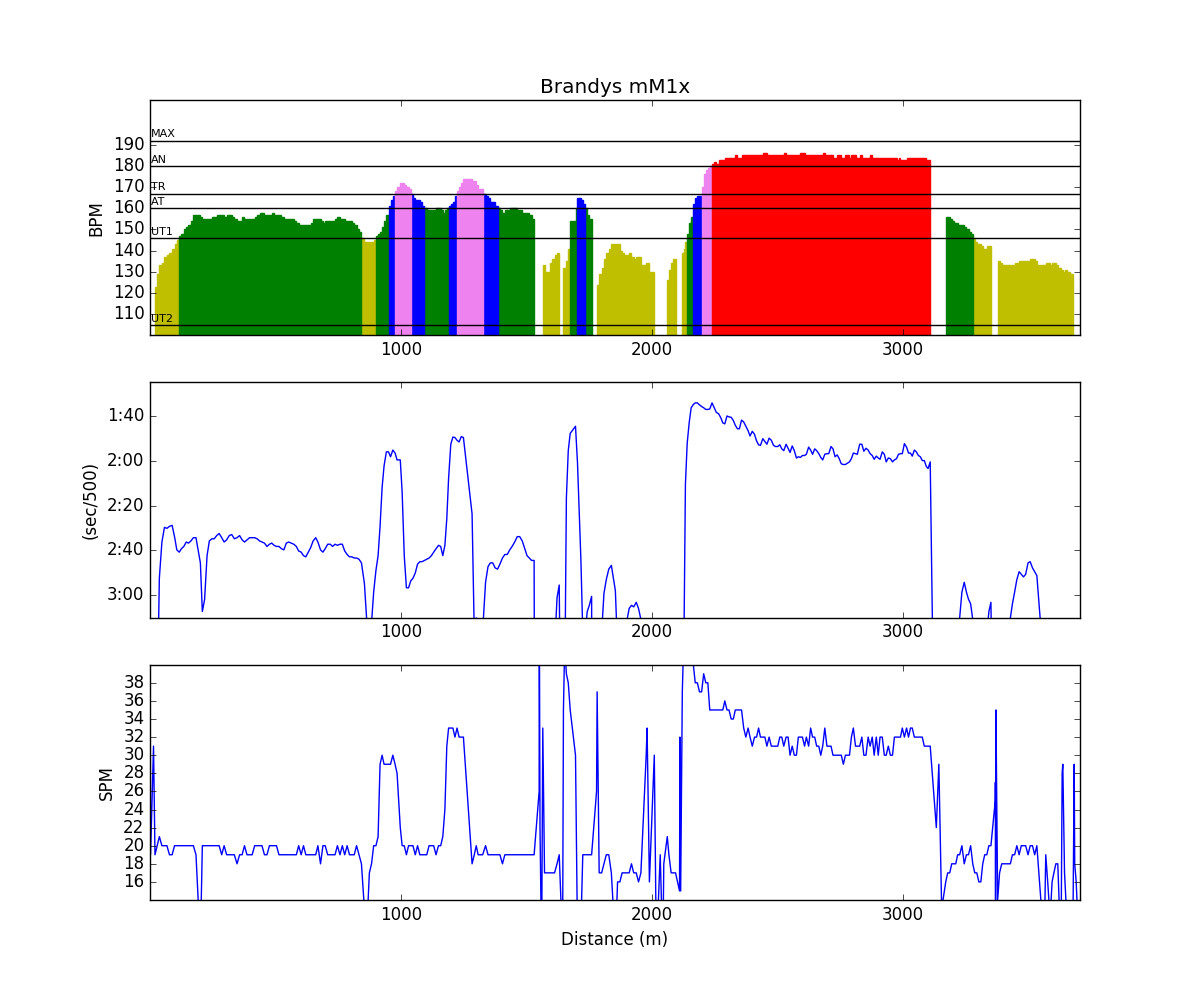
SportTracks has a power estimation for running. I am not sure how accurate it is, but here are a few interesting plots from the Training Analysis in SportTracks:
All power values calculated using the Power Runner plugin for SportTracks.
In another post, I am going to write about using Power data for Rowing.













Sep 18 2016
Power Measuring in Rowing – Book Review of “Training and Racing with a Power Meter” with a rowing angle
A few weeks ago, I ordered “Wattmessung im Radsport und Triathlon“, the German translation of the book “Training and Racing with a Power Meter” by Hunter Allen and Andrew Coggan.
[amazon_link asins=’1934030554′ template=’ProductAd’ store=’rowingdata-20′ marketplace=’US’ link_id=”]
The book is an interesting read for rowers, because I believe that power measurement systems for rowers are about to make the jump from Olympians (and state coaches) to the general rowing public, which means Masters rowers, and club and college programs. Regarding power measuring, rowing is a funny sport. On the erg, we have had power measurements for decennia, and since the Concept2 PM3 (and RowPro) we’ve had the ability to extract data from our rows and analyze them. On the water, we have nothing. We can measure speed with an impeller or a GPS unit, but data extraction was hard and analysis not really open to the general public. This may change in the near future.
Introduction – why Power measuring is cool
Cycling has been in the “dark” ages for a long time, but since power meter systems have become affordable, many riders use them. I have been reading through cycling and triathlon oriented discussion groups and there are many discussions on the use of power meters for training optimization, post-race analysis and other topics. A nice site to start to read about what’s available for cyclists is DC Rainmaker’s blog about triathlon/cycling tech.
An interesting parallel between cycling and rowing is that there are natural obstacles that make structured training messy. Where on the erg you can dial up your 8x500m and row like a machine, in OTW rowing there is wind, stream, turns, chop, coaching launches wakes and other things that make OTW rowing a bit more adventurous (and harder to quantify). Also, the length of your rowing water may make it difficult to row a straight 20 minute row. In cycling there are traffic lights, wind, climbs, descents, and other obstacles. Also here, it may be hard to execute a maximum effort 20 minute ride on flat terrain (unless you ride in a velodrome, of course).
In road cycling absolute speed doesn’t mean a lot. The introduction of the power meter gave cyclists data on average power, instantaneous power, average pedal force, and cadence. Finally some real data that could be compared from ride to ride. But because of the stochastic nature of the data (which is a fancy way of saying that there is a large random spread in the data), cyclists had to find ways to make the data collected with their power meters meaningful, using statistics. In rowing, these data will become available for those who invest in power measuring devices (like SmartOar, the products offered by Sweetzpot, and NK’s Empower Oarlock) and I think it is really time that rowers start basing their training analysis on power and force data, rather than on “splits”. Another good reason is that on the erg, the concept of “distance” and “split” is an illusion. The real thing that is measured is the force accelerating the flywheel and the power you put into keeping the flywheel spinning.
Therefore, it is very interesting to start looking at what is going on in the cycling world, and Allen and Hunter are a good starting point. With their backgrounds in training and sports science, being authors of many scientific publications, the metrics and plots they propose have a high probability of making sense. These are also the guys behind TrainingPeaks, the number one Triathlon On-line Workout log (which offers training analysis, training plans, and more in the paid version) and their principles are also used in the WKO+ and Golden Cheetah training analysis computer programs. In summary, their principles seem to be successful and widely adopted in the triathlon world.
The book review
The German edition is 388 pages full of text and graphs. It provides all the information a cyclist needs to start using a power meter. In the opening chapters, the authors explain what a cyclist can expect from using a power meter:
It then proceeds to give an overview of what types of power meters are available on the market and lists pros and cons of the different ones, as well as giving an overview of the software available for data analysis (with the longest review dedicated to the author’s own software WKO+ and trainingpeaks.com, while spending only a few words on Golden Cheetah).
I like how the book is set up. You can really read it chapter by chapter and dig deeper and deeper into the matter. In the previous chapters, the reader got all the information needed to decide what gadget to invest in and what software to use for the data analysis. In the next chapter, the authors introduce one of the first metrics that they have developed to characterize yourself as a cyclist. The “FTP” (Functional Threshold Power) is simply the maximum average power that you are able to hold for an hour. It’s a key characteristic, just as rowers talk about their 2k time.
There are several ways to measure FTP. A straightforward way would be to do a maximum effort 60 minute ride (hoping there will be no red traffic lights etc). The authors suggest to do a 20 minute ride, which may be more practical for most cyclists, and then multiply the obtained average power by 0.95. (More on this in the rowing section below). Another interesting way is to load all your rides into training software and let the computer filter out your best segments for different durations. The authors explain the “Critical Power” model that can be fitted to the data, which enables you to predict your 60 minute maximum effort, kind of how rowers use “Paul’s Law” to predict paces for various ranking pieces.
Having found your FTP, the authors explain how to determine your training zones. Every training guru, every sport, and every national team has its own definition of training zones, and the book is no exception. Power cyclists live in a world with 7 zones, which I will not name because I am sure I will translate the German names back to English differently than in the original English text. The authors do explain that the training spectrum is not boxed into zones but a continuum, and provide a nice table with main training effects of the different zones, where you can see that each zones addresses multiple training effects with more or less intensity.
In a subsequent chapter, detailed examples are given of how you can use your maximum average power effort for different exercise duration to do a qualitative analysis of your strengths and weaknesses.
Measuring training “impact” and planning it is done using a TSS (“Training Stress Score”) which is calculated from the power profile. It is not just the average power, but the authors use the average of the fourth power to give more weight to high intensity peaks. The TSS is normalized to your personal FTP, and used to calculate an average training impact over the past 7 and 40 days which then translate into measures for “fitness” and “freshness”, one of the core features of the TrainingPeaks approach. The method is much more detailed than I am writing here, and the authors give all equations that enable you to calculate the values yourself. I have personally been using a heart rate based approach, using heart rate as a proxy for power. It seems that one of the key “know how” of TrainingPeaks.com is that the site has a consistent way of calculating TSS for cross-training when no power data are available, using heart rate, or running speed, elevation, and your body weight for running. Graphs of “fitness” and “freshness” plotted over time can be used to analyze race performance in the light of your training preparation and the effectiveness of the taper, and this knowledge can be used by the athlete or coach to create an optimized personal training and taper plan to peak at important races.
Finally there is a ton of specialized graphs that are introduced and explained. Some of those analyses go into how you use your power during a race. Cycling is complicated with escapes and sprints. Rowing is much more about pacing well and sticking to your optimum pace.
A strong point of the book is that the authors find a good balance between introducing the concepts to readers who are less strong in the physics and sports science behind, but at the same time don’t shy away to lay out exactly what they are doing with equations and theory, both in the main text and in special boxes that go a bit deeper into a certain detail. Knowledge sharing as it is supposed to be. The book also has a glossary and list of acronyms that come in handy when you lose track of the jargon. The only thing that is missing is a reference list of publications that provide the scientific background for readers who are into reading the primary sources. A few pages of references at the end of each chapter would have been nice. Less interested readers could just skip those pages.
Quadrant Analysis
A big concept is “Quadrant Analysis”, where a scatter plot of pedal rotation speed (m/s) vs average pedal force is used. The concept of power is “force x velocity”, and so there are different ways to achieve, say, a 300W average power. You can pedal fast at low force, or slow at high force. There are four quadrants:
For cycling, this makes a lot of sense, especially as you can chose your gear during a ride, so it is useful to know what you have done in training, and what works best for you.
Would I recommend the book to rowers? Yes! I think it is very important to keep your eyes open to what people in other sports are doing. Cycling and triathlon have the numbers of athletes that rowing can never achieve, so it is easier to see the trends and (but this is more tricky) to see what works and doesn’t work. Some parts of the book are less relevant, but especially triathletes are strong in pacing strategies, which is extremely relevant for rowing.
Also, it seems that the bike sports are much further in using sports science for individual athletes, not only the top performers. In contrast, I see many rowing programs still using training philosophies that are 20 or 30 years old, especially with Masters rowers (who continue to train like they used to when they were young) and small clubs with amateur coaches (who coach like they were coached back in the days). There is nothing wrong with that, as long as you can defend what you are doing in the light of what is currently known about training.
Power Training in Rowing
How would I see the methods of the book applied in rowing? For one, it would be great if rowers start to talk about the power they can hold for a certain amount of time. I think it is a much cleaner concept than talking about a pace for a certain distance, which mingles the concepts. First, there is only a virtual distance and a virtual pace on the erg, and second, the better you are, the shorter your 2k time. So, for a young girl with a 9 minute 2k, it is much more an aerobic affair than for the young man with a 6:15 erg score. Instead of comparing 2k times, the athletes should compare power of a 5 minute (or a 10 or 30 minute) interval.
Races will still be over a fixed (virtual) distance, and the fastest (in time) will win. But for comparing rowing abilities, I would say that the time / power based measure is better. On rowsandall.com, I am starting to implement a few tools that make it easier to do this.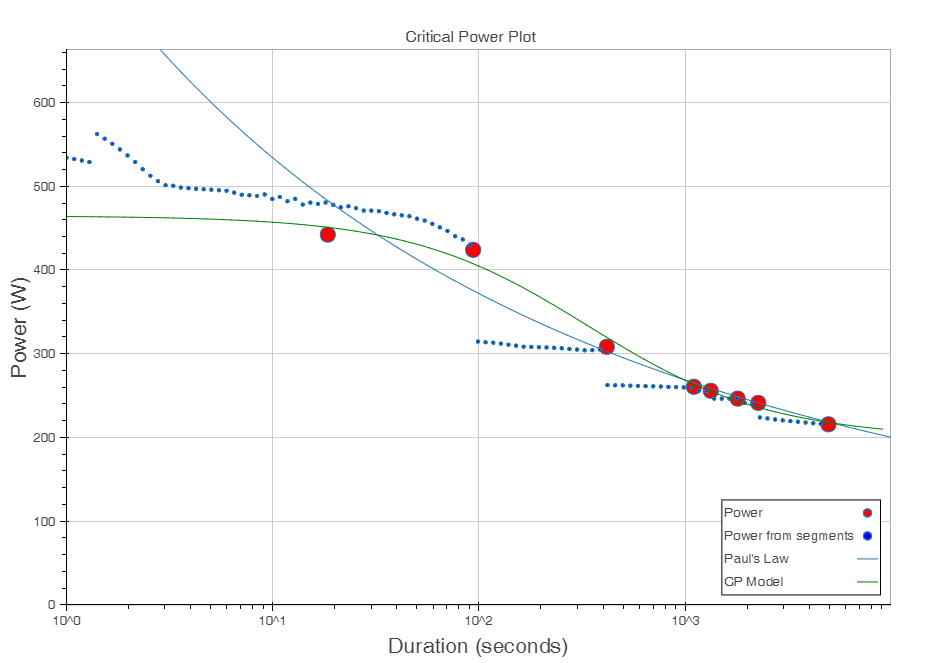
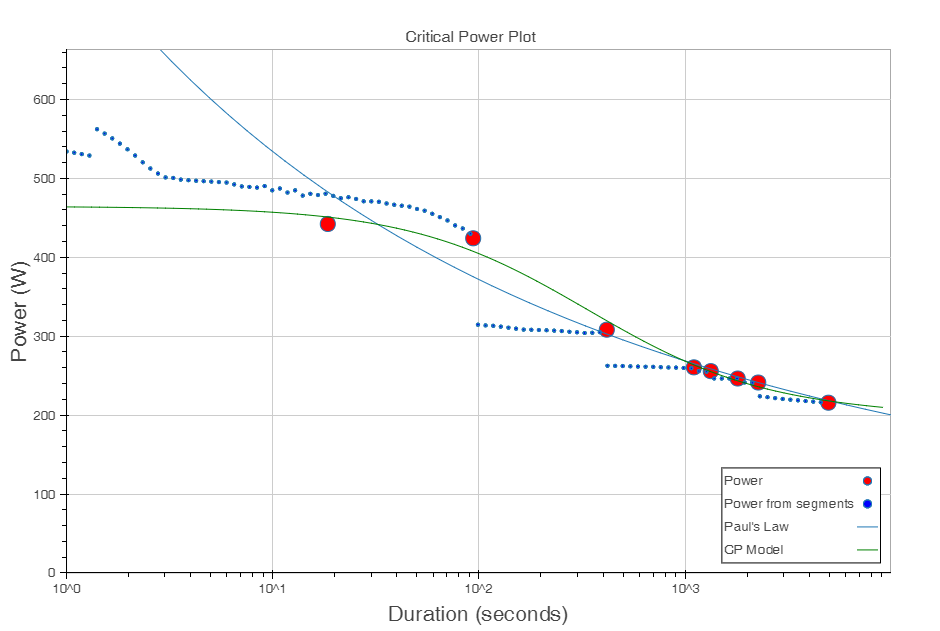
In the plot above, for example, the red dots show a few of my ranking pieces rowed in the past 12 months, a 100m, a 500m, 2k, 5k, 6k, 30 min, 10k and half marathon row on the erg. The blue line is Paul’s law fitted to the data, the green line is a Critical Power model similar to what is used in the book. On the site, you can see what the two models predict for all Concept2 ranking pieces, plus a piece of your choice. I know there are many pace predictors out there, but I think this is a nice and graphical one (as long as you have enough data uploaded to the site). As a bonus, the blue dots are taken from shorter segments of my own rows, showing for example, that I have a 100m interval in the middle of my 500m effort which was faster than my 100m piece. I guess you can see the effect of a standing start here, but for the 2-10k pieces this can give interesting insights.
Another thing that I noticed, is that my 20 minute power is not at 105% of the 60 minute power but at 116%. I suspect that the shape of the power/duration curve may be different for rowing compared to bike riding.
Nonathlon does a nice job of comparing your individual scores to the “gold standard” for your age, using world records and ranking scores collected on the Concept2 Logbook pages, but I am thinking about incorporating a Watts based comparison to the site. Here is an attempt in excel:
Here are a few other things that I may implement. I am not fully convinced of the usefulness of each of the plots for analysis, but my philosophy is to allow each and everyone to make any analysis he likes. All plots are taken from a single 4x2km interval erg session (both work and rest intervals), but in principle they could be made for all data accumulated on the site, or comparing two similar workouts. The plots have been inspired by the kind of analysis done in the book. Some of the data are currently only available for users of Painsled, an iOS app in beta.
That’s it for today. More thoughts will follow. I hope to get some feedback in the comments section of this blog post.
By sanderroosendaal • Uncategorized • 10 Comments • Tags: cycling, OTE, OTW, power, power based training, rowing, training