Monday was a rest day which I really really needed. I just walked around at work, had a good lunch, and happily worked while my body (hopefully) worked on repairing muscle damage, repleneshing energy stores, and all the good stuff that causes the training effect.
This morning I had a Steady State row scheduled, but I allowed myself a bit of Play Time with New Rowing Gadget. I have been playing with the Quiske System since I received it a week ago, but due to racing I hadn’t gotten around trying the Quiske sensor under the seat. I do have a strict “No New Gadgets During Races” rule, you know. I only add electronics with proven benefits. Also, this Masters rower cannot process more than 2 numbers, maybe three, during a race, so sticking with stroke rate and power, and perhaps one additional variable, is my mantra.
What is the Quiske System? Here’s a picture of the elements, taken just before this morning’s outing:
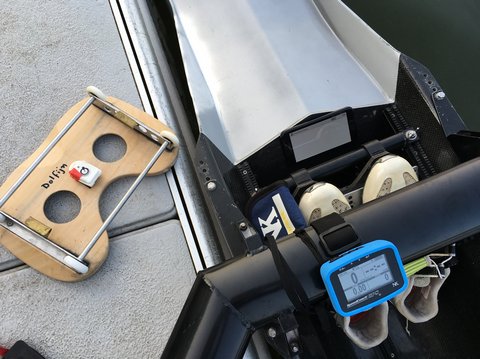
Ignore the big blue SpeedCoach. Behind my footstretcher you see an Android phone running the RowP app. This app does a similar thing as RowinginMotion. It measures all the usual rowing parameters (pace, stroke rate, etc) but it also records boat speed and boat acceleration curves. After the row, you can see your sessions on the web portal, and select ranges of strokes to look at acceleration curves. The innovation is the sensor pod under my seat. Yes, that little white thingy with the Quiske logo. The red part is a piece of tape. The holder for the sensor pod was slightly damaged, so I added some reduncancy. That sensor pod connects to the RowP app through Bluetooth and it measures the seat acceleration. If you put the sensor on your oar, which can also be done, you can measure your stroke length, oar angular acceleration, and the oar vertical movement.
Very cool.
So how can all this make you faster? I personally think this is a multi step process. You can look at the curves while rowing, but chances are you have no clue about what is a “good” curve. The way out, I think, is to just record, upload the data to the portal, and look at the results. Then, try to correlate them back to per-stroke metrics like stroke length, work per stroke, etc, and look at the influence on boat speed. Video analysis has a role as well. Only by combining these analysis methods you can find what the curve means. Then, if you’re lucky, you will find that a certain characteristic wiggle or spike in your boat acceleration curve is related to a jerky hands away movement. And only after you have established that link, you can start using the in-boat display of the curve for direct feedback. (By the way, on the picture above, I could not even use the display for direct feedback, because it was out of the field of view, hidden behind the wing rigger. I have a better mount on order to solve that problem.)
Another thing that I like about the Quiske system is that it enables you to measure “actionable” metrics. Things like “catch efficiency”, “check”, “catch duration” are interesting numbers, but they are hard to relate to something that you can feel and control in the boat. I prefer things like stroke length, handle speed and acceleration or seat speed and acceleration. I can imagine working on speeding up or slowing down the seat during the recovery, or eliminating bum shoving during the drive. They are things rowers can feel and coaches can see.
So, to play with the system, I added a few 20 stroke bursts to my steady state training, and the end result looked like this:
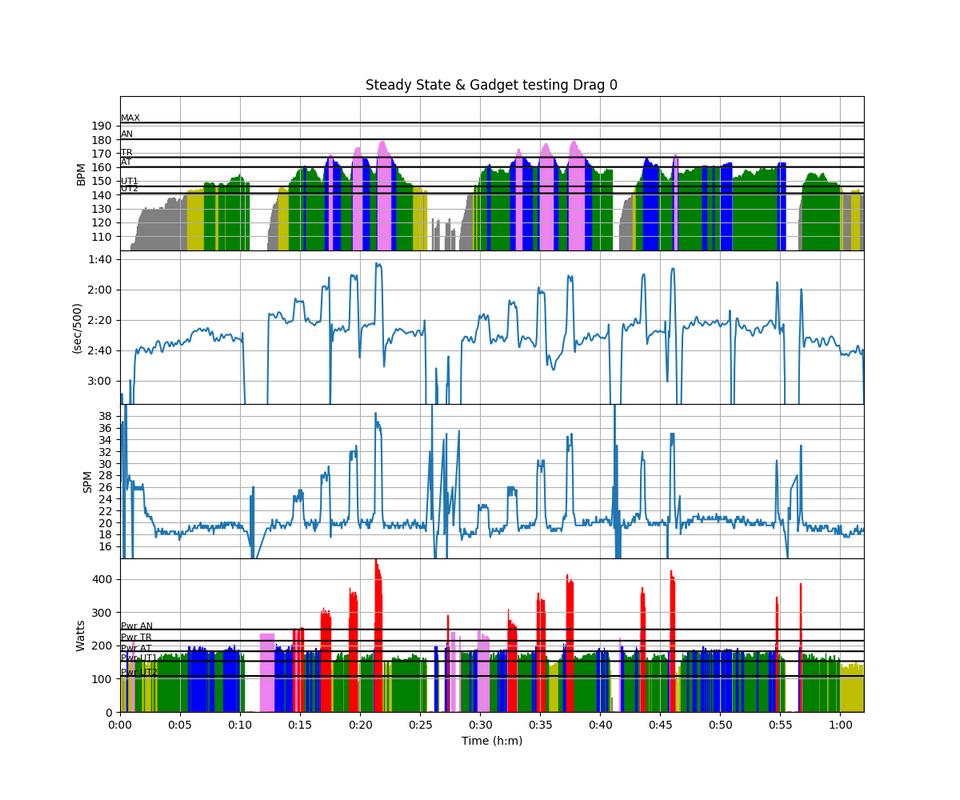
Just about 8% of the workout time was thus spent somewhere else than in the UT1/UT2 power band. The bursts were short enough that perhaps the only metabolic thing would be a temporary lactate spike, which then would be nicely burnt in the subsequent UT1 interval.
And … here are the charts:
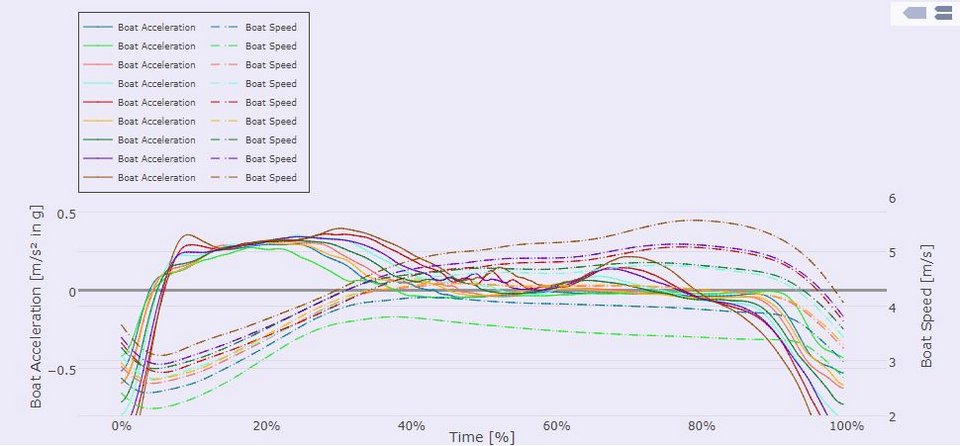
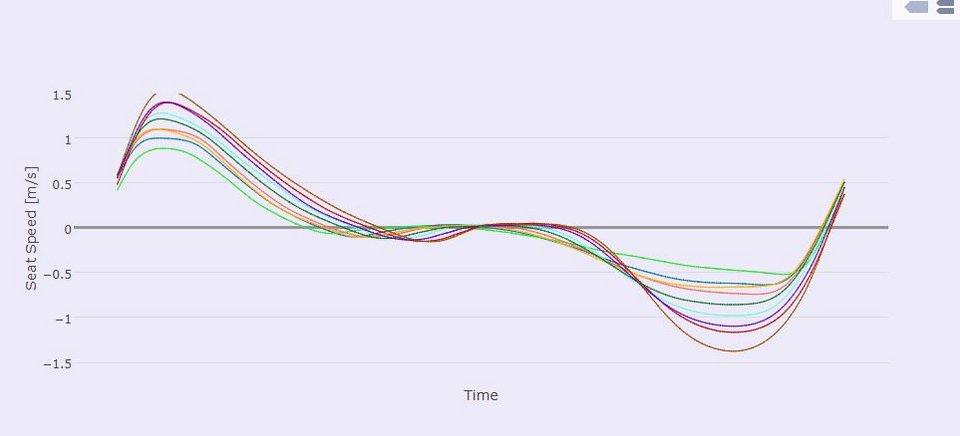

I am not going to go into deep analysis at the moment and I am not going to make any statement about impact on boat speed. The boat speed numbers are impacted by the wind anyway, as 22, 26, 30 and 34spm were rowed in headwind and 24, 28, 32 and 36spm were rowed in tailwind conditions.
Just a few observations:
-
Peak accelaration at the start of the drive becomes more pronounced with increasing stroke rate, as does a second peak towards the end of the drive, when my body is slowing down on the slide and the momentum is transferred to the shell
-
A lot of small acceleration peaks at the end of the drive, start of the recovery. I hypothesize that they are related to back swing, arms away, recovery back swing.
-
The clear division between slow and fast stroke rates in the recovery acceleration profile. They are totally different rowing strokes, as rating up involves speeding up on the recovery, which leads to a boat surge
-
A period during the drive where the seat speed is negative. Back swing, probably. Good, or bad? I am making a note to reread Kleshnev to see if he mentions this.
-
In the recovery, I am trying to accelerate slightly into the catch. I think I see that in the data, but it is not very pronounced at higher stroke rates. Again, I have no idea how strong an effect to expect, so I am not going to say if these curves are good or bad.
I think it is great that we have both Quiske and RowinginMotion. At first glance they are similar, but the details are different. RiM can be expanded through a 1.000,- EURO sensor box, while Quiske is expanded through the 299,- EURO sensor pod. The pricing for the Analytics platform is similar. I am not going to make a full comparison table, as I think that both solutions have a roadmap of new features that are going to be added continuously, so let’s see how the systems evolve.
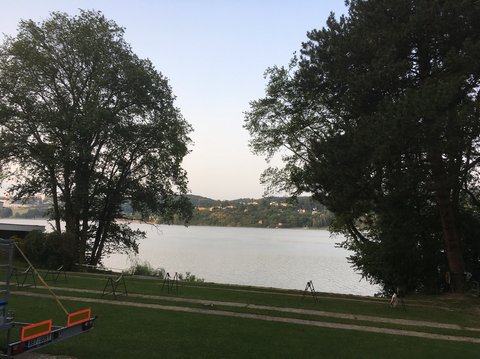
Oh, and this is how our rowing club and lake presented themselves this morning. Long sleeve temperatures, but o so beautiful.
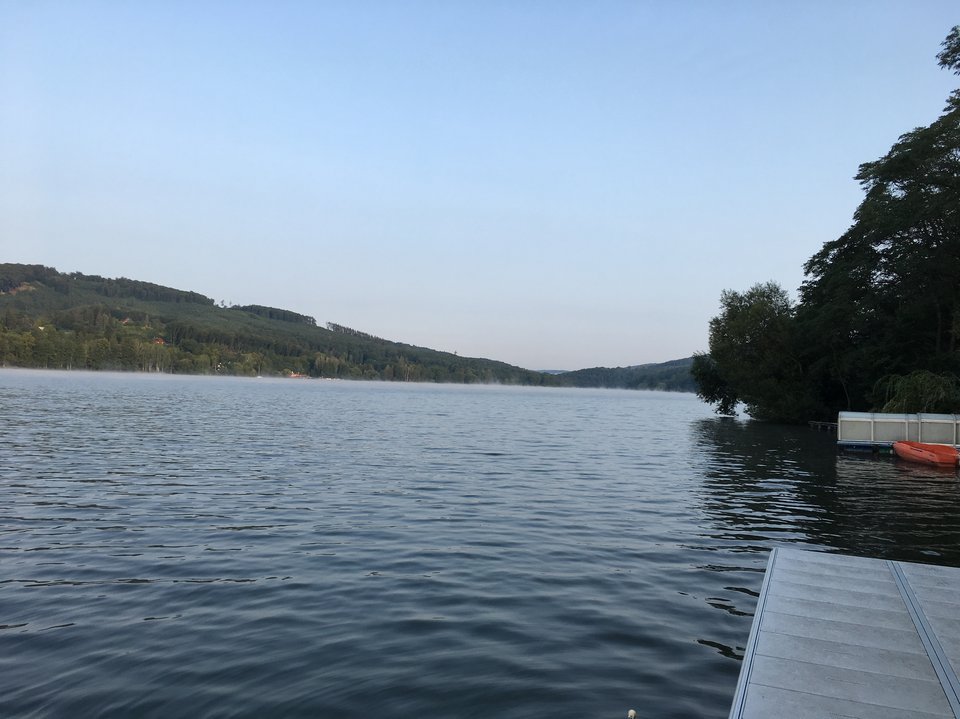
Yes, that is morning mist over the water.
[amazon_link asins=’B01GQW2FKI’ template=’ProductAd’ store=’rowingdata-20′ marketplace=’US’ link_id=’aa8af7dc-8735-11e7-b696-2f5da947664e’]
Follow me in social media
Like this:
Like Loading...
Aug 22 2017
New Sensor Test – Boat and Seat Acceleration
Monday was a rest day which I really really needed. I just walked around at work, had a good lunch, and happily worked while my body (hopefully) worked on repairing muscle damage, repleneshing energy stores, and all the good stuff that causes the training effect.
This morning I had a Steady State row scheduled, but I allowed myself a bit of Play Time with New Rowing Gadget. I have been playing with the Quiske System since I received it a week ago, but due to racing I hadn’t gotten around trying the Quiske sensor under the seat. I do have a strict “No New Gadgets During Races” rule, you know. I only add electronics with proven benefits. Also, this Masters rower cannot process more than 2 numbers, maybe three, during a race, so sticking with stroke rate and power, and perhaps one additional variable, is my mantra.
What is the Quiske System? Here’s a picture of the elements, taken just before this morning’s outing:
Ignore the big blue SpeedCoach. Behind my footstretcher you see an Android phone running the RowP app. This app does a similar thing as RowinginMotion. It measures all the usual rowing parameters (pace, stroke rate, etc) but it also records boat speed and boat acceleration curves. After the row, you can see your sessions on the web portal, and select ranges of strokes to look at acceleration curves. The innovation is the sensor pod under my seat. Yes, that little white thingy with the Quiske logo. The red part is a piece of tape. The holder for the sensor pod was slightly damaged, so I added some reduncancy. That sensor pod connects to the RowP app through Bluetooth and it measures the seat acceleration. If you put the sensor on your oar, which can also be done, you can measure your stroke length, oar angular acceleration, and the oar vertical movement.
Very cool.
So how can all this make you faster? I personally think this is a multi step process. You can look at the curves while rowing, but chances are you have no clue about what is a “good” curve. The way out, I think, is to just record, upload the data to the portal, and look at the results. Then, try to correlate them back to per-stroke metrics like stroke length, work per stroke, etc, and look at the influence on boat speed. Video analysis has a role as well. Only by combining these analysis methods you can find what the curve means. Then, if you’re lucky, you will find that a certain characteristic wiggle or spike in your boat acceleration curve is related to a jerky hands away movement. And only after you have established that link, you can start using the in-boat display of the curve for direct feedback. (By the way, on the picture above, I could not even use the display for direct feedback, because it was out of the field of view, hidden behind the wing rigger. I have a better mount on order to solve that problem.)
Another thing that I like about the Quiske system is that it enables you to measure “actionable” metrics. Things like “catch efficiency”, “check”, “catch duration” are interesting numbers, but they are hard to relate to something that you can feel and control in the boat. I prefer things like stroke length, handle speed and acceleration or seat speed and acceleration. I can imagine working on speeding up or slowing down the seat during the recovery, or eliminating bum shoving during the drive. They are things rowers can feel and coaches can see.
So, to play with the system, I added a few 20 stroke bursts to my steady state training, and the end result looked like this:
Just about 8% of the workout time was thus spent somewhere else than in the UT1/UT2 power band. The bursts were short enough that perhaps the only metabolic thing would be a temporary lactate spike, which then would be nicely burnt in the subsequent UT1 interval.
And … here are the charts:
I am not going to go into deep analysis at the moment and I am not going to make any statement about impact on boat speed. The boat speed numbers are impacted by the wind anyway, as 22, 26, 30 and 34spm were rowed in headwind and 24, 28, 32 and 36spm were rowed in tailwind conditions.
Just a few observations:
I think it is great that we have both Quiske and RowinginMotion. At first glance they are similar, but the details are different. RiM can be expanded through a 1.000,- EURO sensor box, while Quiske is expanded through the 299,- EURO sensor pod. The pricing for the Analytics platform is similar. I am not going to make a full comparison table, as I think that both solutions have a roadmap of new features that are going to be added continuously, so let’s see how the systems evolve.
Oh, and this is how our rowing club and lake presented themselves this morning. Long sleeve temperatures, but o so beautiful.
Yes, that is morning mist over the water.
[amazon_link asins=’B01GQW2FKI’ template=’ProductAd’ store=’rowingdata-20′ marketplace=’US’ link_id=’aa8af7dc-8735-11e7-b696-2f5da947664e’]
Follow me in social mediaShare this:
Like this:
By sanderroosendaal • Uncategorized • 1 • Tags: OTW, quiske, rowing, single, steady state, training