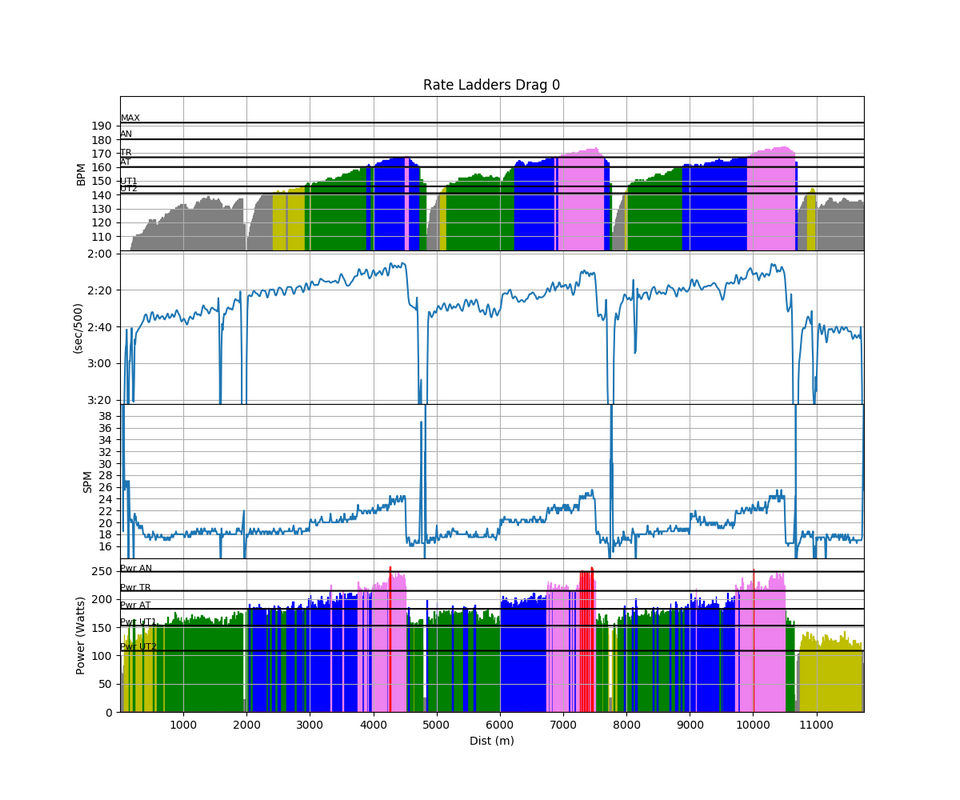
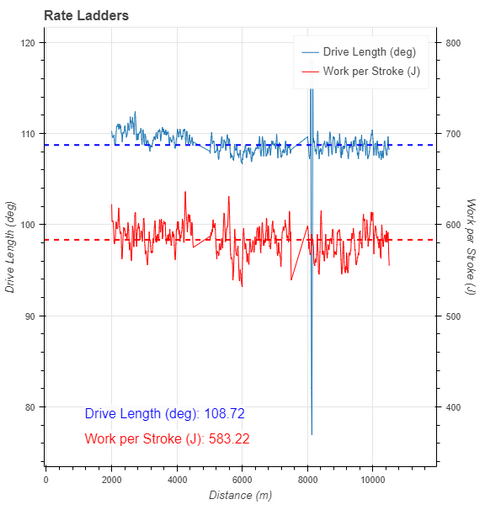
I managed to get to the lake before work, but not early enough to do more than a 12k workout. I actually think that is a good thing, because I was still feeling tired from Monday’s Pete Plan Pyramid (OTW version). The plan called for steady state (16k) but I decided to use the shorter format to spice it up slightly. I went for rate ladders. Our lake is a little under 3km long from “Rokle” to “Sirka”. (You can actually do a full length 3k if you row from “behind Rokle”, but then you have a turn at the beginning.) So I decided to do 1k/750m/500m/250m/rest of lake at 18spm/20spm/22spm/24spm/16spm. So I would gradually rate up, trying to hold just under 600 J on the Work per Stroke metric (Empower Oarlock), until a 250m at 24spm, and then I would fall down to 16spm, while still holding 600J, until I ran out of lake. A turn, sip of water, repeat.
Workout Summary - media/20170801-093716-Sanders SpeedCoach 20170801 0653amo.csv

--|Total|-Total-|--Avg--|-Avg-|Avg-|-Avg-|-Max-|-Avg

--|Dist-|-Time--|-Pace--|-Pwr-|SPM-|-HR--|-HR--|-DPS

--|11751|61:24.0|02:36.8|170.9|20.2|147.5|175.0|09.5

W-|10252|50:02.0|02:26.4|177.0|20.0|147.1|175.0|10.3

R-|01500|11:22.0|03:47.5|120.8|20.4|144.1|175.0|00.0

Workout Details

#-|SDist|-Split-|-SPace-|-Pwr-|SPM-|AvgHR|MaxHR|DPS-

00|02000|11:16.1|02:49.0|141.4|20.4|121.0|139.0|08.7

01|01000|04:40.3|02:20.1|181.4|18.5|139.4|149.0|11.6

02|00750|03:22.5|02:15.0|198.1|20.3|152.3|158.0|10.9

03|00500|02:09.9|02:09.9|218.4|22.2|161.6|165.0|10.4

04|00250|01:03.2|02:06.3|239.7|23.8|166.7|167.0|10.0

05|01000|04:58.4|02:29.2|172.6|17.9|150.4|155.0|11.2

06|00750|03:35.6|02:23.7|196.7|20.3|160.9|166.0|10.3

07|00500|02:17.7|02:17.7|216.7|22.3|168.7|171.0|09.8

08|00250|01:05.1|02:10.2|242.2|24.5|172.4|173.0|09.4

09|01000|04:42.3|02:21.2|176.3|18.3|154.4|162.0|11.6

10|00750|03:26.0|02:17.4|191.2|20.1|163.4|166.0|10.9

11|00500|02:11.5|02:11.5|219.0|22.2|169.6|173.0|10.3

12|00250|01:03.9|02:07.8|236.8|24.3|173.6|175.0|09.6

13|00752|04:09.8|02:46.1|115.1|17.9|134.6|138.0|10.1
As the water was mirror flat, and the temperature just after sunrise a nice 22 degrees C, it just required a bit of concentration to hit those numbers:
Just for fun, here is the distribution of strokes in terms of power and pace:
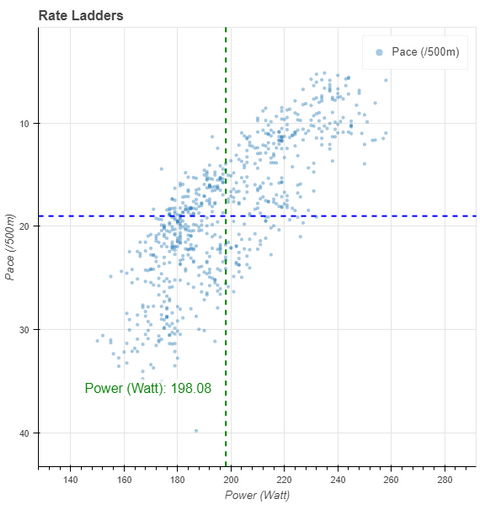
There was a slight wind when I started (tailwind in the first set, headwind in the second) but the wind strength was decreasing as the session progressed. I think that explains the spread of pace values.
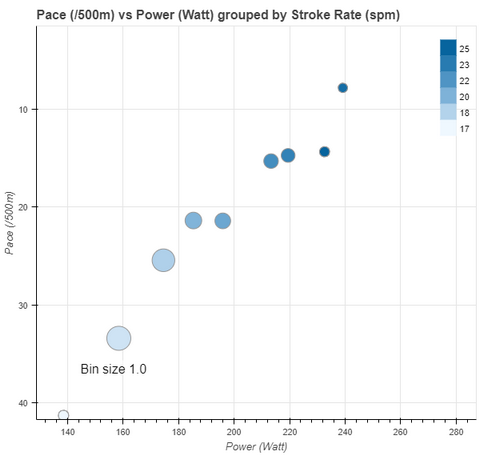
The Trend Flex chart averages all that out:
Monitoring the Work per Stroke over the past three months, here is the Box Chart of Work per Stroke for all strokes in the 15 to 25 spm range with more than 400 J (to eliminate paddle strokes):
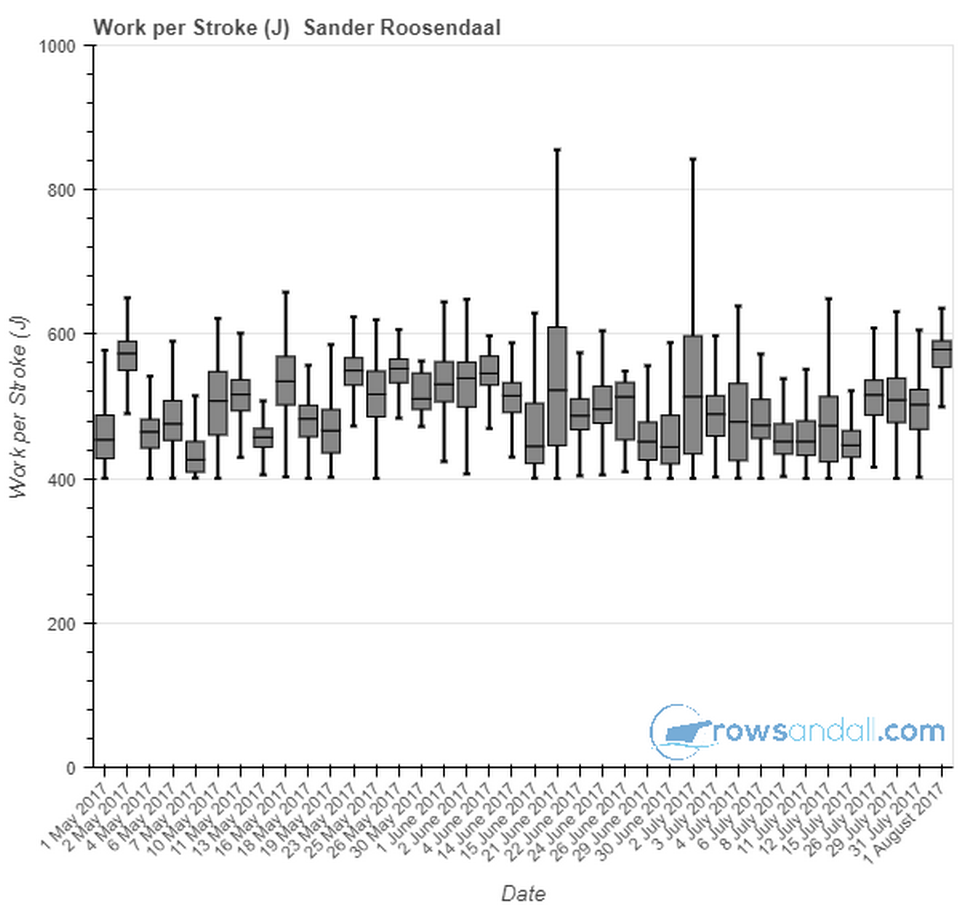
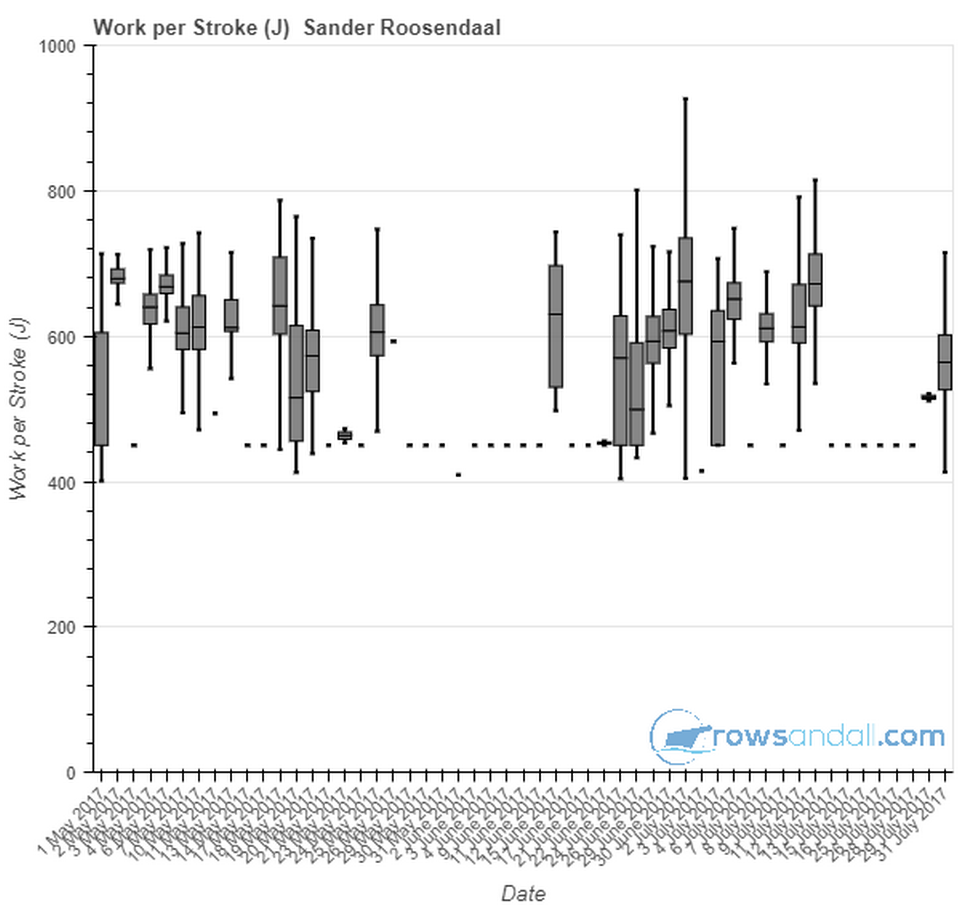
Perhaps “just under 600 J” is a bit too much and my natural stroke should be in the 500-550J range? Looking at the trend for race pace strokes (chart below), I have been rowing them at a higher Work per Stroke. Wrongly, perhaps?
Anyway, glad that I have the data allowing me to ask those questions.
Follow me in social media
Like this:
Like Loading...
Aug 1 2017
Rate Ladders
I managed to get to the lake before work, but not early enough to do more than a 12k workout. I actually think that is a good thing, because I was still feeling tired from Monday’s Pete Plan Pyramid (OTW version). The plan called for steady state (16k) but I decided to use the shorter format to spice it up slightly. I went for rate ladders. Our lake is a little under 3km long from “Rokle” to “Sirka”. (You can actually do a full length 3k if you row from “behind Rokle”, but then you have a turn at the beginning.) So I decided to do 1k/750m/500m/250m/rest of lake at 18spm/20spm/22spm/24spm/16spm. So I would gradually rate up, trying to hold just under 600 J on the Work per Stroke metric (Empower Oarlock), until a 250m at 24spm, and then I would fall down to 16spm, while still holding 600J, until I ran out of lake. A turn, sip of water, repeat.
Workout Summary - media/20170801-093716-Sanders SpeedCoach 20170801 0653amo.csv
--|Total|-Total-|--Avg--|-Avg-|Avg-|-Avg-|-Max-|-Avg
--|Dist-|-Time--|-Pace--|-Pwr-|SPM-|-HR--|-HR--|-DPS
--|11751|61:24.0|02:36.8|170.9|20.2|147.5|175.0|09.5
W-|10252|50:02.0|02:26.4|177.0|20.0|147.1|175.0|10.3
R-|01500|11:22.0|03:47.5|120.8|20.4|144.1|175.0|00.0
Workout Details
#-|SDist|-Split-|-SPace-|-Pwr-|SPM-|AvgHR|MaxHR|DPS-
00|02000|11:16.1|02:49.0|141.4|20.4|121.0|139.0|08.7
01|01000|04:40.3|02:20.1|181.4|18.5|139.4|149.0|11.6
02|00750|03:22.5|02:15.0|198.1|20.3|152.3|158.0|10.9
03|00500|02:09.9|02:09.9|218.4|22.2|161.6|165.0|10.4
04|00250|01:03.2|02:06.3|239.7|23.8|166.7|167.0|10.0
05|01000|04:58.4|02:29.2|172.6|17.9|150.4|155.0|11.2
06|00750|03:35.6|02:23.7|196.7|20.3|160.9|166.0|10.3
07|00500|02:17.7|02:17.7|216.7|22.3|168.7|171.0|09.8
08|00250|01:05.1|02:10.2|242.2|24.5|172.4|173.0|09.4
09|01000|04:42.3|02:21.2|176.3|18.3|154.4|162.0|11.6
10|00750|03:26.0|02:17.4|191.2|20.1|163.4|166.0|10.9
11|00500|02:11.5|02:11.5|219.0|22.2|169.6|173.0|10.3
12|00250|01:03.9|02:07.8|236.8|24.3|173.6|175.0|09.6
13|00752|04:09.8|02:46.1|115.1|17.9|134.6|138.0|10.1
As the water was mirror flat, and the temperature just after sunrise a nice 22 degrees C, it just required a bit of concentration to hit those numbers:
Just for fun, here is the distribution of strokes in terms of power and pace:
There was a slight wind when I started (tailwind in the first set, headwind in the second) but the wind strength was decreasing as the session progressed. I think that explains the spread of pace values.
The Trend Flex chart averages all that out:
Monitoring the Work per Stroke over the past three months, here is the Box Chart of Work per Stroke for all strokes in the 15 to 25 spm range with more than 400 J (to eliminate paddle strokes):
Perhaps “just under 600 J” is a bit too much and my natural stroke should be in the 500-550J range? Looking at the trend for race pace strokes (chart below), I have been rowing them at a higher Work per Stroke. Wrongly, perhaps?
Anyway, glad that I have the data allowing me to ask those questions.
Follow me in social mediaShare this:
Like this:
By sanderroosendaal • Uncategorized • 1 • Tags: analysis, OTW, power analysis, rate ladders, rowing, steady state, training