Nov 30 2015
Torture Variations
It’s one thing that we regularly torture our bodies to misery. Let that pass. But torturing it always in exactly the same way, that goes too far.
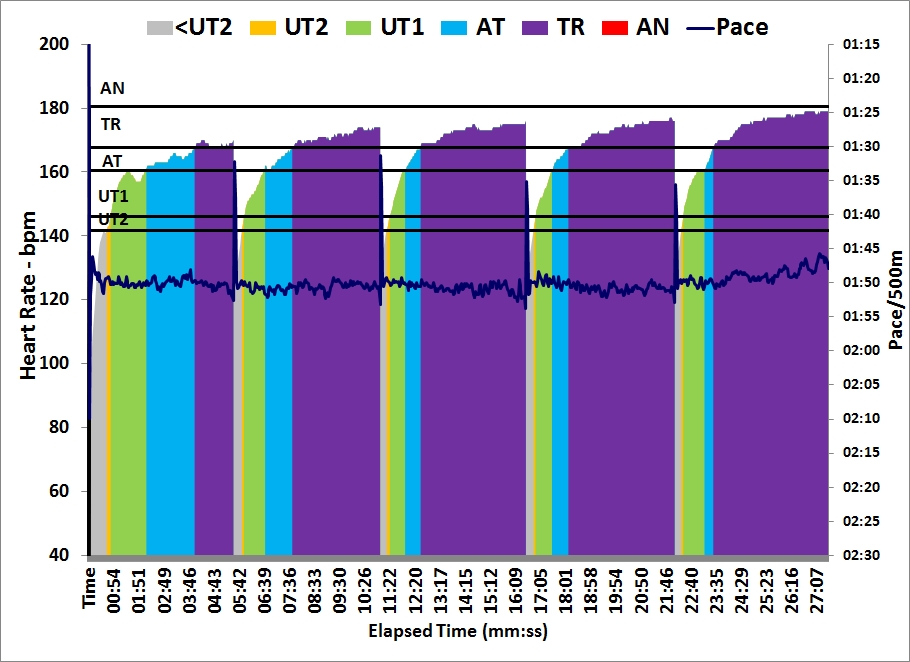
So even though I keep coming back to the interval sessions from the Wolverine Plan (and the Pete Plan), this year I make an effort to vary how I row them. Today I tried red-lining (or perhaps purple-lining, looking at my heart rate). Next time it may be positive splitting. Or do a full out 2k in the first interval, then try to minimize the damage in the following ones. The method behind the madness is to avoid staleness, and there are even training theories based on physiology that support this. Surprise your metabolic systems …
The target was 1:52.9 which didn’t seem too hard, but I have come to respect these 4x2km sessions. You cross the line and suddenly you are at risk of not finishing the session.
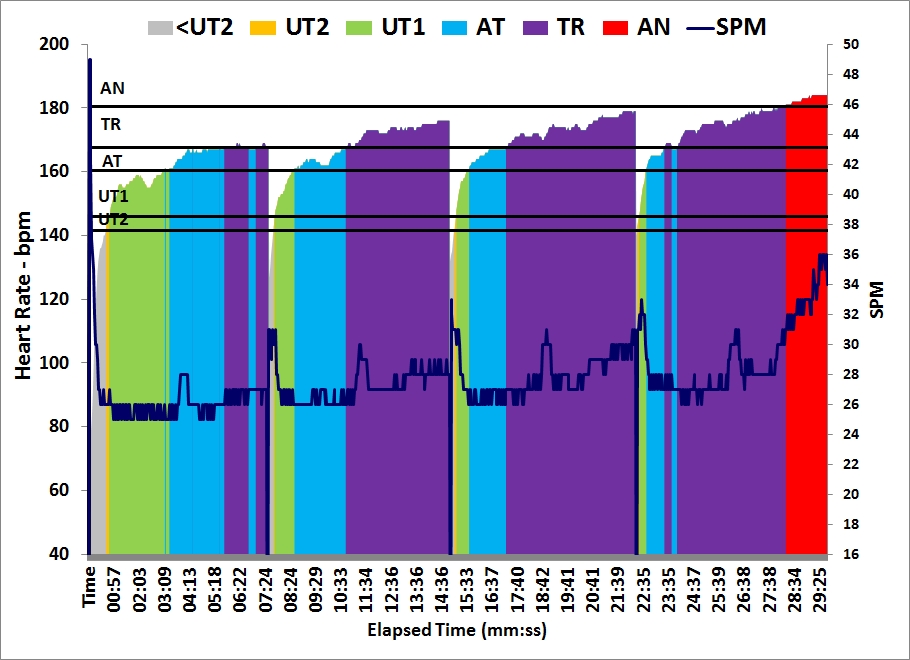
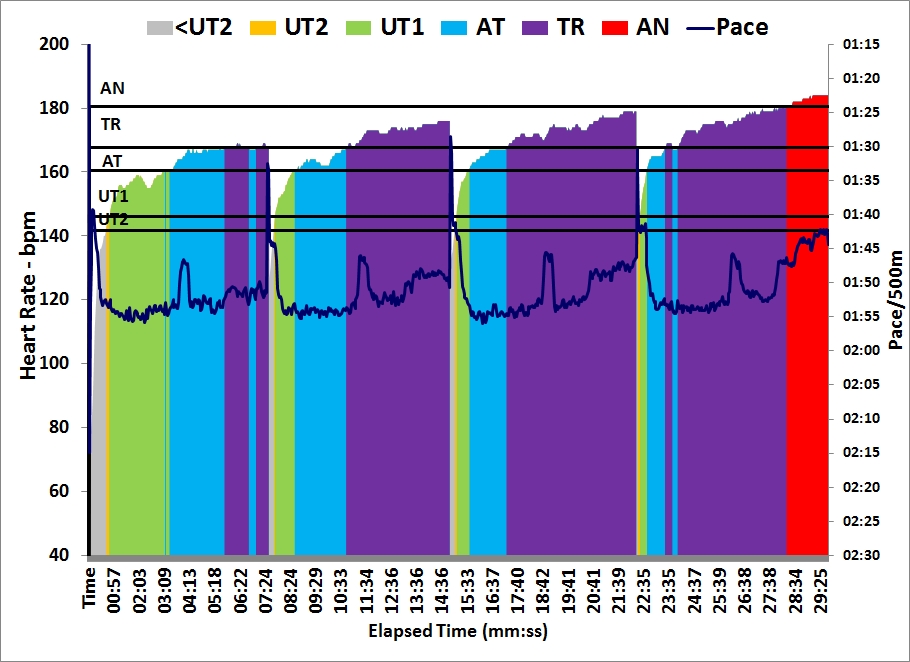
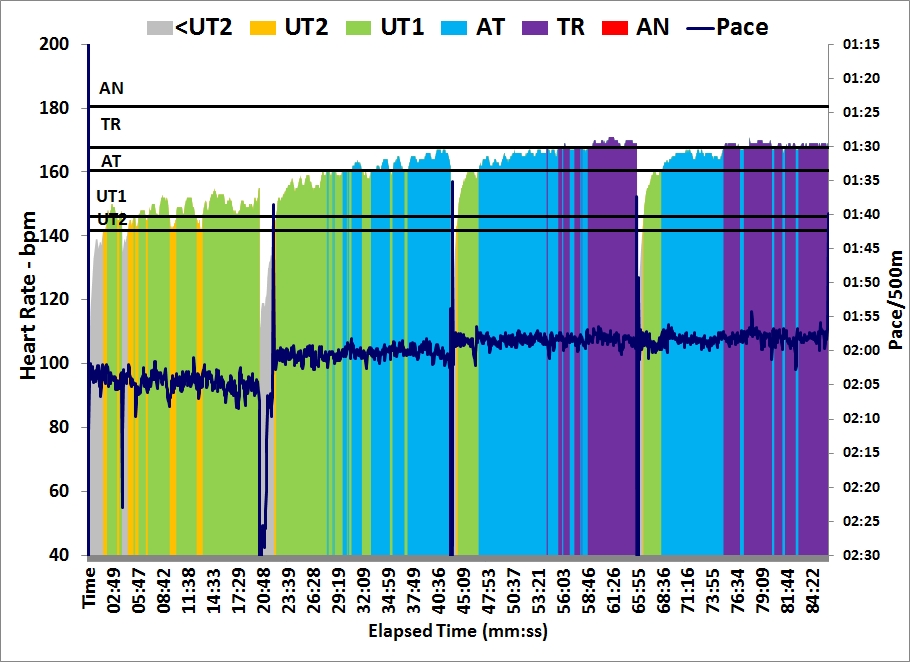
The pictures tell the full story better than the summary table. Basically I went into each 2km with 10 hard strokes at 1:40 pace, then slowed down. From the second interval onward this left me gasping for air with about 1890 meters to go. Then I would try to recover. At the half way point I did 10 hard strokes (1:47 pace), and with 500m to go I would do 50 hard strokes (1:48-1:50 pace). The final interval was of course a special one, with everything one or two seconds of split faster and a crazy acceleration in the final 500m, to squeeze out everything.
Workout Summary - Nov 30, 2015
--|Total|-Total-|--Avg--|-Avg-|Avg-|-Avg-|-Avg
--|Dist-|-Time--|-Pace--|Watts|SPM-|-HR--|-DPS
--|08000|29:40.3|01:51.3|254.1|27.6|167.6|09.8
Workout Details
#-|EDist|-Etime-|-SPace-|Watts|SPM-|AvgHR|DPS-|Comments
01|02000|07:29.9|01:52.5|246.0|26.3|158.0|10.2|
02|04000|14:56.0|01:51.5|252.3|27.3|167.2|09.9|
03|06000|22:20.7|01:51.2|254.6|27.9|170.0|09.7|
04|08000|29:40.3|01:49.9|263.8|29.1|174.6|09.4|
Average pace: 1:51.3. Nice. Haven’t done this session this fast before. In the 2014/15 winter, I managed 1:51.6.
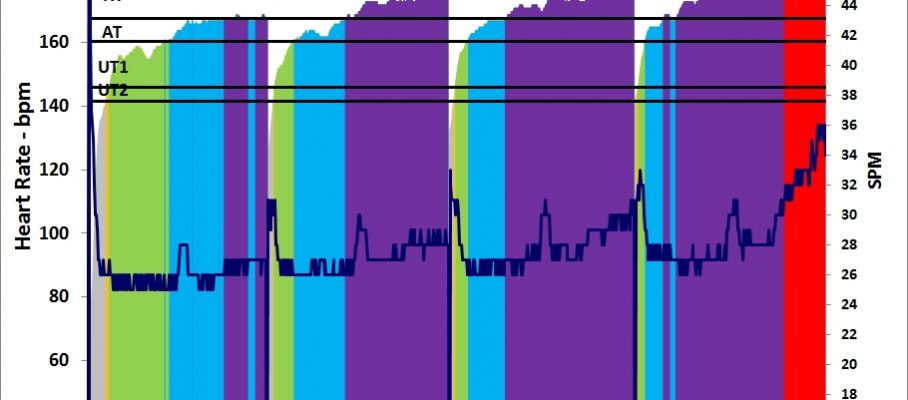
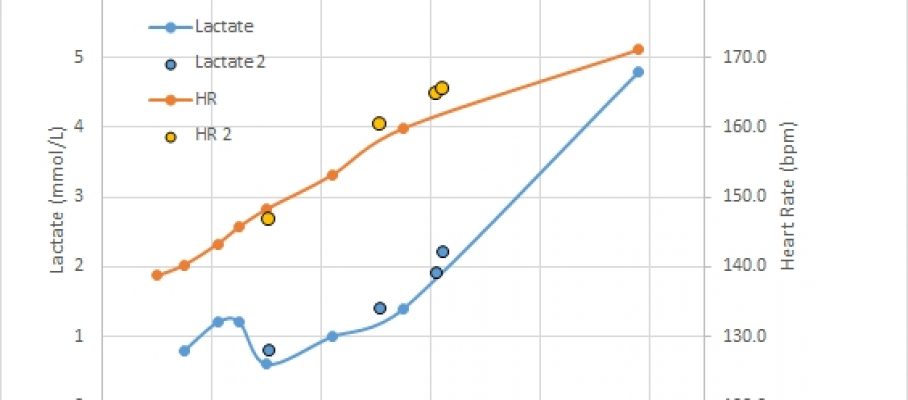
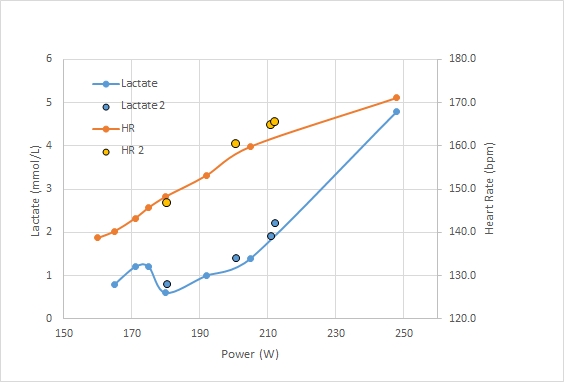
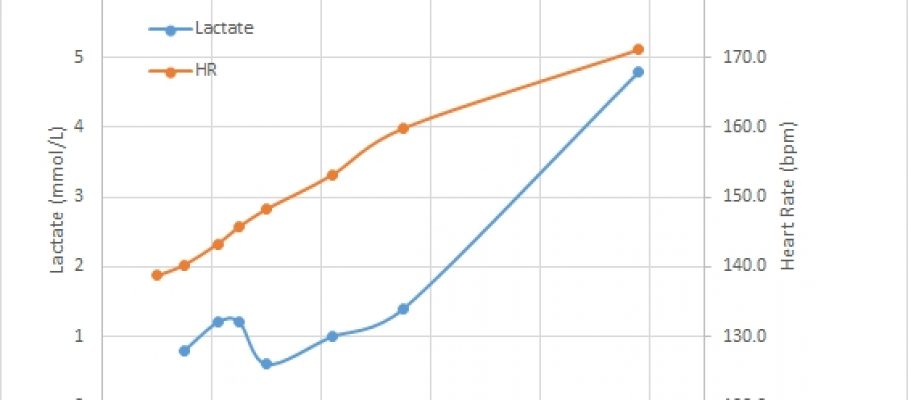
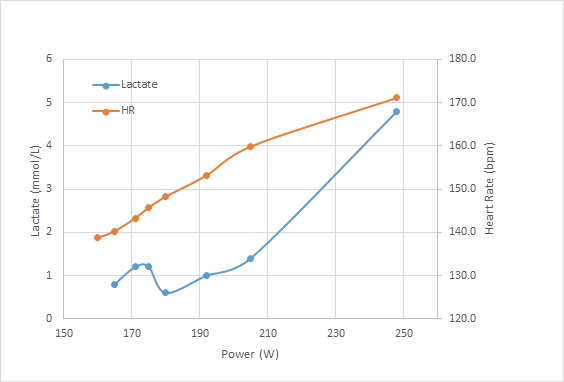
That brings me to my final thought of the day, on steady state intensity again. Since I started measuring lactate I have started to think I can increase their intensity to 200W. One thing is to stay below 2.0 mmol/L in these sessions, but another requirement will be that the steady state intensity is low enough that I can be sharp for the harder sessions.



Dec 1 2015
Another Steady State Data Point
Today I ignored lesson 1 for steady state sessions. If it is supposed to be a UT2 or UT1 session, it is not supposed to feel like hard work. If it does, you should back down, reduce the intensity, or even just stop and take a rest day.
For science (or rather for my curiosity as my method lacks scientific rigor), I pushed on.
A lot of things were different today, compared to the steady state sessions that I measured lactate on so far:
I did a 3×20 min tonight with a lactate measurement after the last 20 minute interval.
I warmed up for 5 minutes.
First interval didn’t feel too bad. I slowly ramped up the power for the first 10 minutes and ended up doing a 190W on average.
I rowed the second interval with an eye on the clock. It seemed endless. I knew I was working harder than I want to work in steady state sessions, but after 10 minutes funnily the pace started to drift to 210W and I had to consciously keep it down. Still, my breathing and the feeling in my legs told me I was working too hard.
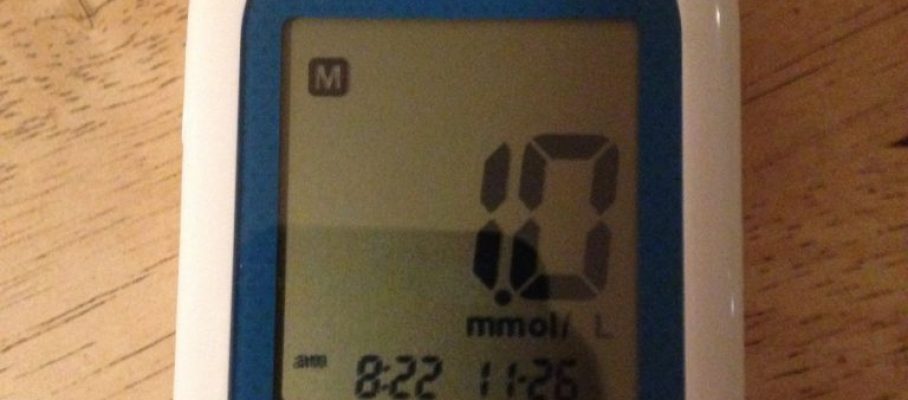
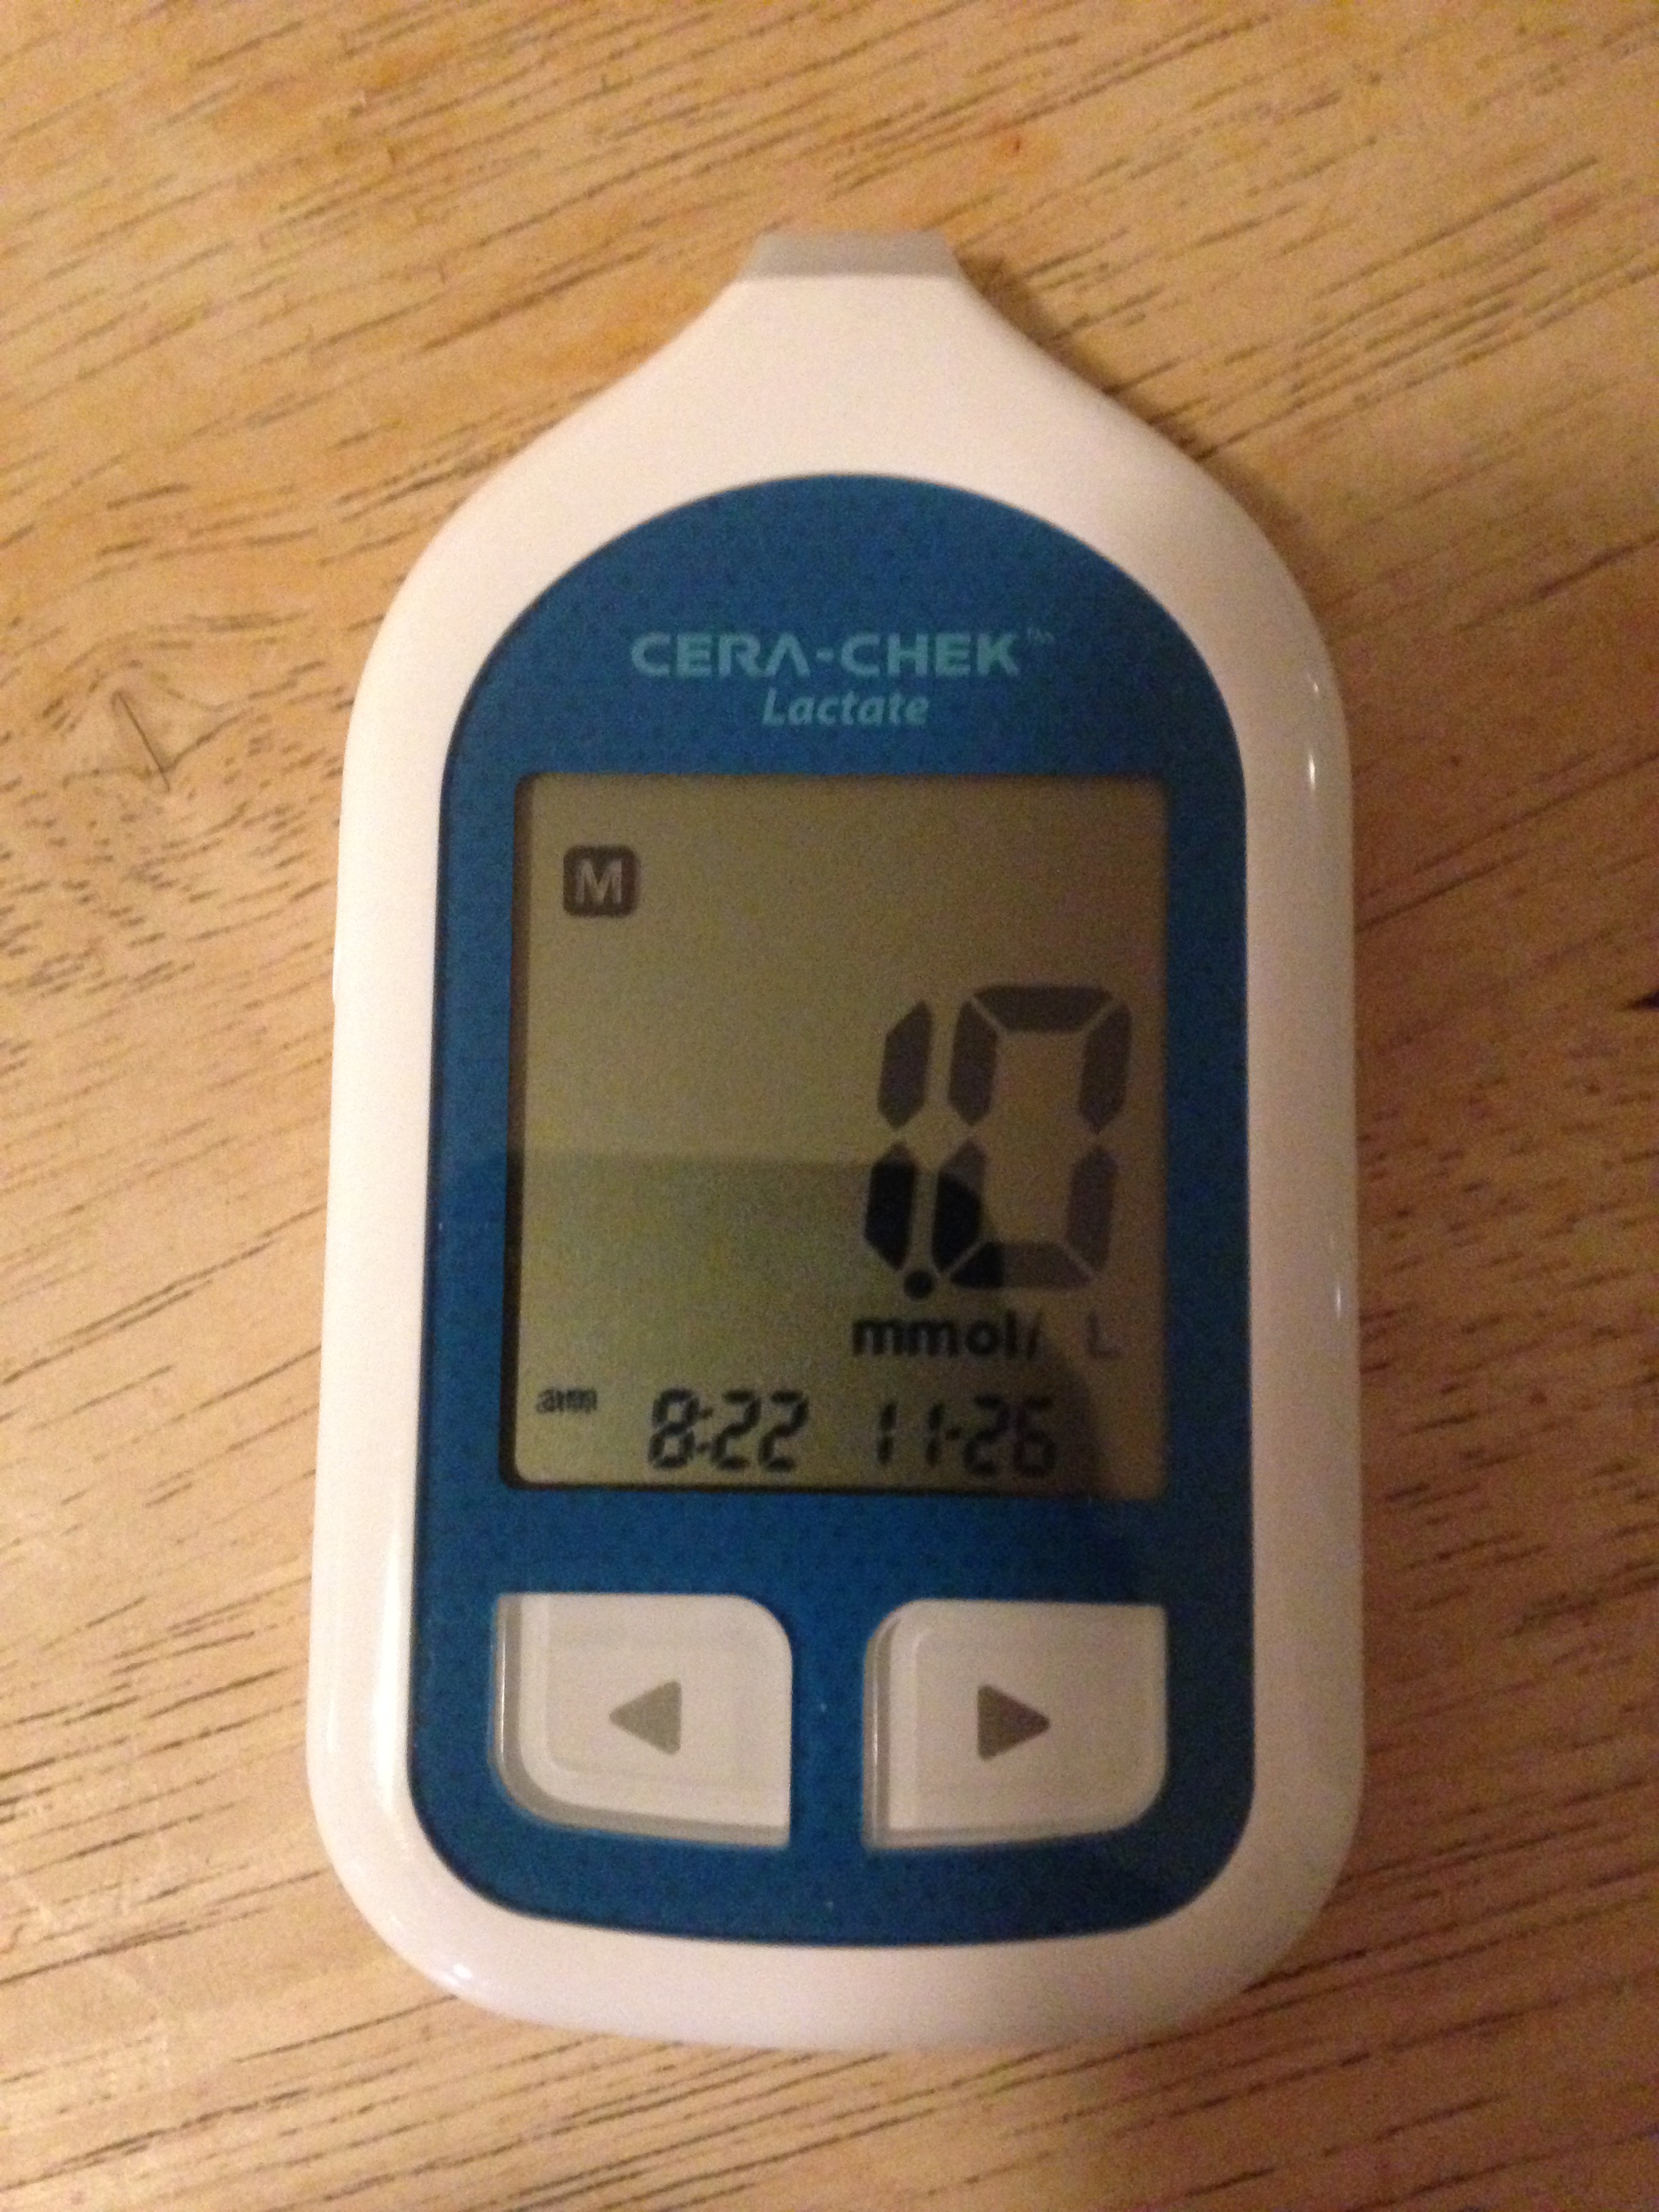
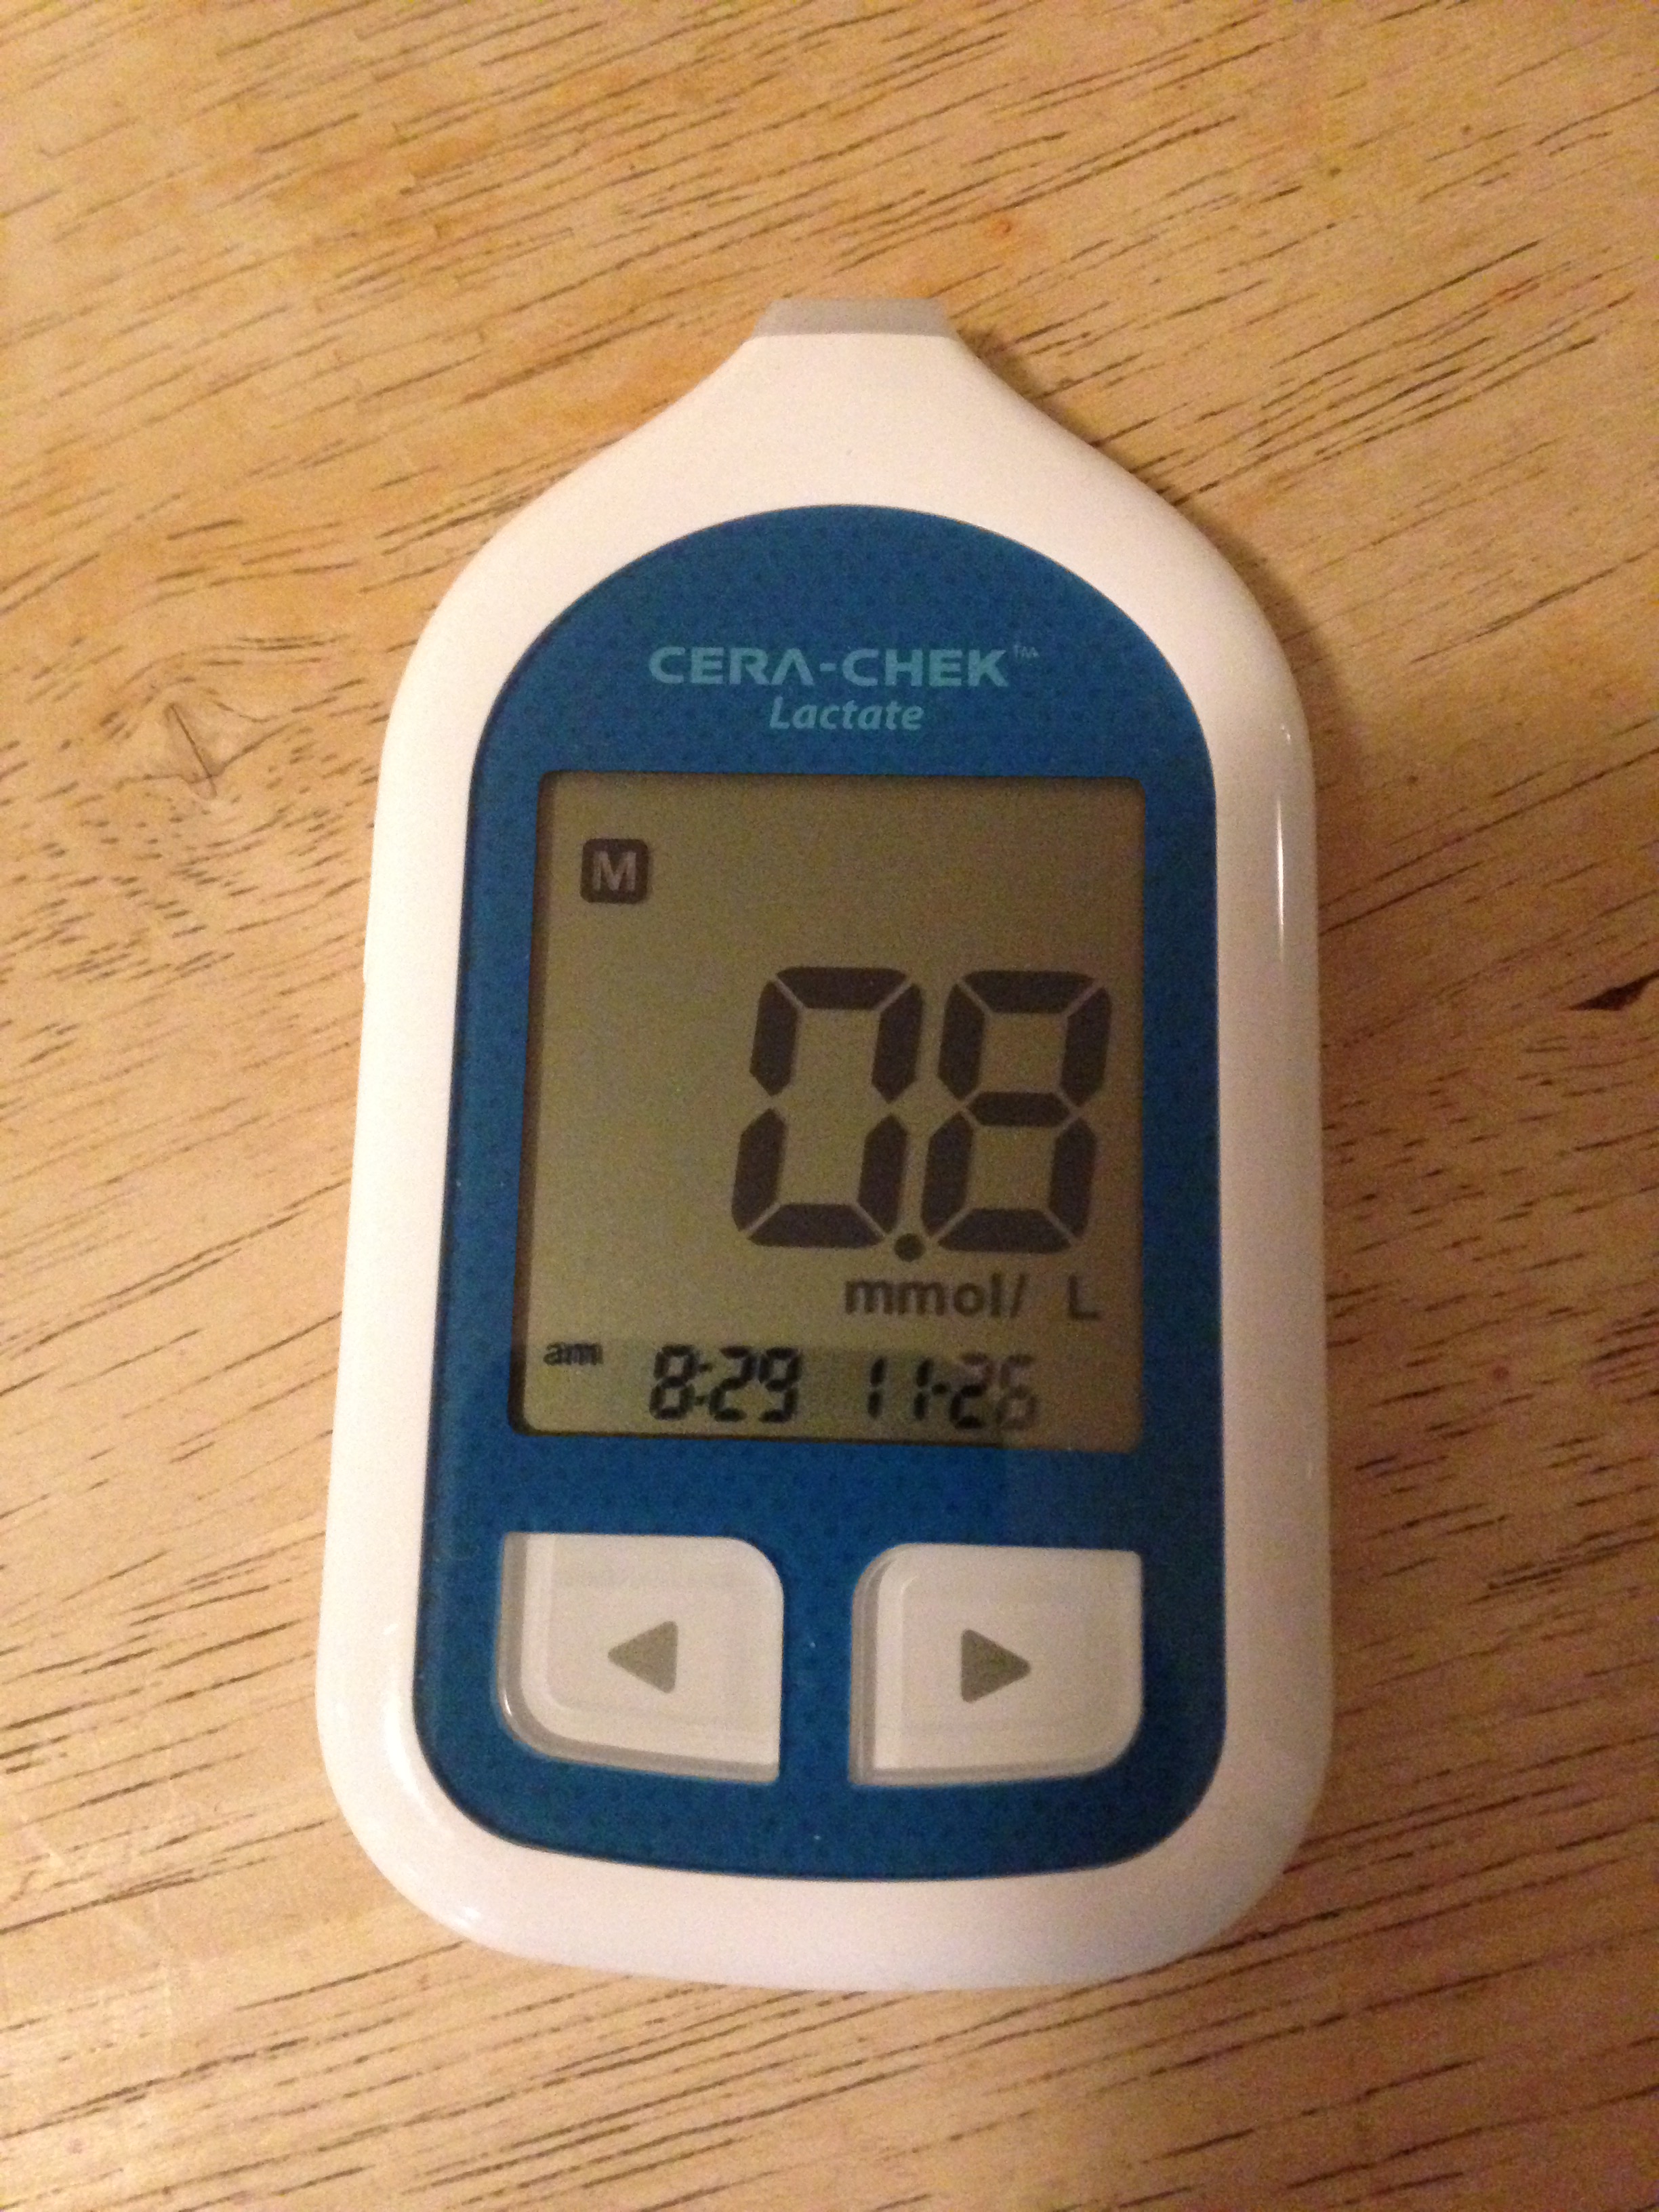
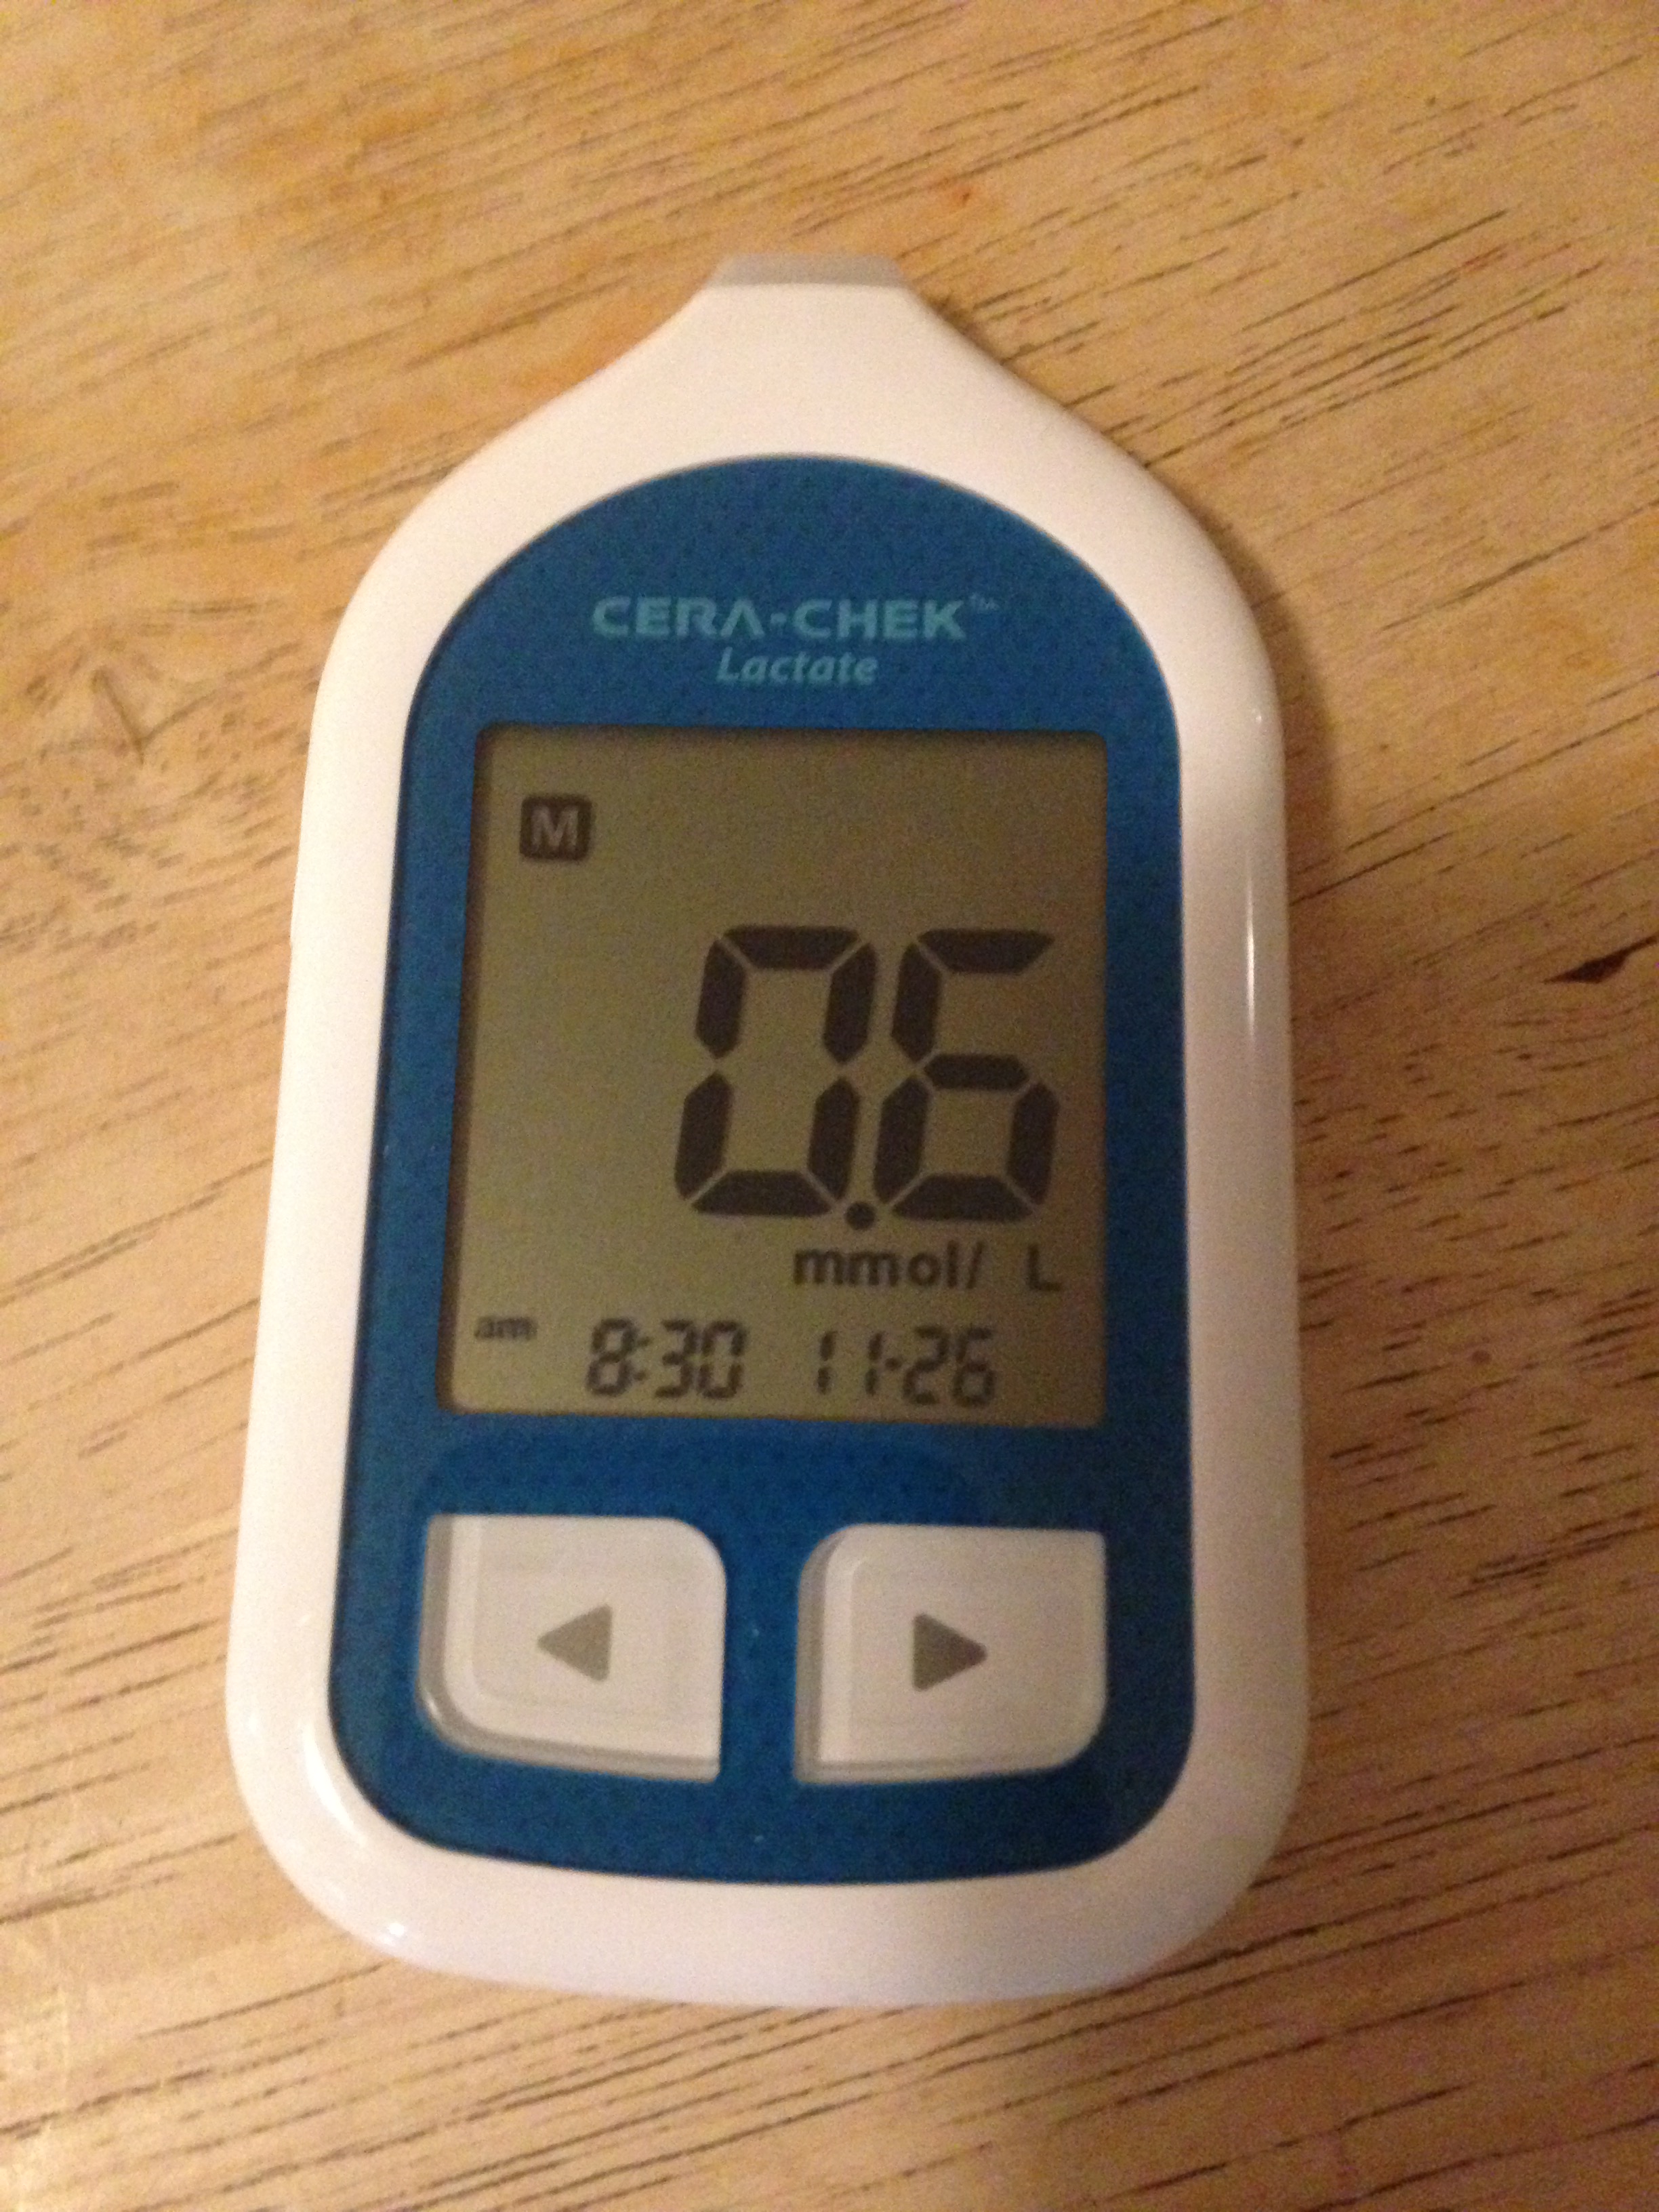
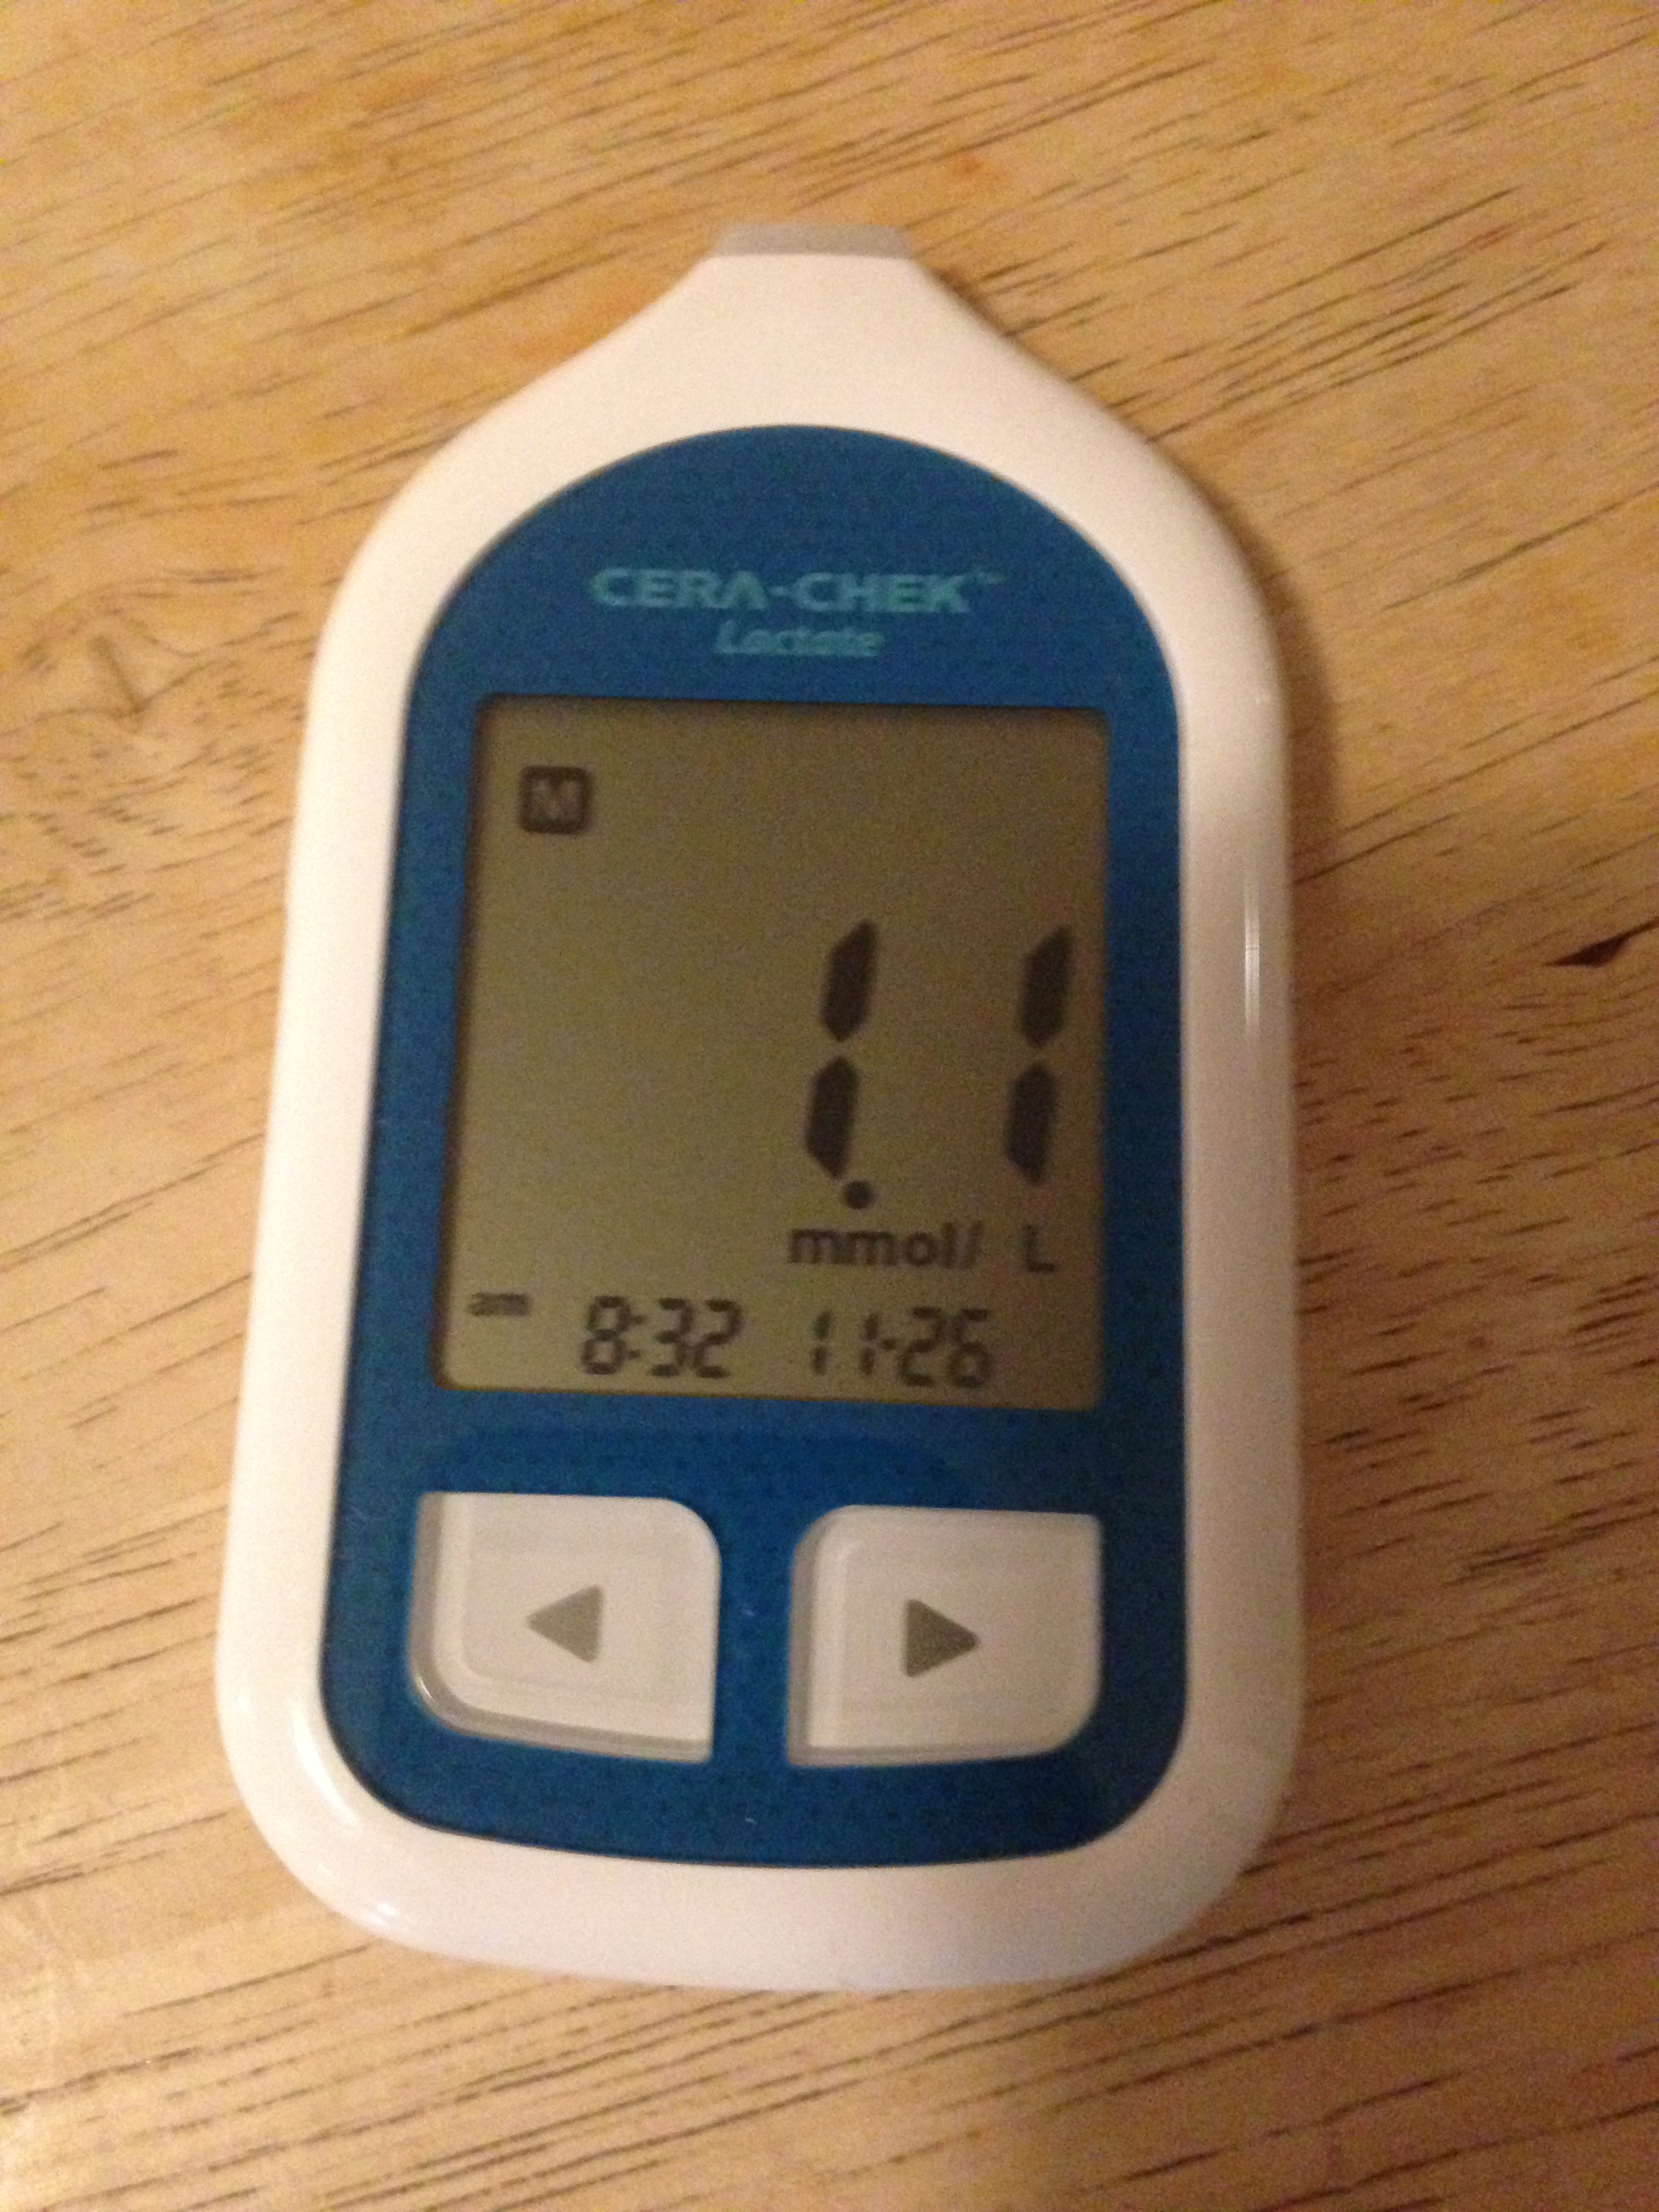
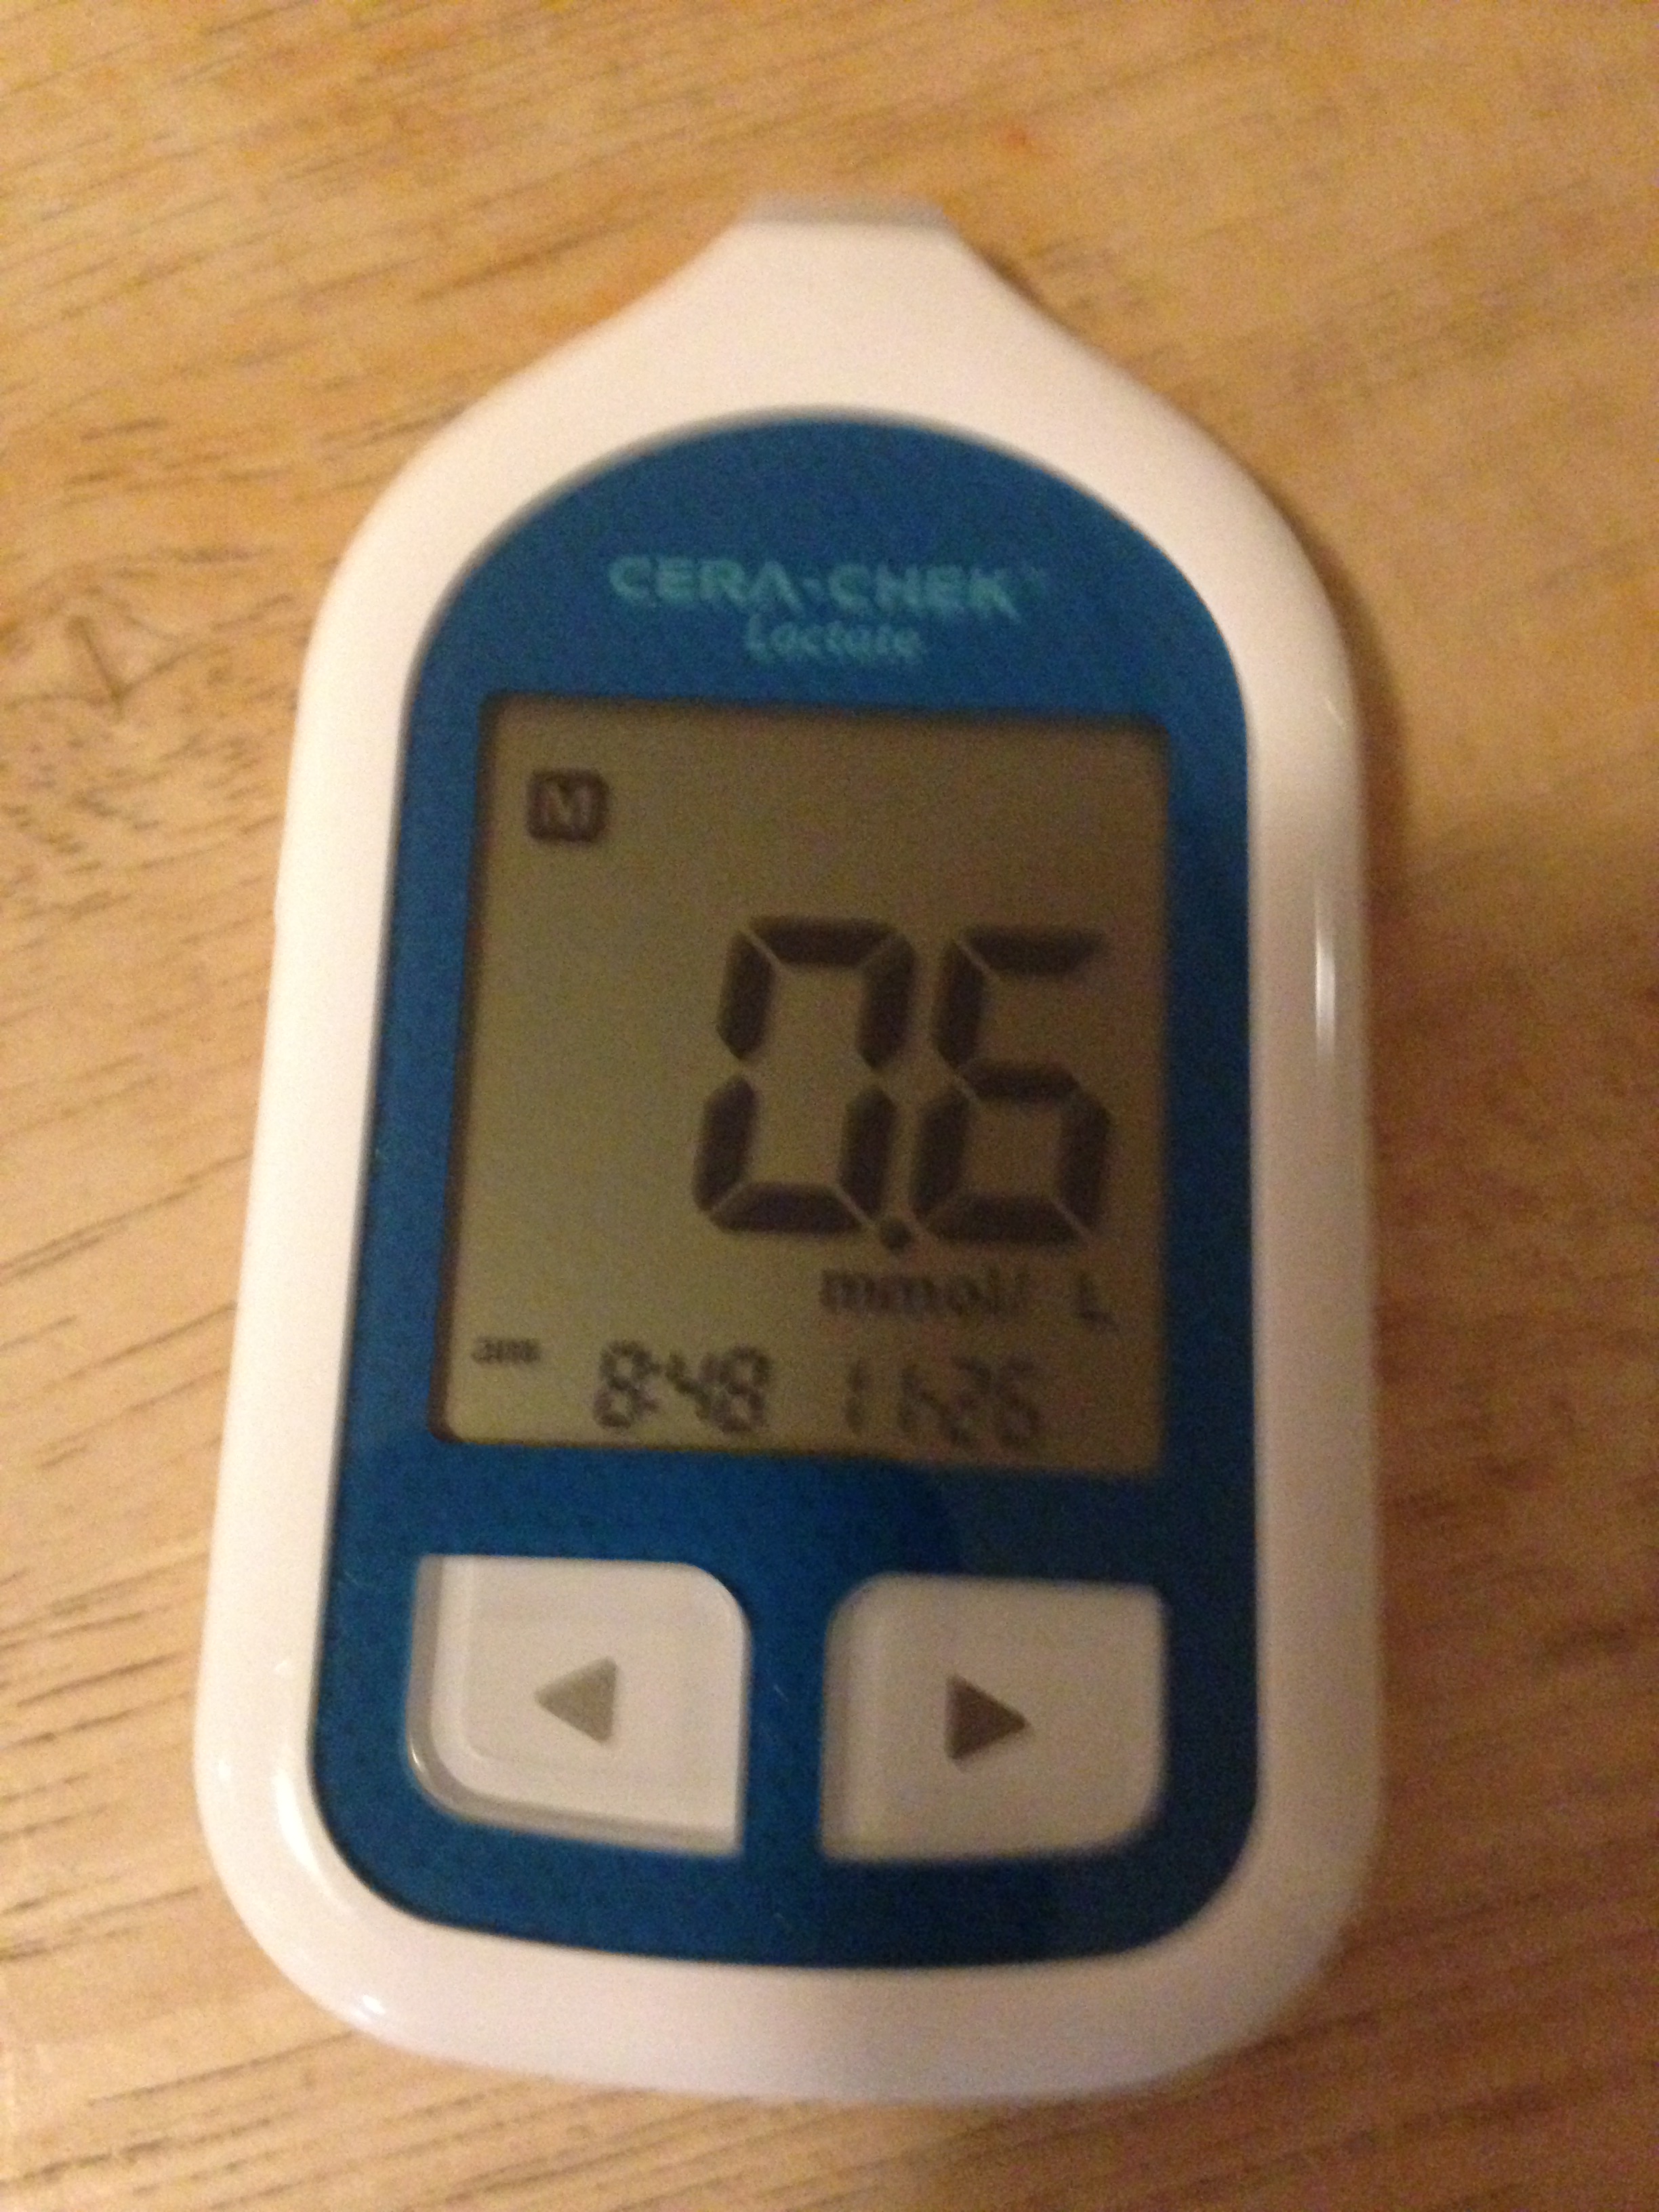
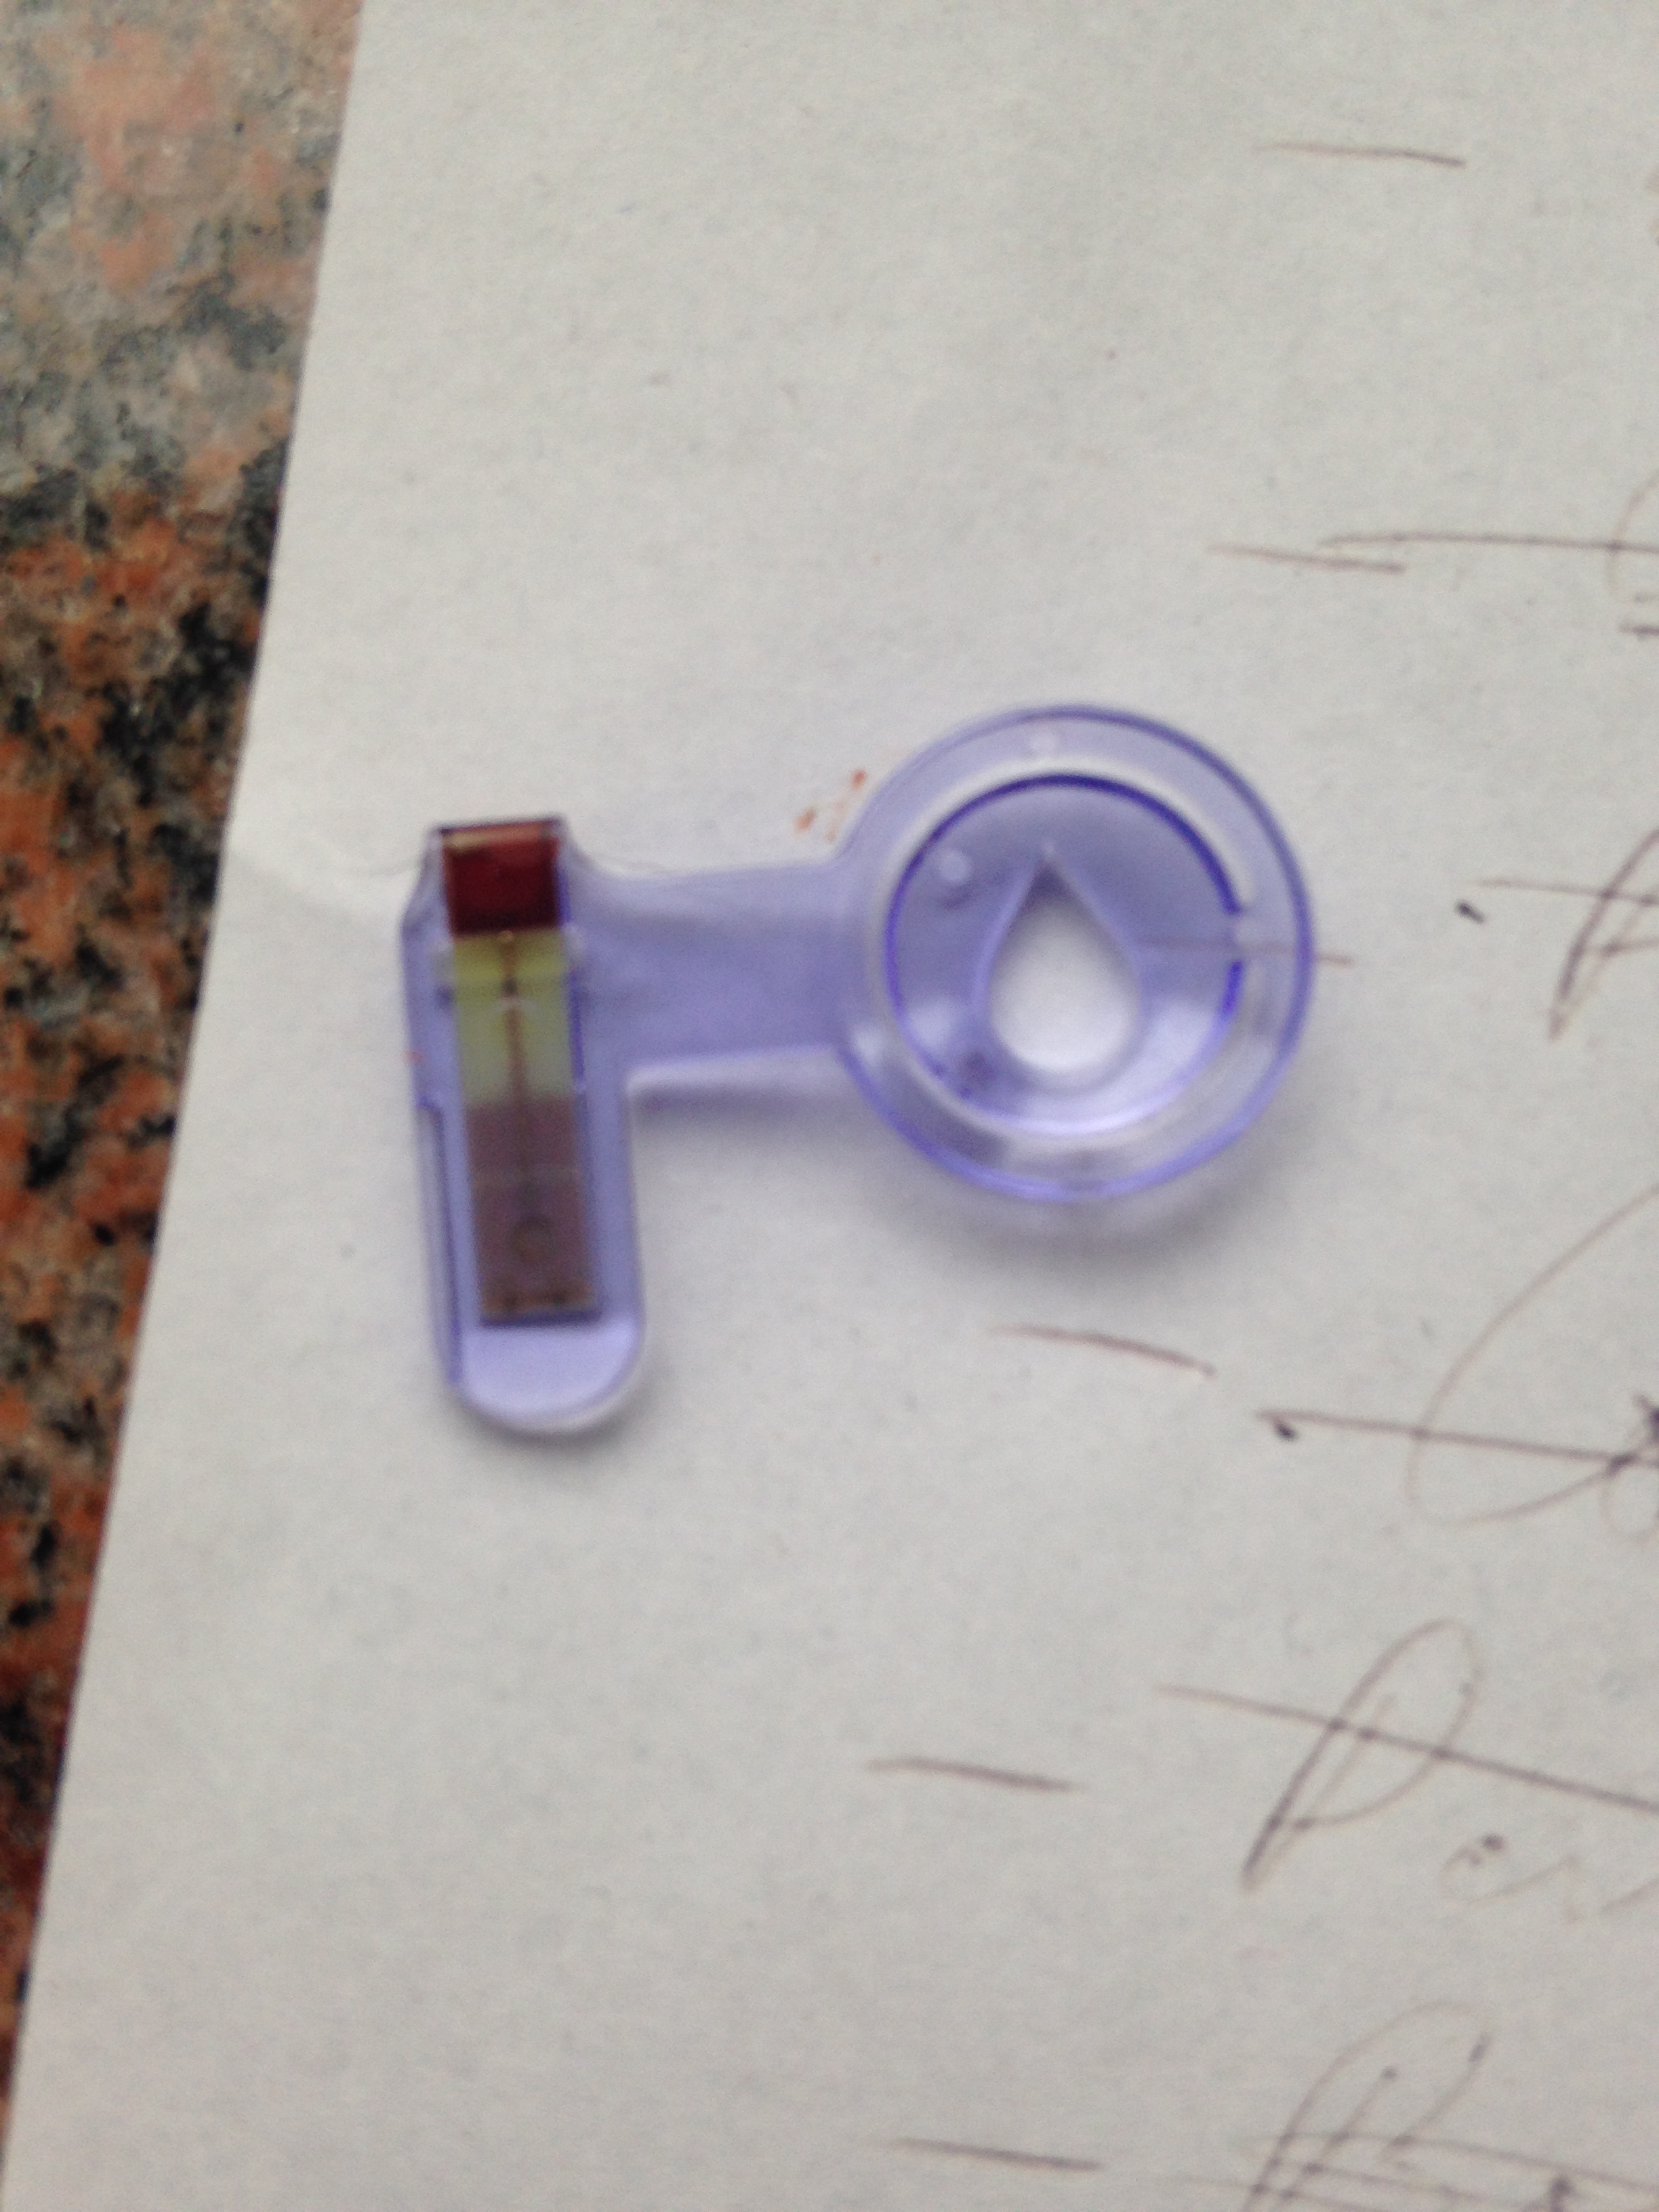
The third interval was hard. The kind of annoying steady state “hard”. It just took too much mental effort to hold the pace. I did some stroke rate changes in the first 10 minutes just to keep the focus. Took a lactate measurement immediately after the interval:
Feeling confirmed. I was actually very happy about this result. It gives me more confidence in lactate measurement as a method to confirm what the perceived rate of effort tells me. And thus it also gives me confidence to continue doing what I have done so far: If it feels too hard, back down.
I’ll start keeping my lactate readings, together with notes on heart rate, perceived level of effort and some other parameters in a spreadsheet.
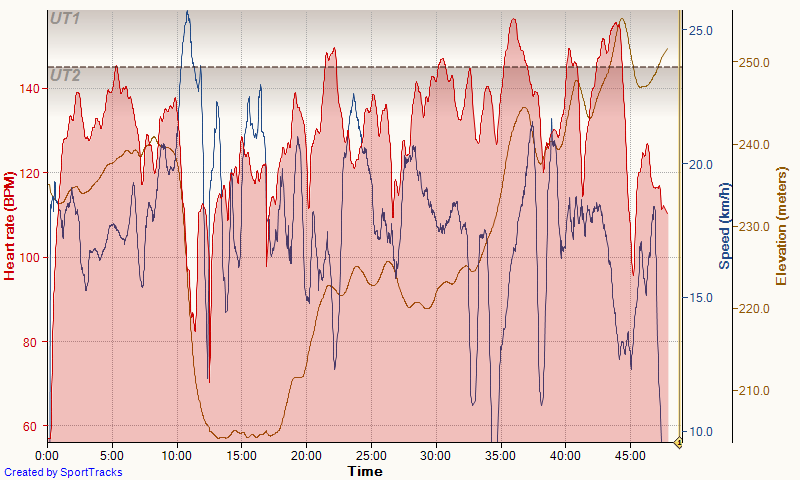
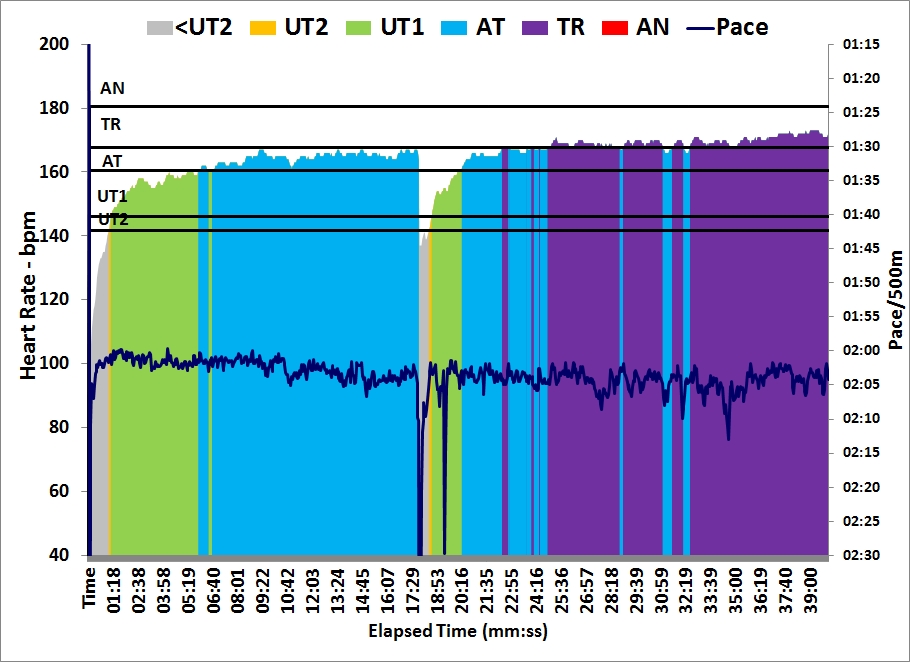
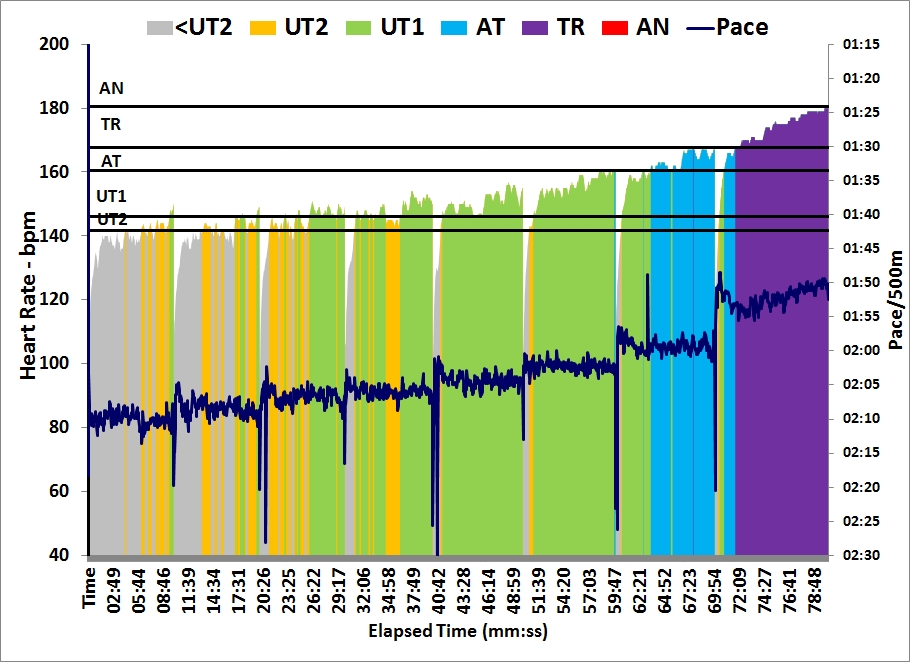
Here’s the HR plot of the session:
Workout Summary - Dec 01, 2015

--|Total|-Total-|--Avg--|-Avg-|Avg-|-Avg-|-Avg

--|Dist-|-Time--|-Pace--|Watts|SPM-|-HR--|-DPS

--|15428|64:00.0|02:04.5|181.6|22.2|156.9|10.9

Workout Details

#-|SDist|-Split-|-SPace-|Watts|SPM-|AvgHR|DPS-|Comments

01|04902|20:00.0|02:02.4|190.9|21.1|147.2|11.6|1st 20 min

02|00345|02:00.0|02:53.7|066.8|17.5|124.5|09.9|rest

03|04990|20:00.0|02:00.2|201.3|23.3|161.2|10.7|2nd 20 min

04|00220|02:00.0|04:33.0|017.2|13.0|127.9|08.5|rest

05|04971|20:00.0|02:00.7|199.0|23.5|165.4|10.6|3rd 20 min: 2.5 mmol/L
HR drift was 7%.
By sanderroosendaal • Uncategorized • 5 • Tags: concept2, erg, lactate, OTE, rowing, steady state, test, testing, training