Nov 29 2015
Steady State – further lactate figures
Saturday
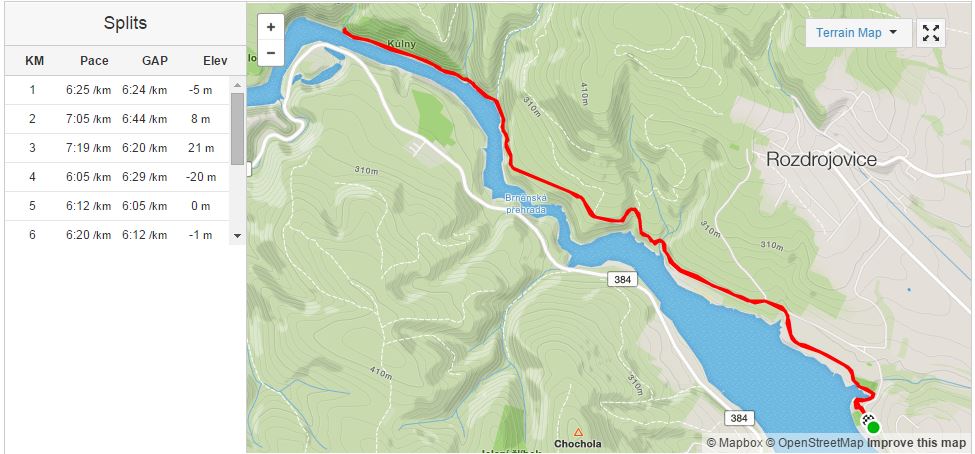
Weather not good for rowing. Some ice along the banks. Cold water. Also, I promised Romana (who is struggling with a cold) that I would take her training today. So it was a very slow run from the rowing club with the girls. I tried to improve their running technique. A couple of breaks for stretching.
https://www.strava.com/activities/440656322
Sunday
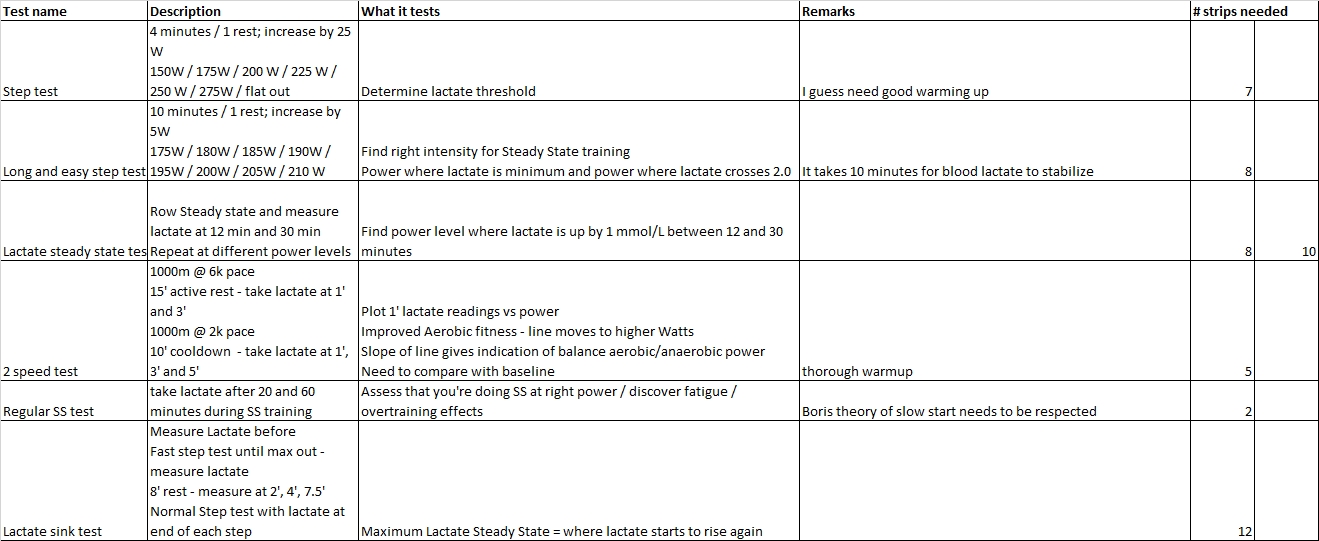
A week ago, I did the first serious lactate testing. Today I played with the thought of repeating it at slightly higher power settings, to get some more info about my lactate curve. In the end I decided to not do 8x10min but 4x20min, to save strips and reduce the rest. I have the feeling that my lactate level goes down quite quickly and 2 minutes rest on 10 minutes exercise seems quite luxurious.
2k of slow warming up (2:15 pace) and then into the main event:
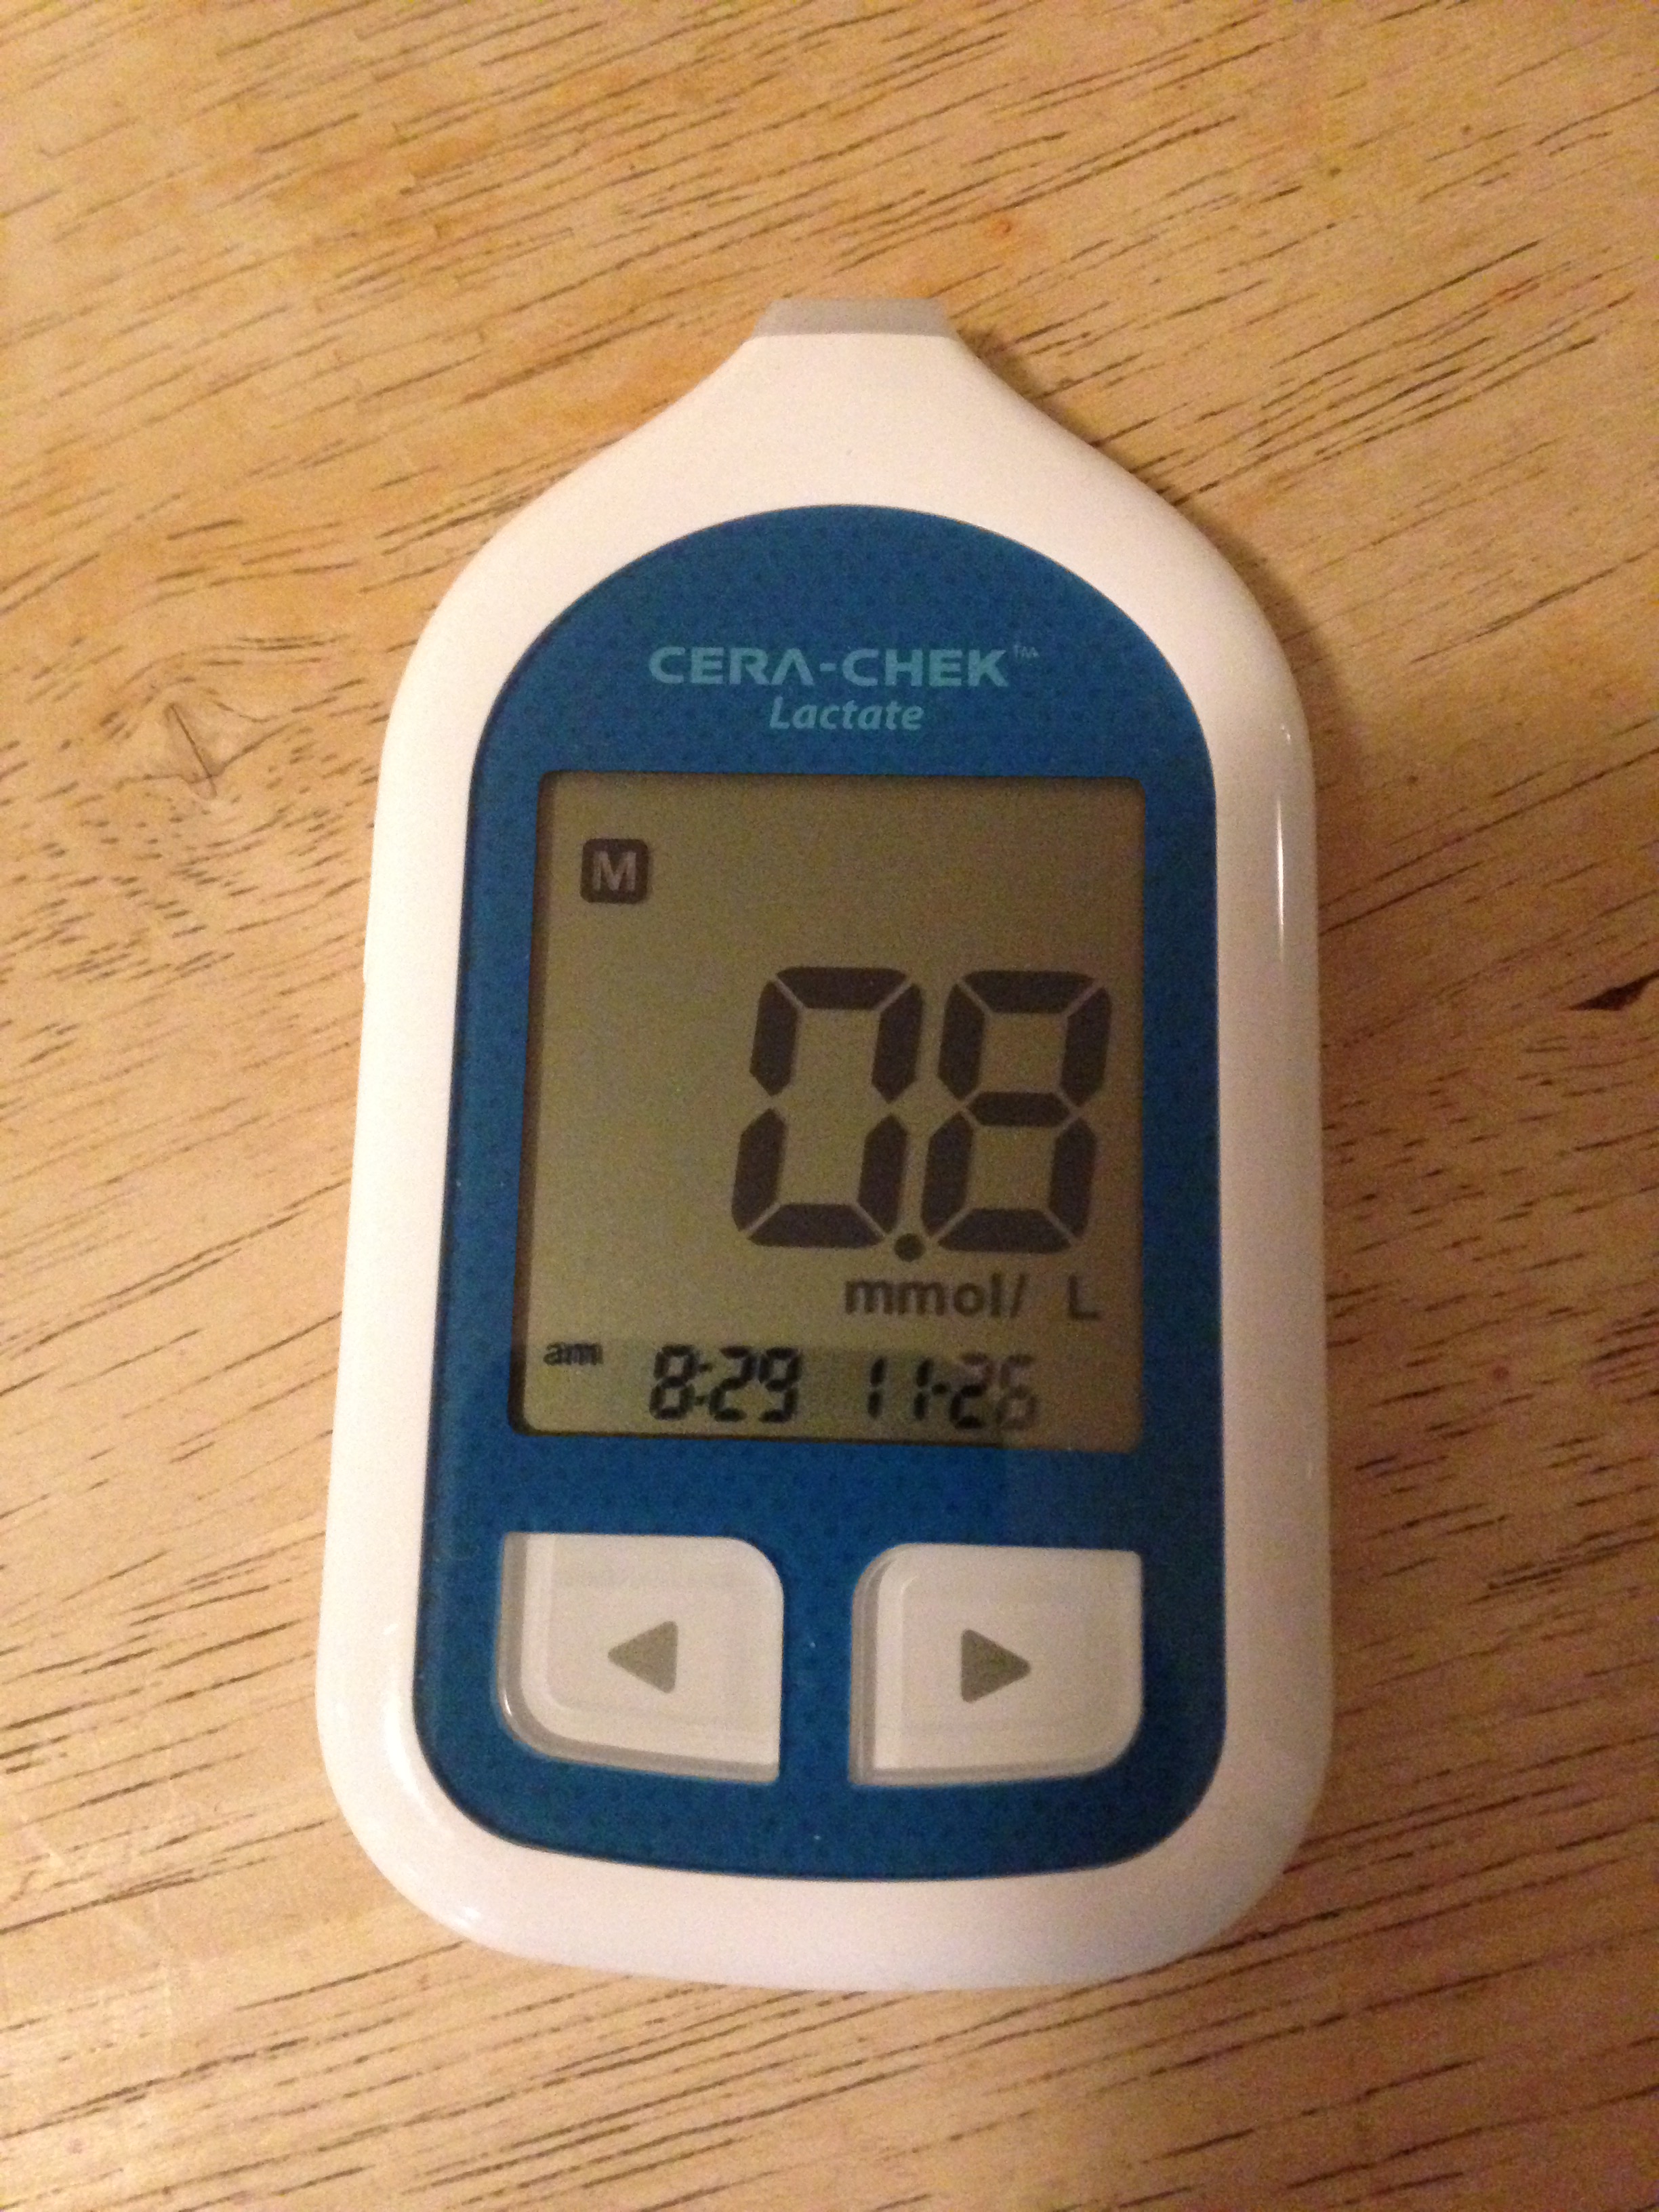
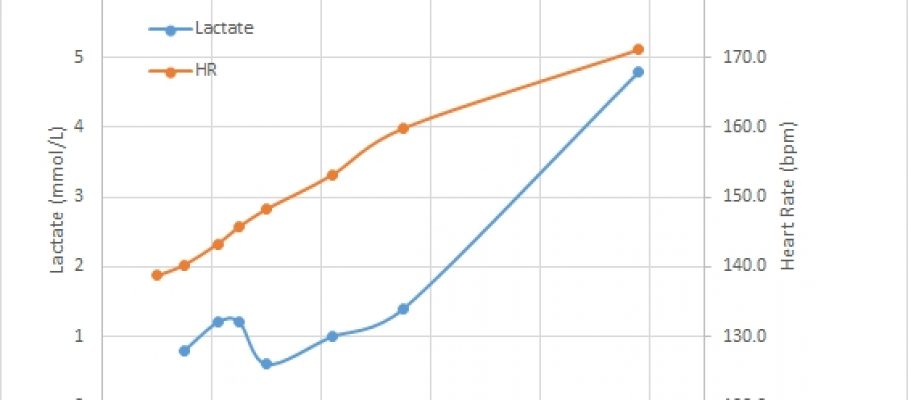
First 20 min at 180W to get into the groove and get a data point around the power where I had minimum lactate last Sunday. I measured 0.8 mmol/L.
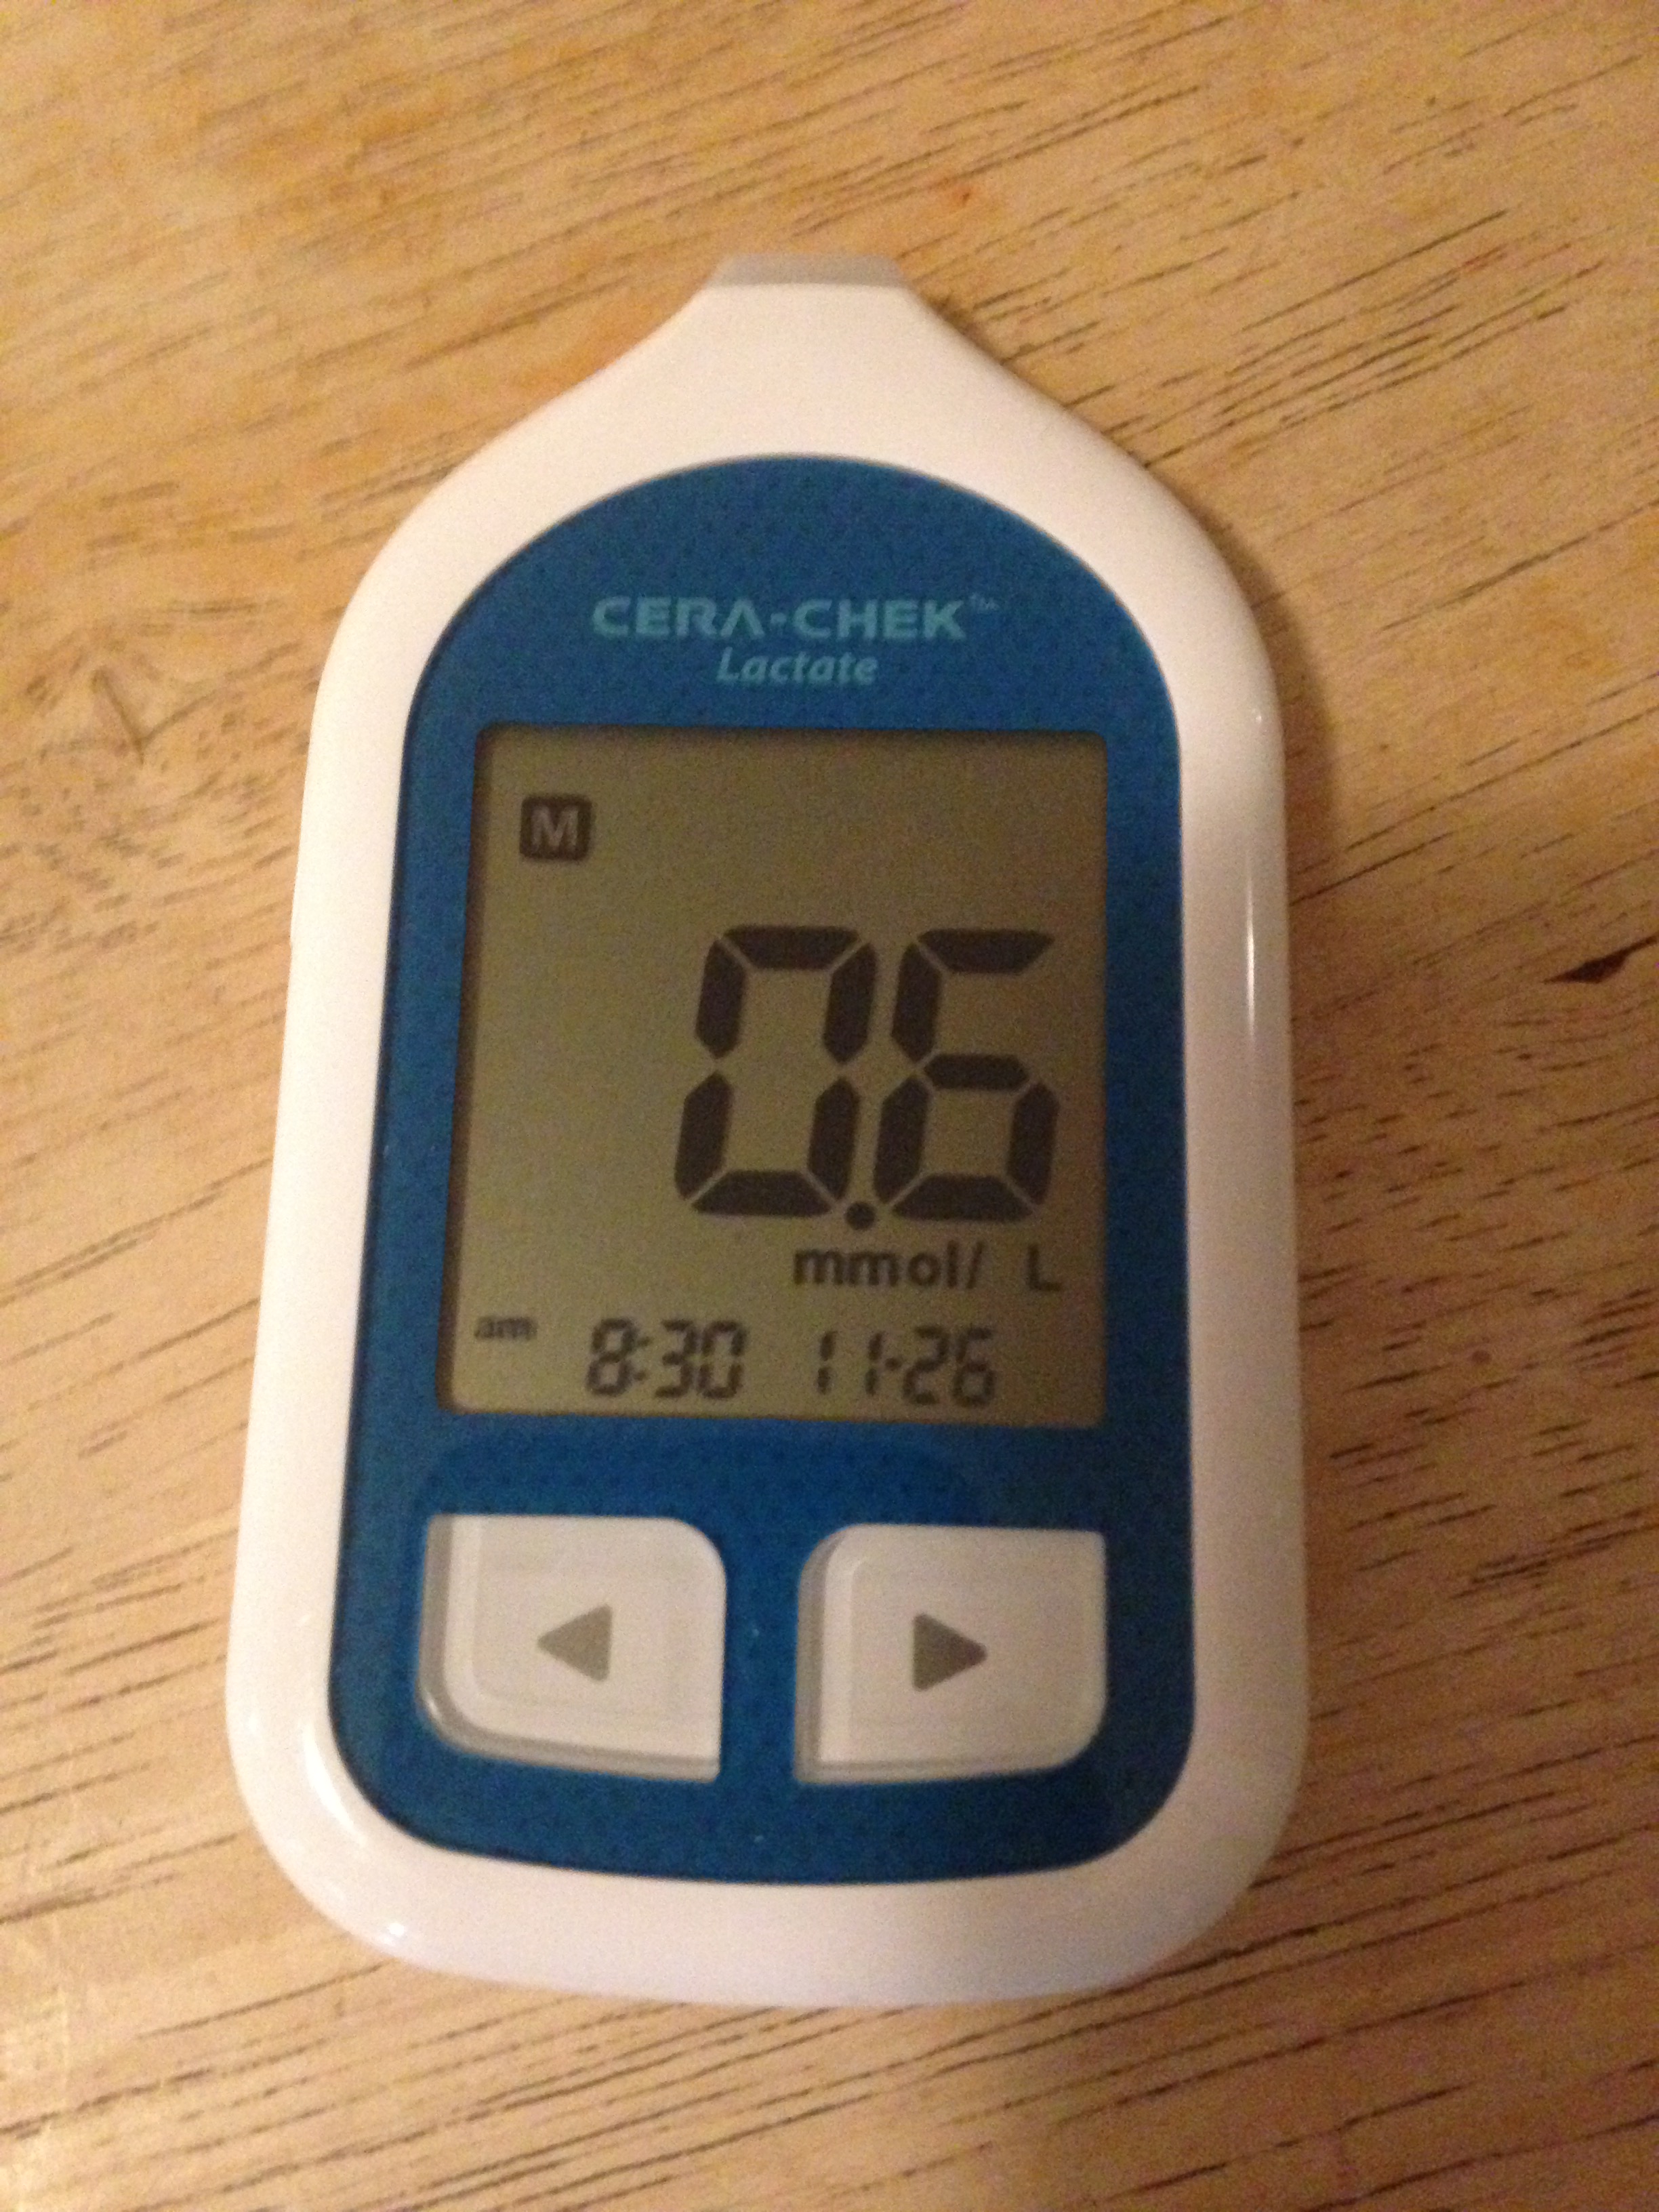
Then up to 200W. Today it felt like a very easy intensity, but I guess doing this after 20 minutes at 180W my aerobic engine was running at full speed and not yet tired. The result: 1.4 mmol/L. Nice.
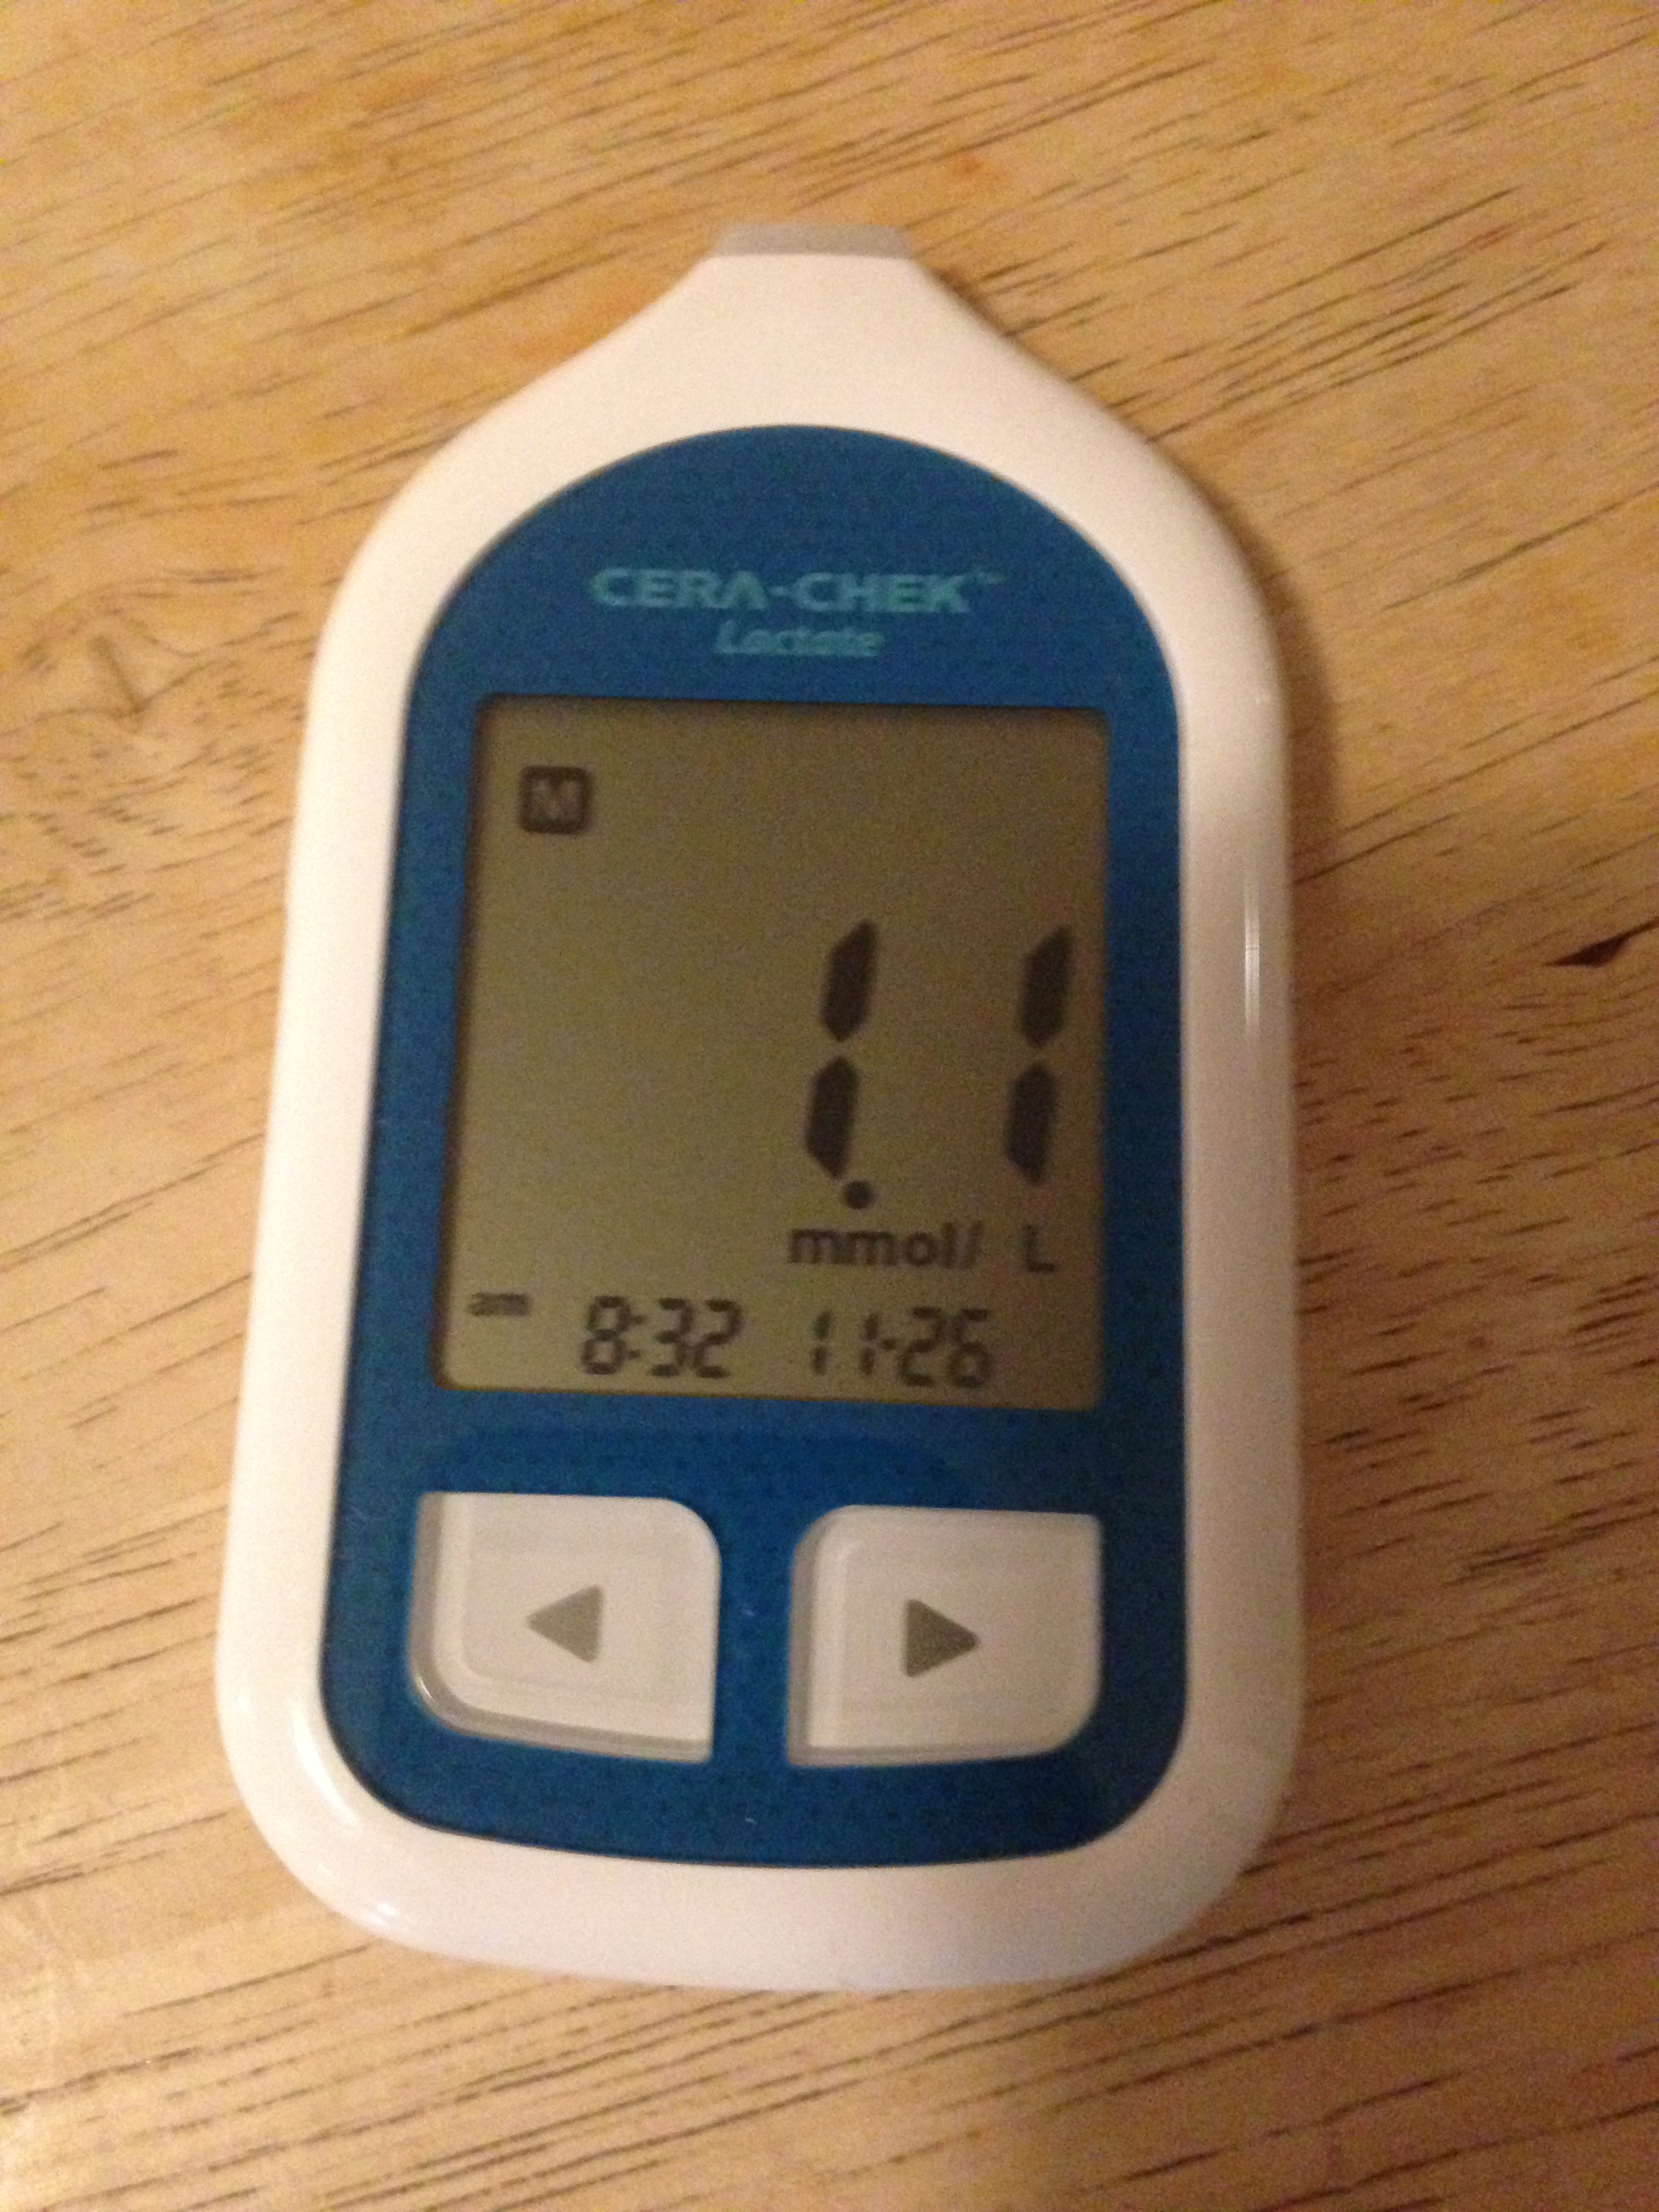
Up to 210W and a few minutes into that row I knew I should expect a higher lactate level. The breathing got heavier, but more importantly my splits began to swing more, between 195W and 220W, instead of staying within a few Watts of the target. I had to focus more. The result: 1.9 mmol/L.
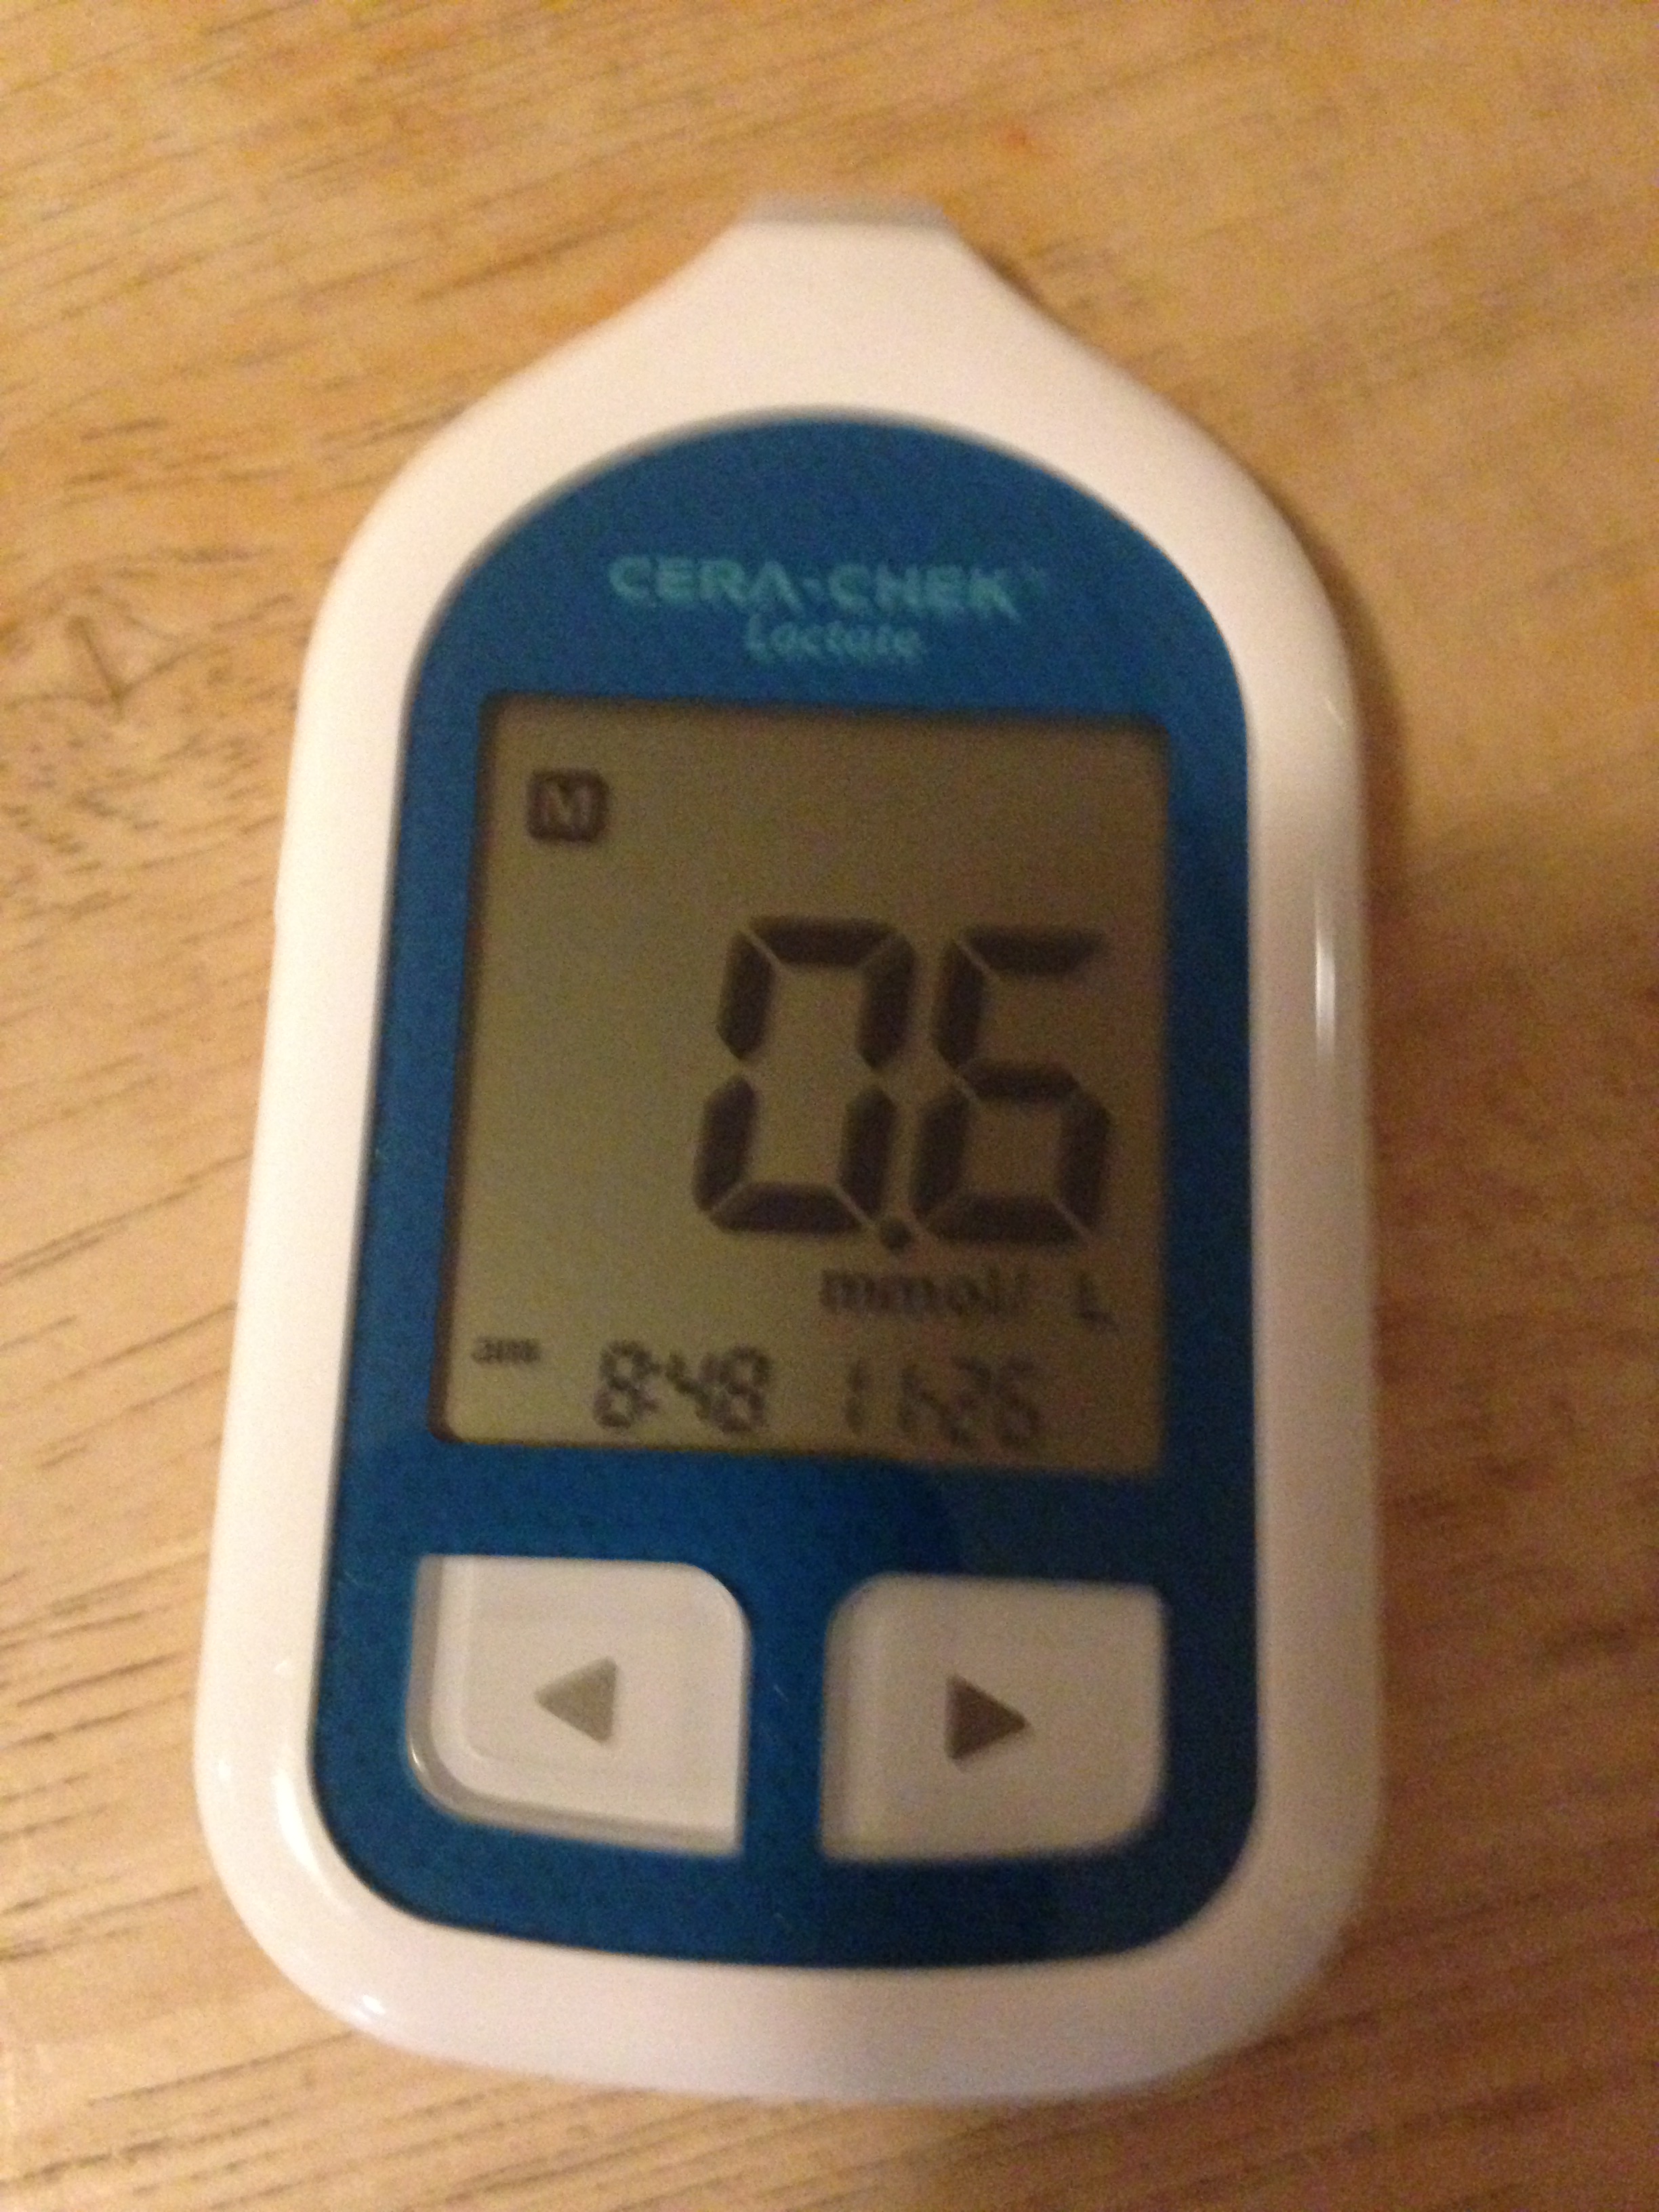
The original plan was to do the final 20 minutes at 220W, but I didn’t feel like it. Instead, I decided that holding 210W and looking at the lactate and HR levels would also be an interesting result. The row didn’t feel harder than the third interval, but still I got a very interesting (and comforting) result: 2.2 mmol/L.
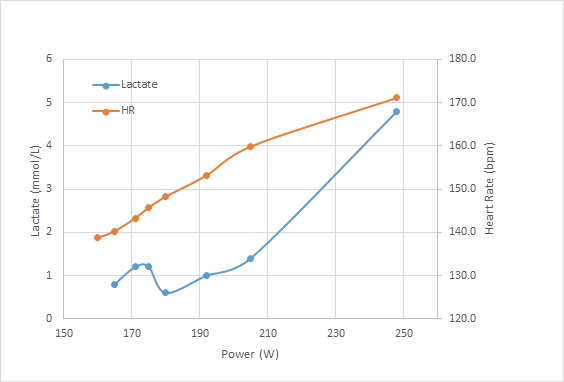
Here is the graph. I plotted the additional data points over the 8x10min step test of last week.
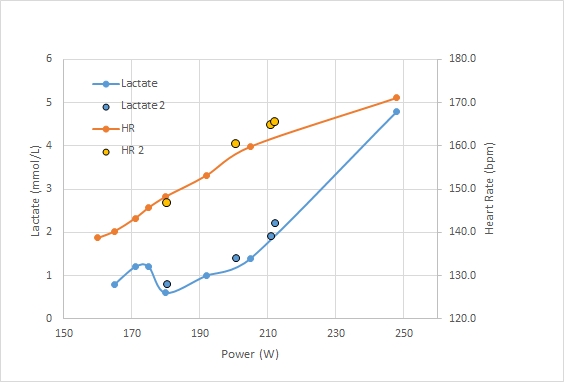
Even though I changed from a 10 minute based step to a 20 minute based step, I think the results are very consistent. It also looks like 200 W is really the level that I should do my steady state, if I follow the paradigm that one should do steady state below 2.0 mmol/L.
So all in all I start to have more faith in my lactate results and will do 200W steady state for the coming week or two. I am really happy to have established that my lactate level can go above 2.0 on 210W steady state. I also liked how the level kept increasing in the second interval at 210W. Kind of suggests that 210 is above lactate steady state.
So 200W it is. Probably 3x20min during weekdays and 4x20min in the weekend, measuring lactate at the end.



Dec 1 2015
Another Steady State Data Point
Today I ignored lesson 1 for steady state sessions. If it is supposed to be a UT2 or UT1 session, it is not supposed to feel like hard work. If it does, you should back down, reduce the intensity, or even just stop and take a rest day.
For science (or rather for my curiosity as my method lacks scientific rigor), I pushed on.
A lot of things were different today, compared to the steady state sessions that I measured lactate on so far:
I did a 3×20 min tonight with a lactate measurement after the last 20 minute interval.
I warmed up for 5 minutes.
First interval didn’t feel too bad. I slowly ramped up the power for the first 10 minutes and ended up doing a 190W on average.
I rowed the second interval with an eye on the clock. It seemed endless. I knew I was working harder than I want to work in steady state sessions, but after 10 minutes funnily the pace started to drift to 210W and I had to consciously keep it down. Still, my breathing and the feeling in my legs told me I was working too hard.
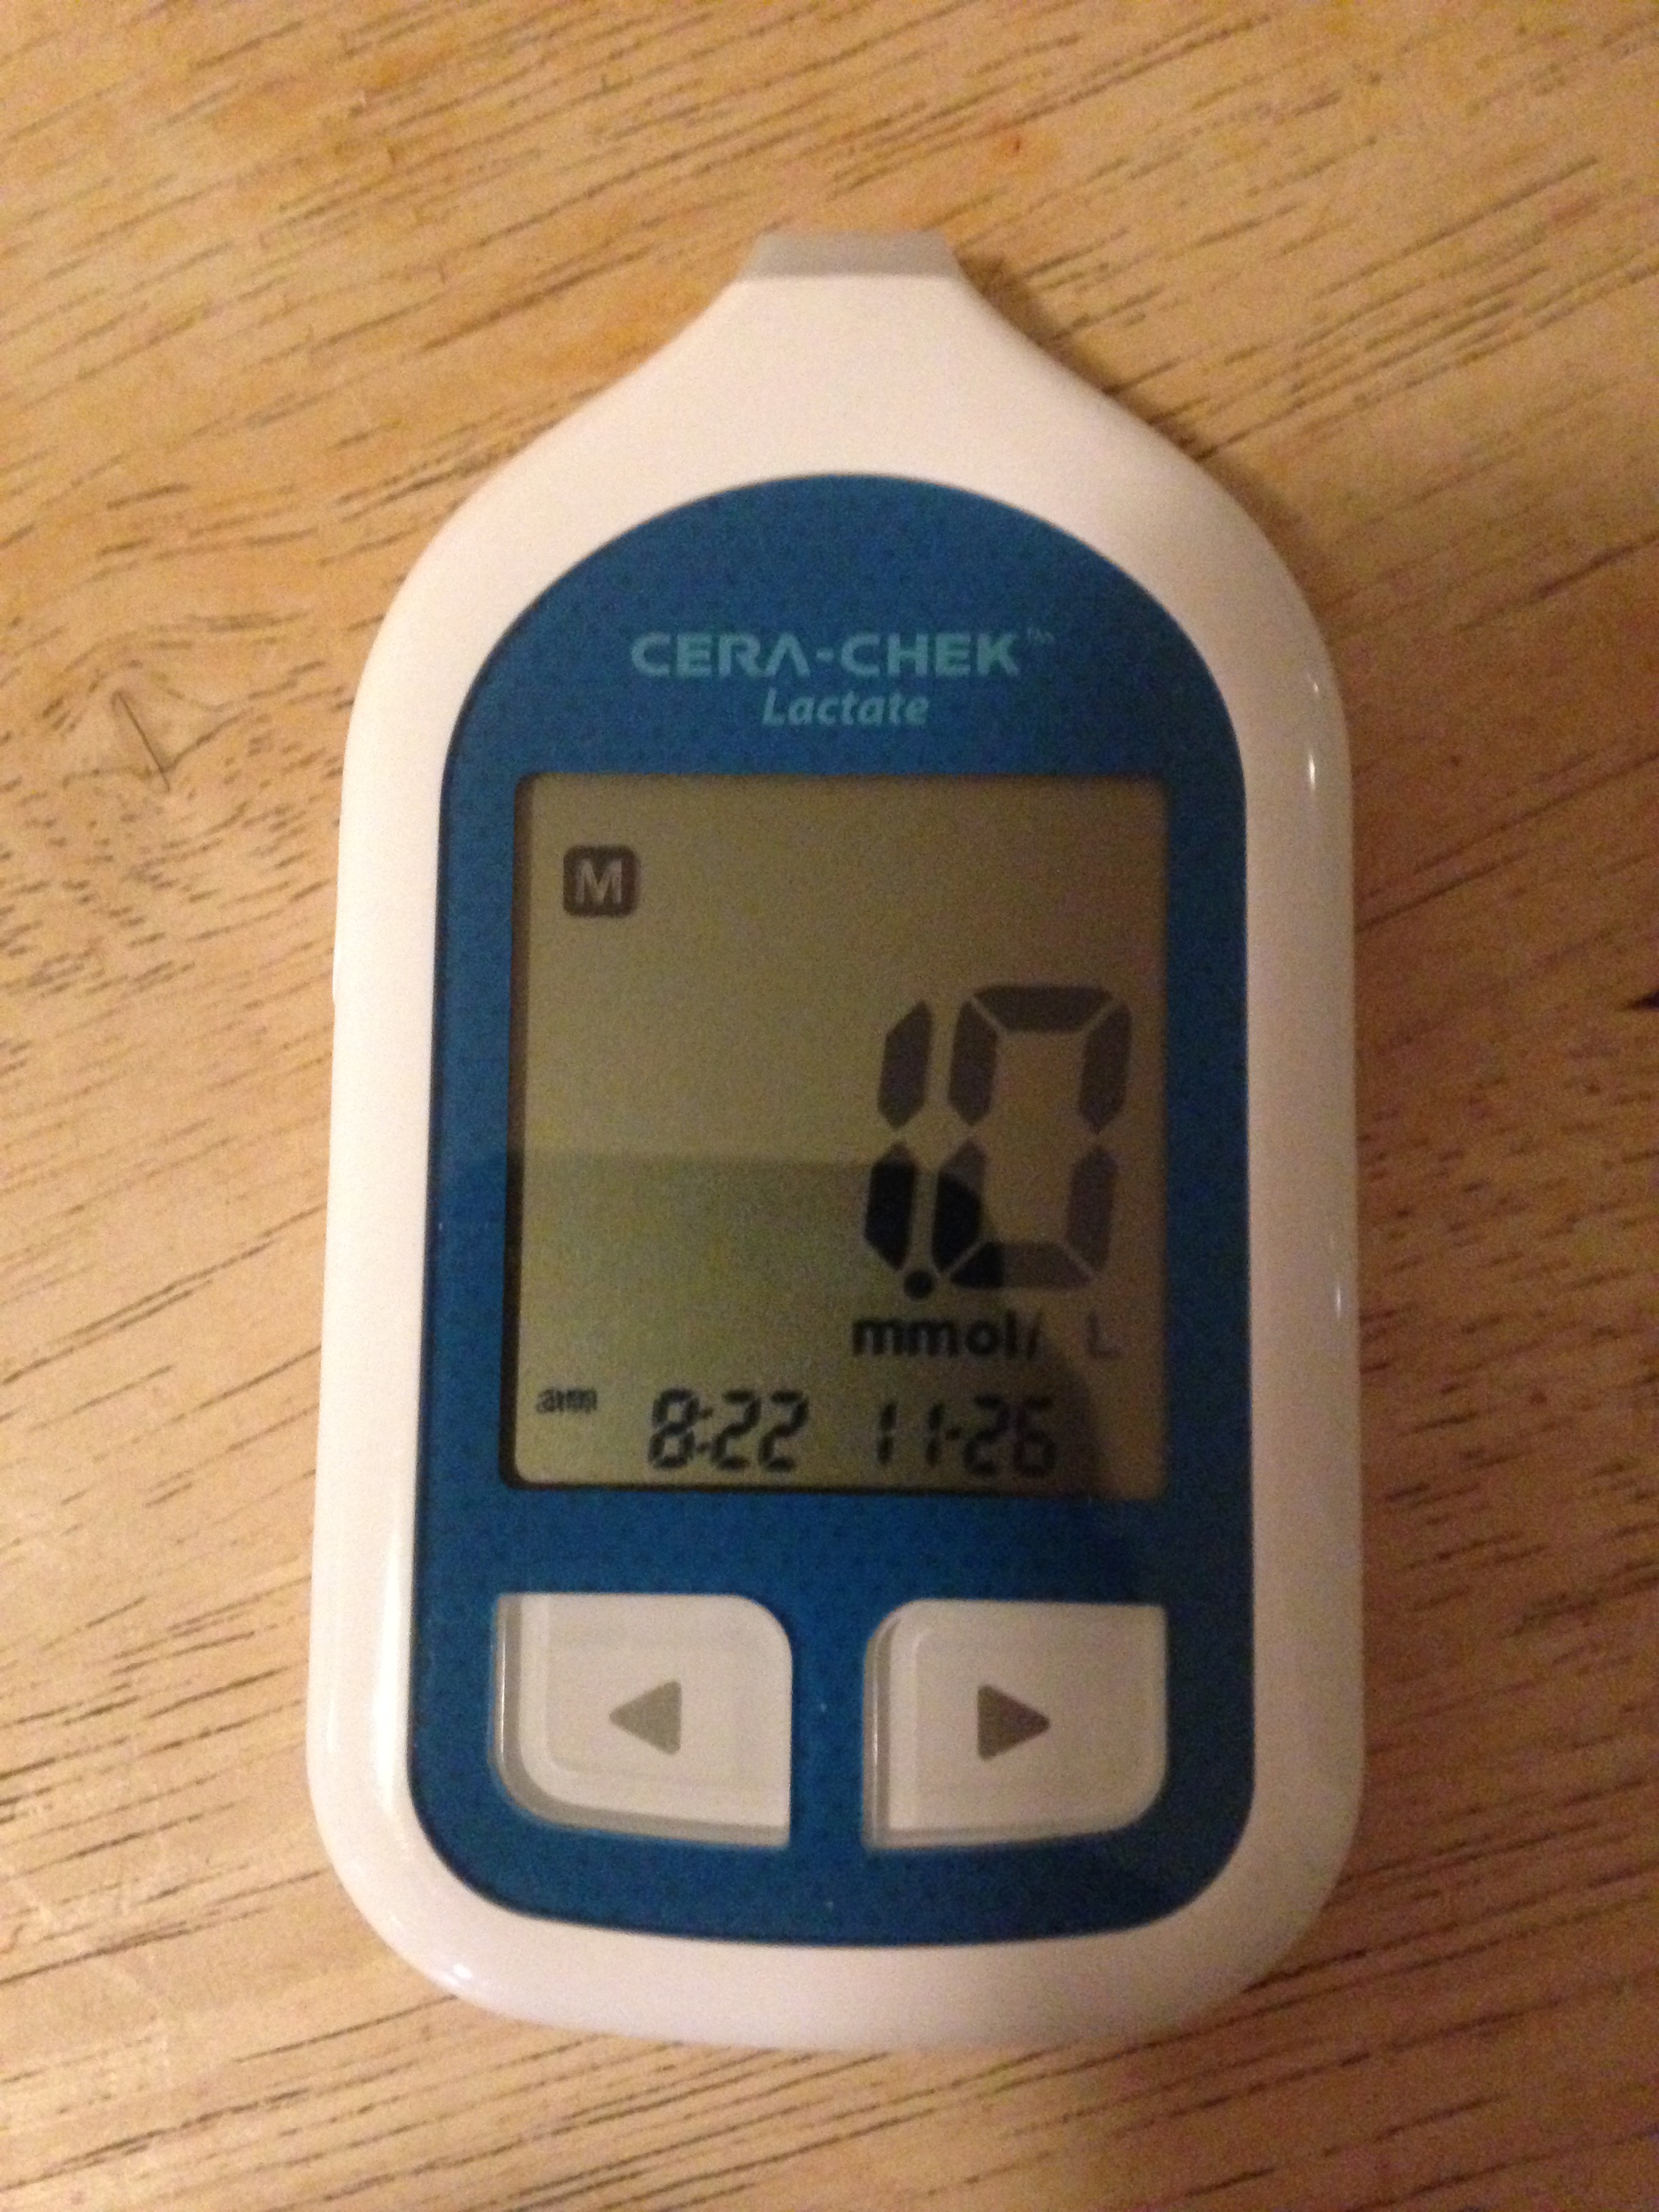
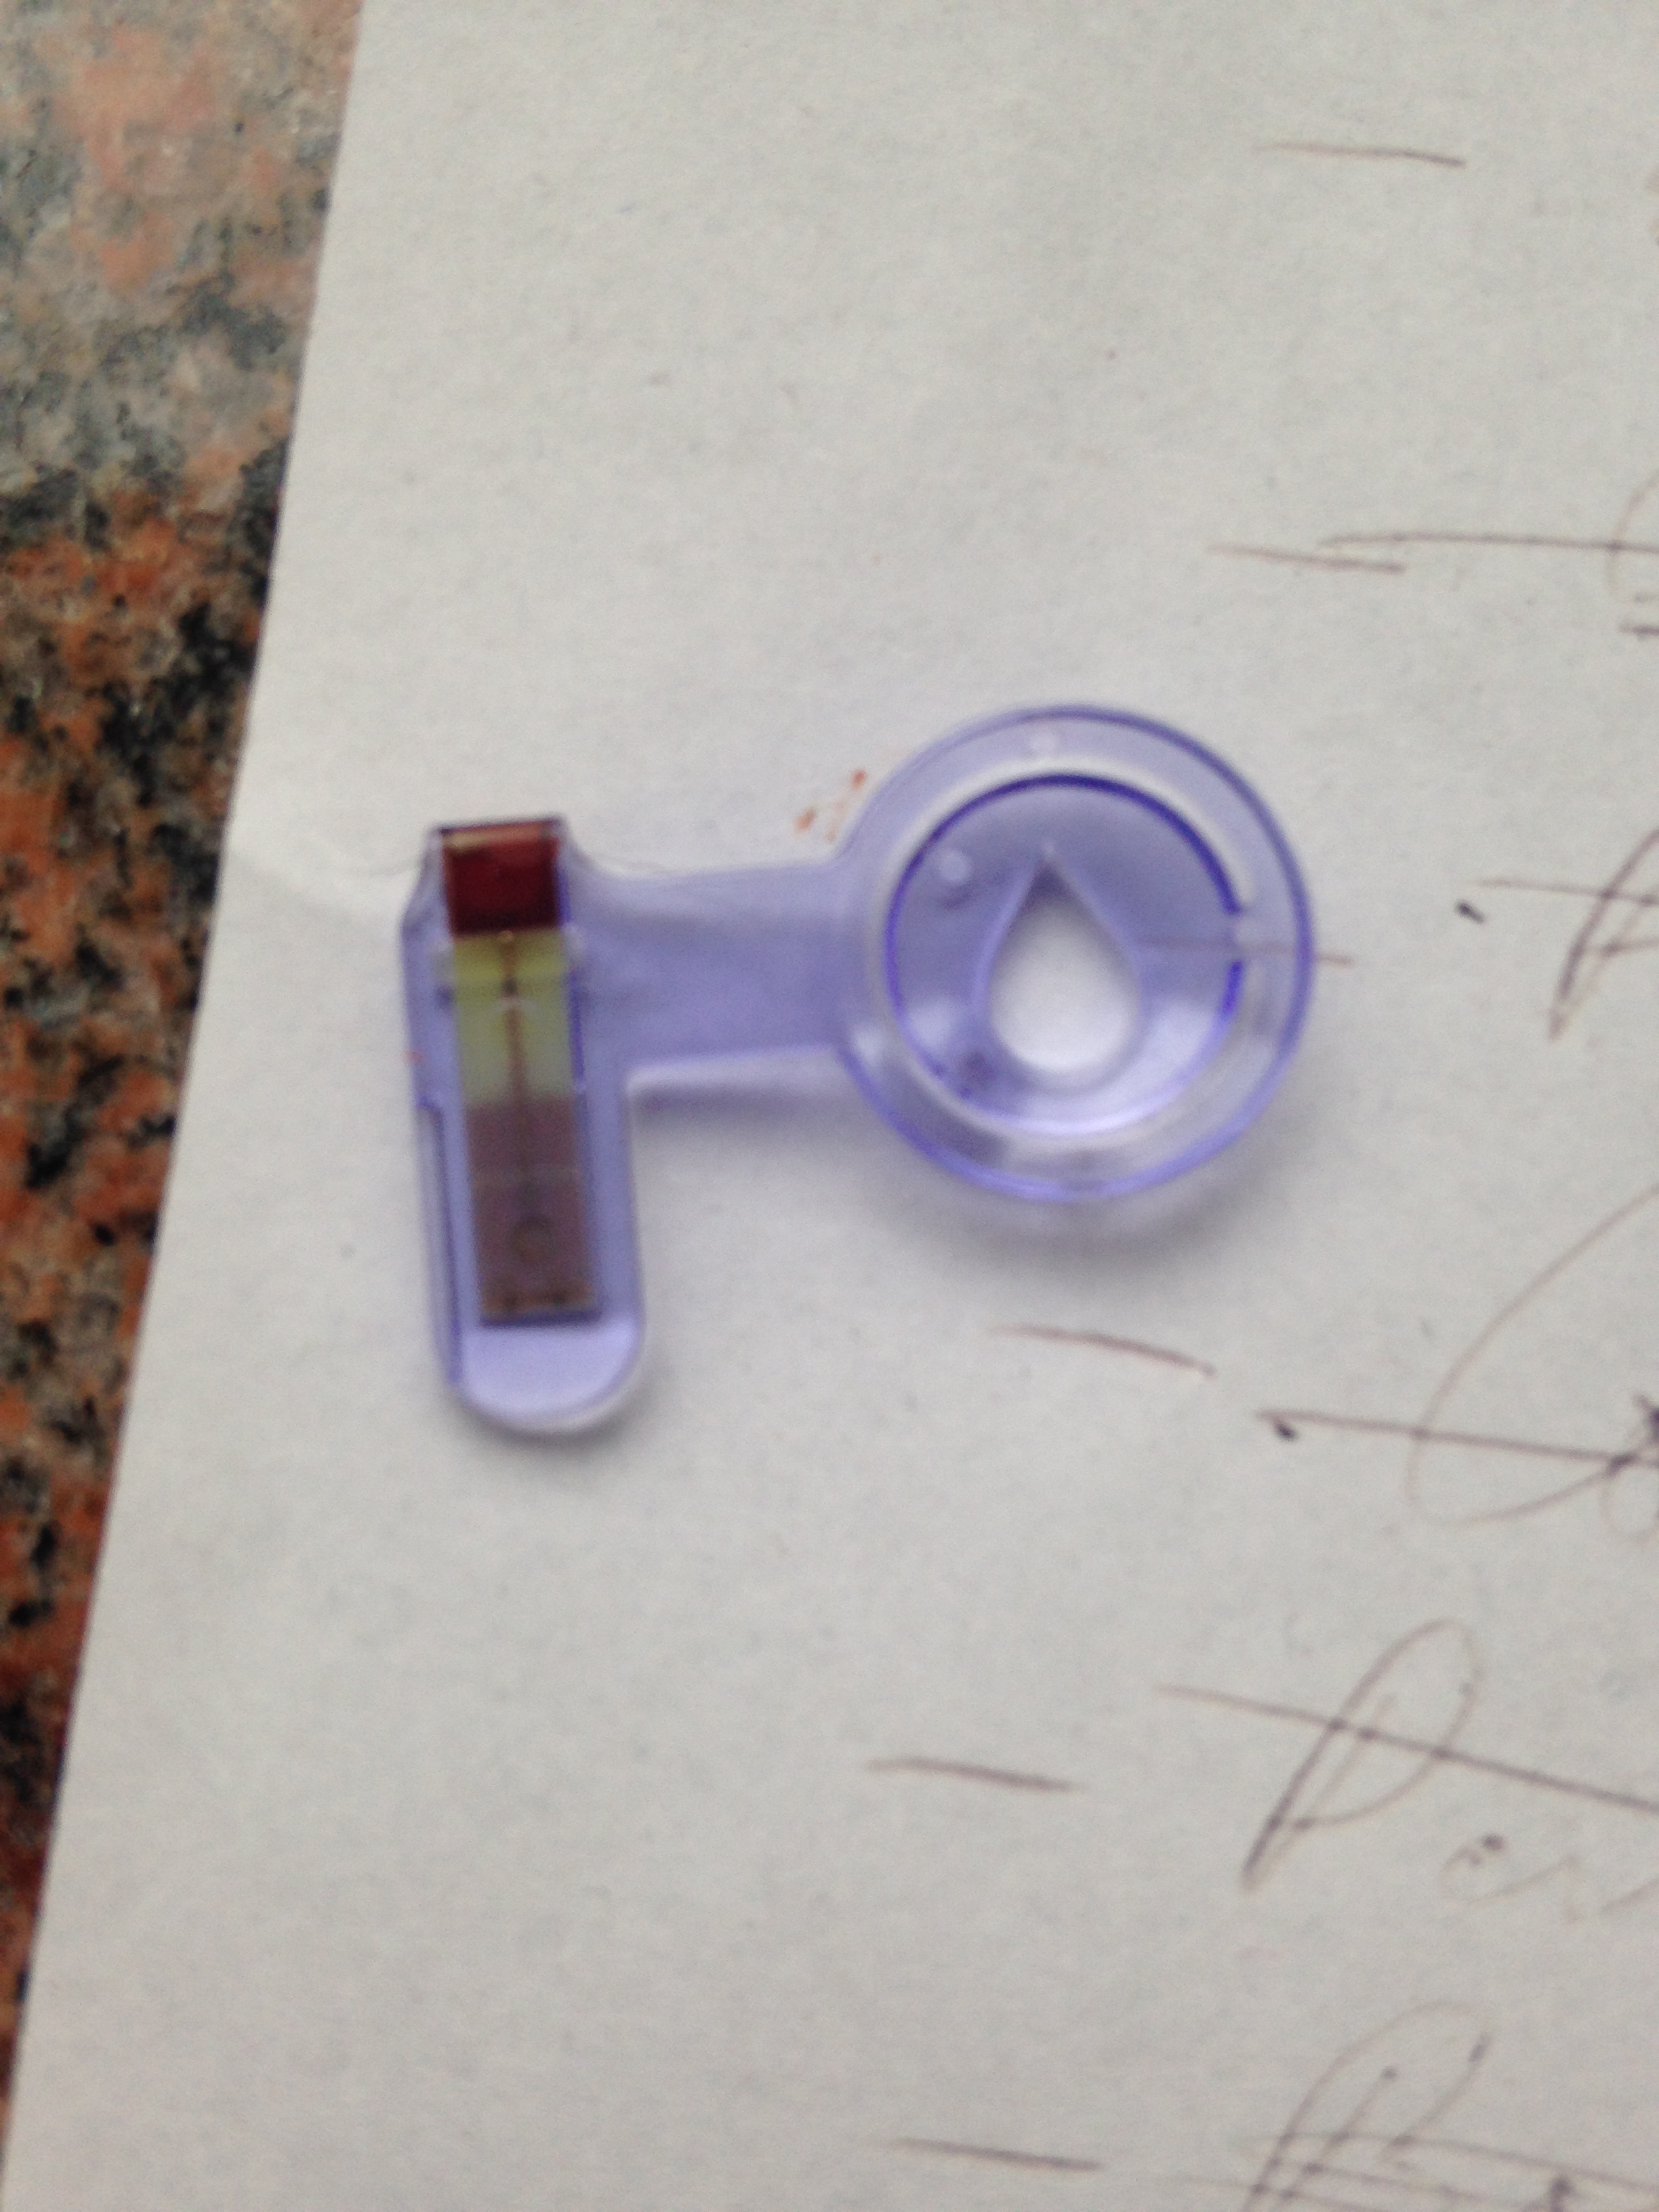
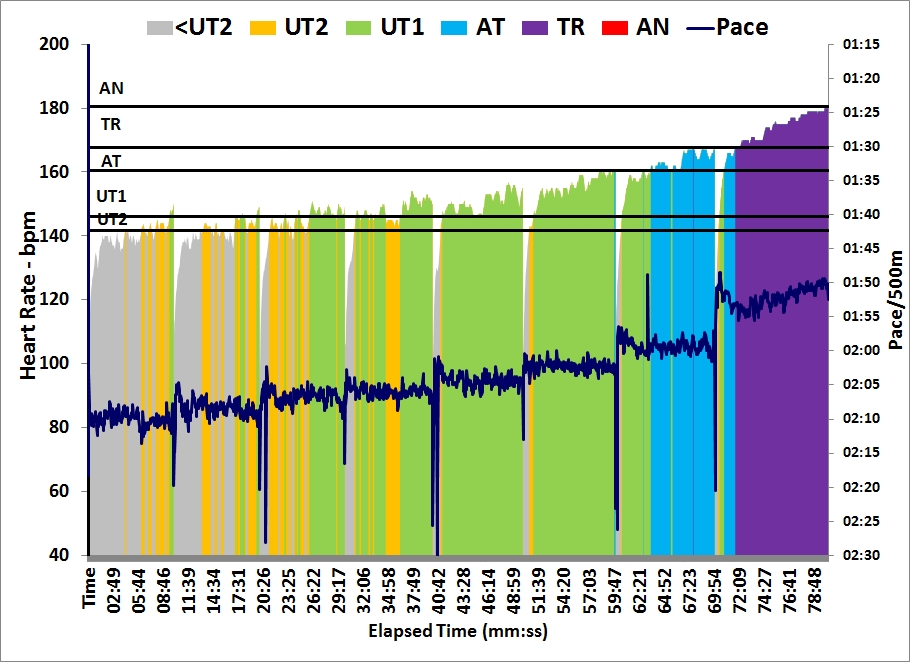
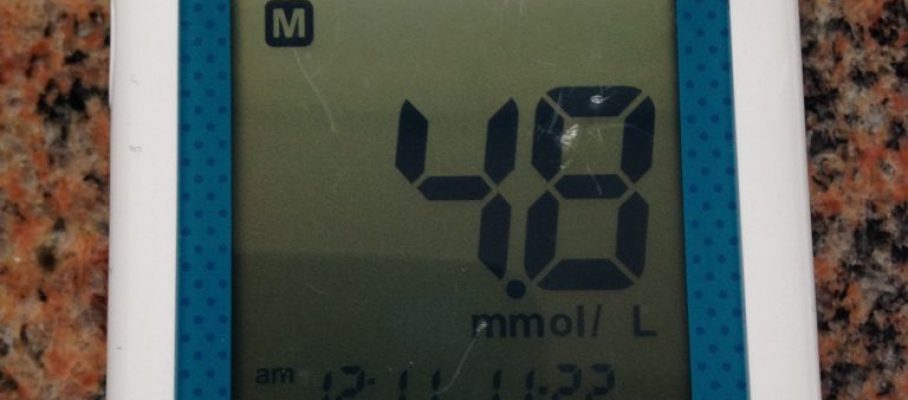
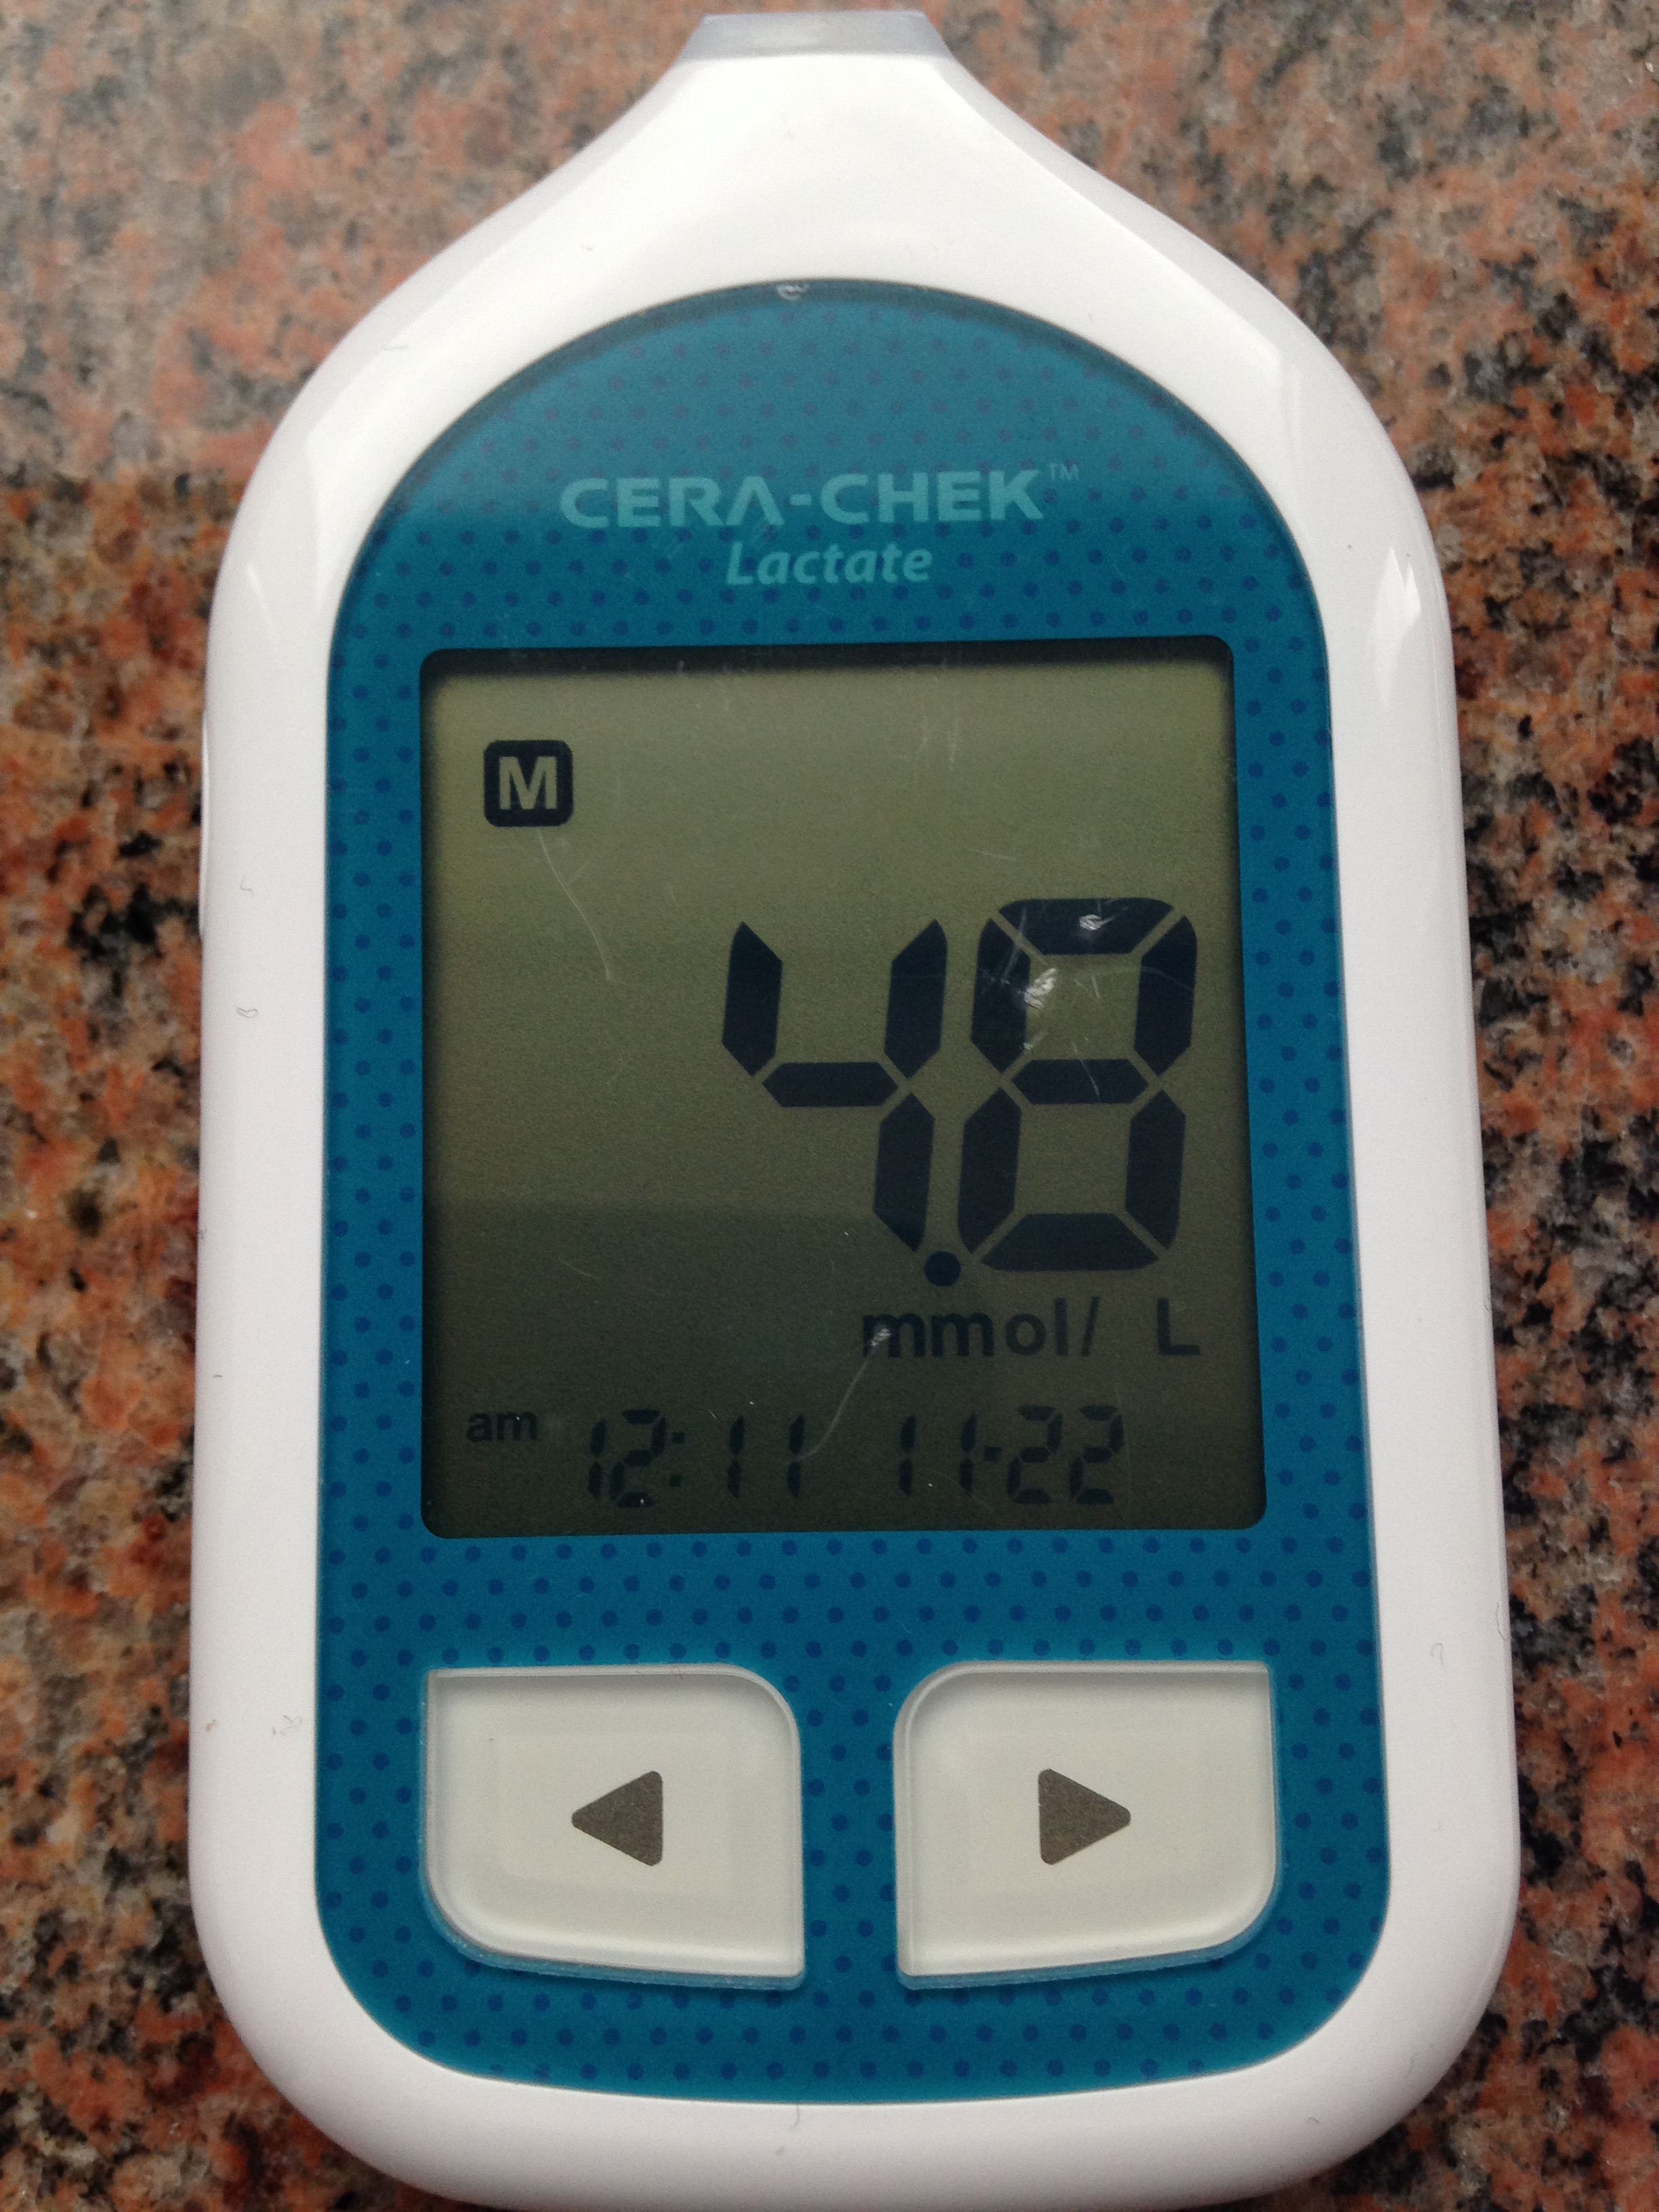
The third interval was hard. The kind of annoying steady state “hard”. It just took too much mental effort to hold the pace. I did some stroke rate changes in the first 10 minutes just to keep the focus. Took a lactate measurement immediately after the interval:
Feeling confirmed. I was actually very happy about this result. It gives me more confidence in lactate measurement as a method to confirm what the perceived rate of effort tells me. And thus it also gives me confidence to continue doing what I have done so far: If it feels too hard, back down.
I’ll start keeping my lactate readings, together with notes on heart rate, perceived level of effort and some other parameters in a spreadsheet.
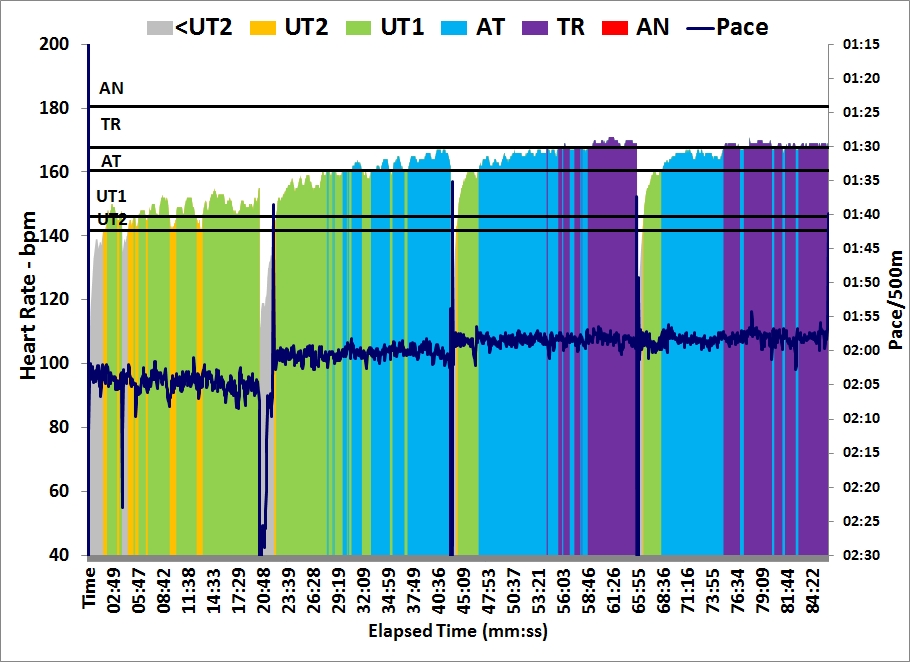
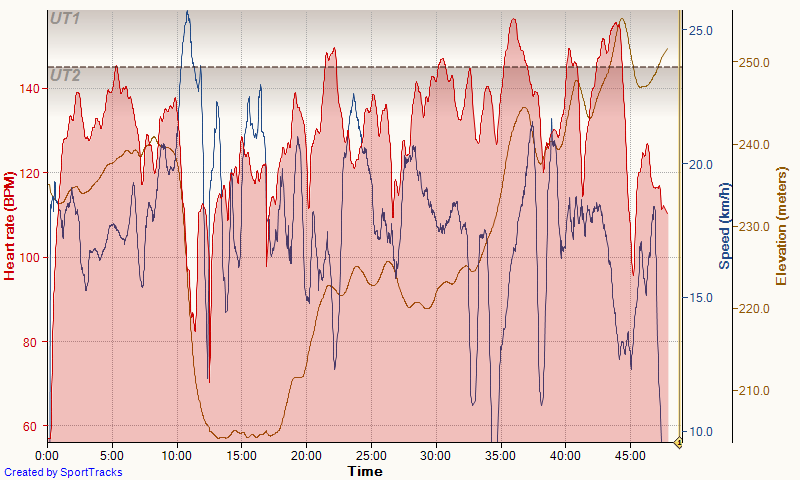
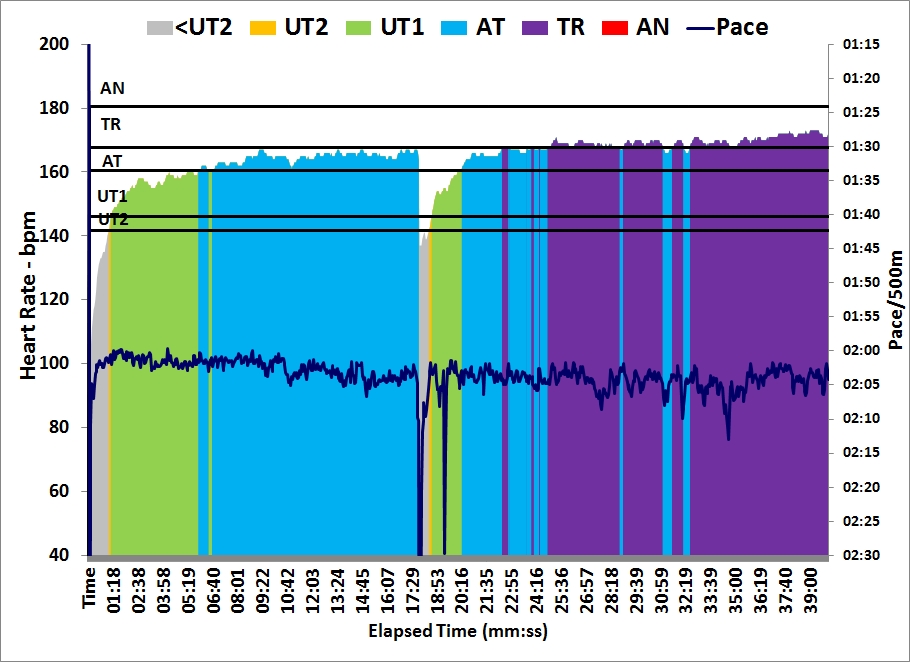
Here’s the HR plot of the session:
Workout Summary - Dec 01, 2015

--|Total|-Total-|--Avg--|-Avg-|Avg-|-Avg-|-Avg

--|Dist-|-Time--|-Pace--|Watts|SPM-|-HR--|-DPS

--|15428|64:00.0|02:04.5|181.6|22.2|156.9|10.9

Workout Details

#-|SDist|-Split-|-SPace-|Watts|SPM-|AvgHR|DPS-|Comments

01|04902|20:00.0|02:02.4|190.9|21.1|147.2|11.6|1st 20 min

02|00345|02:00.0|02:53.7|066.8|17.5|124.5|09.9|rest

03|04990|20:00.0|02:00.2|201.3|23.3|161.2|10.7|2nd 20 min

04|00220|02:00.0|04:33.0|017.2|13.0|127.9|08.5|rest

05|04971|20:00.0|02:00.7|199.0|23.5|165.4|10.6|3rd 20 min: 2.5 mmol/L
HR drift was 7%.
By sanderroosendaal • Uncategorized • 5 • Tags: concept2, erg, lactate, OTE, rowing, steady state, test, testing, training