Dec 2 2016
Steady State again (finally)
Thursday
I arrived around midnight on Wednesday night, and the last 2 hours of my travel was in a car through a snow storm.
I was tired form the trip.
I had a lot of things to do.
I didn’t feel 100%. The feeling that a cold is sneaking upon you.
I knew Thursday would be my only opportunity to finish implementing the Empower Oarlock data visualization on rowsandall.com.
So I decided to skip the training and spent the evening implementing, testing and debugging Empower Oarlock data. All of you who already own this great oarlock, I invite you to register, upload the CSV file that you can export from the LiNK software and start playing.
I cannot show you any pictures, as I don’t have my own data yet. Also, you may find a few undiscovered bugs. In that case, drop me a line please. Apart from bringing power based training to OTW rowing, the oarlock records a bunch of other useful data, and I am really excited about visualizing these data for you.
Friday
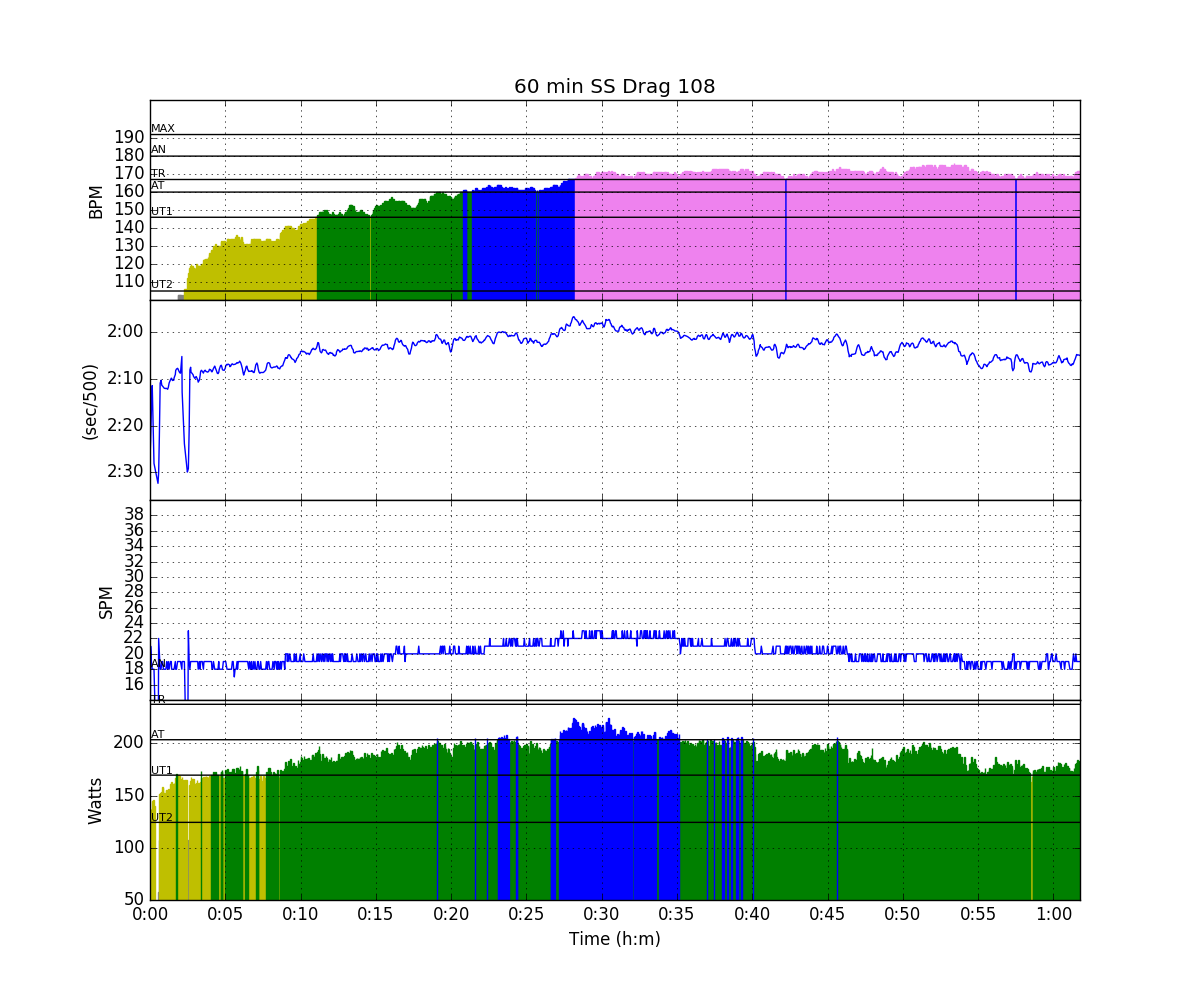
Managed to get all my work work done by 4pm and drove home quickly for a Steady State workout. This time, I chose a 2000/1750/1500/1250/1000/1000/1250/1500/1750/2000 format which is exactly 15km and a bit over an hour in my version:
Workout Summary - media/20161202-1630100o.csv

--|Total|-Total-|--Avg--|-Avg-|Avg-|-Avg-|-Max-|-Avg

--|Dist-|-Time--|-Pace--|-Pwr-|SPM-|-HR--|-HR--|-DPS

--|15000|61:46.0|02:03.5|189.6|20.1|159.1|176.0|12.1

W-|15000|61:46.0|02:03.6|188.6|20.0|158.3|176.0|12.2

R-|00000|00:00.0|00:00.0|000.0|00.0|000.0|176.0|00.0

Workout Details

#-|SDist|-Split-|-SPace-|-Pwr-|SPM-|AvgHR|MaxHR|DPS-

01|02000|08:53.4|02:13.4|163.9|18.2|116.5|140.0|12.3

02|01750|07:12.3|02:03.5|185.7|19.4|147.7|157.0|12.5

03|01500|06:04.6|02:01.5|195.0|20.2|157.3|162.0|12.2

04|01250|05:01.8|02:00.7|198.8|21.2|162.2|164.0|11.7

05|01000|03:55.8|01:57.9|213.8|22.2|169.0|172.0|11.4

06|01000|03:58.3|01:59.1|206.8|22.2|170.0|171.0|11.3

07|01250|05:01.2|02:00.5|200.2|21.2|171.8|173.0|11.7

08|01500|06:07.0|02:02.3|191.3|20.4|170.4|174.0|12.0

09|01750|07:10.2|02:02.9|188.6|19.5|172.5|175.0|12.5

10|02000|08:22.3|02:05.6|177.0|18.8|170.3|176.0|12.7
I rowed this as a “Just Row” on the erg, using Painsled to record the data and send it to workouts @ rowsandall.com, and rowsandall.com to split this up in the right segments after the row.
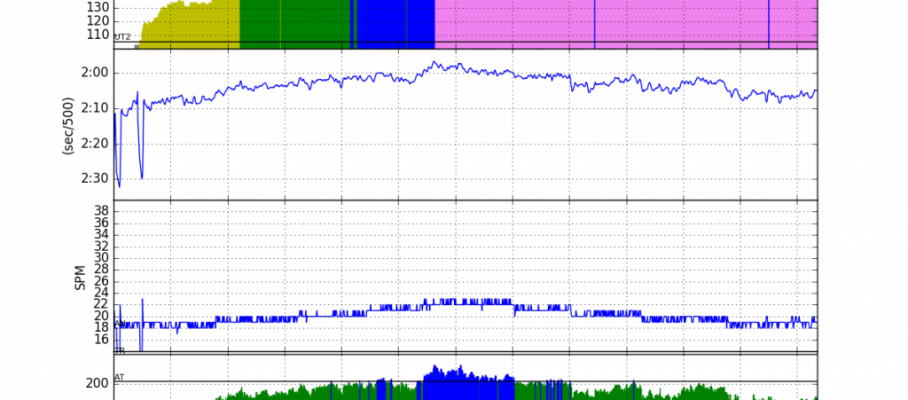
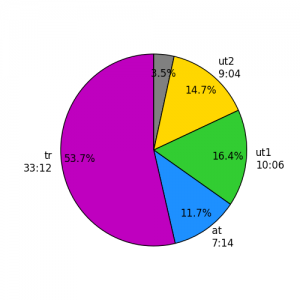
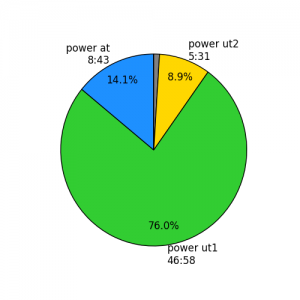
And here are the plots:
I ended at a slightly higher Work Per Stroke (“SPI”) than I started. All in all I am happy with the workout, even though I found the heart rates a bit on the high side.


Feb 27 2017
First Empower Connected Row
So today I had a long gap between a busy first half of the working day and the evening series of conference calls, which was ideal to drive to Pisárky and do a longish outing in the single. This time I did pay attention to switching on the SpeedCoach correctly.
I did three “rivers”, i.e. rowing up to the hydro plant in Komín and back. That is a little over 2km per stretch of river, 4.4km per loop, and the total workout duration was 13km.
Rowing on a river is interesting for me as a lake dweller. There is much more waterfowl and bird life to watch during the row. Except for two mean looking swans that is really a plus. The other difference is how close you are to people walking on the banks. Mothers with prams and small children. People relaxing on park benches. People standing on bridges, just staring at the water. And most of those people smiled at me, which is great.
I played with the SpeedCoach settings. With the Empower oarlock, there is a whole set of new parameters to watch during as well as after the workout. The “classic” screen looks like this:
You set up the top row before the outing, but you can very easily switch what is displayed on the bottom row at the turning points. I was running the Garmin Forerunner in backup mode, so I didn’t need to see heart rate. Here are the settings I chose:
I found the effective drive length a really interesting metric to display during the row. I have to work on my sequencing, and when I do this right, I see that I maintain the effective length well above 85 degrees. When I become lax, it drops quickly. Average power seemed to be more relevant when you do pieces. I couldn’t relate much to the force numbers. I also liked to watch “work per stroke” but it isn’t entirely clear to me how to use it. Perhaps when you do rate ladders, you can try to keep this value constant when you go up the ladder.
Talking about all those metrics, here is what rowsandall.com had to say about correlations. Mind you, this is for a single row and I mainly rowed at 20spm.
Interesting that “wash”, which has to be low, strongly correlates with Peak force, power, drive length, finish angle. The only concern I have here is that with the twisty river, there were a lot of strokes where I was steering. Especially on the turns to starboard, where I row a slightly shorter, weaker stroke with my starboard scull, this may lead to a relatively large portion of “non-relevant” strokes.
Export to Strava, now with real power values:
Here are the big plots:
And here are the metrics plots:
I leave them without comments for now.
Now that I am a first-hand user of the Empower, I already discovered a couple of improvements that I need to implement on rowsandall.com. Also, I am suspicious of the drive length. Probably a small mistake in a calculation I made. I like how the SpeedCoach talks about drive length in degrees and I like the “effective drive length” parameter. To make this maximally effective, I will add these parameters exactly as they are represented during the row. That makes it easier for coaches and rowers to analyze the training and then transfer the lessons learned to the next practice.
Next time I will try out the “skill” screens of the SpeedCoach.
http://www.nkhome.com/rowing-sports/empower-oarlock
By sanderroosendaal • Uncategorized • 0 • Tags: empower, NK, NK speedcoach, OTW, rowing, single, steady state, training