Aug 1 2017
Rate Ladders
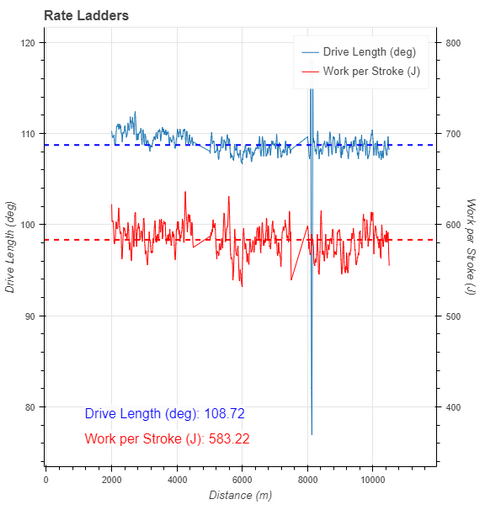
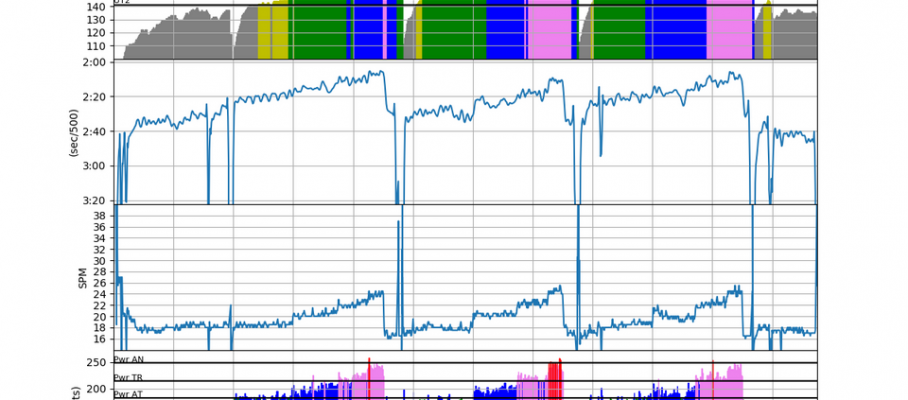
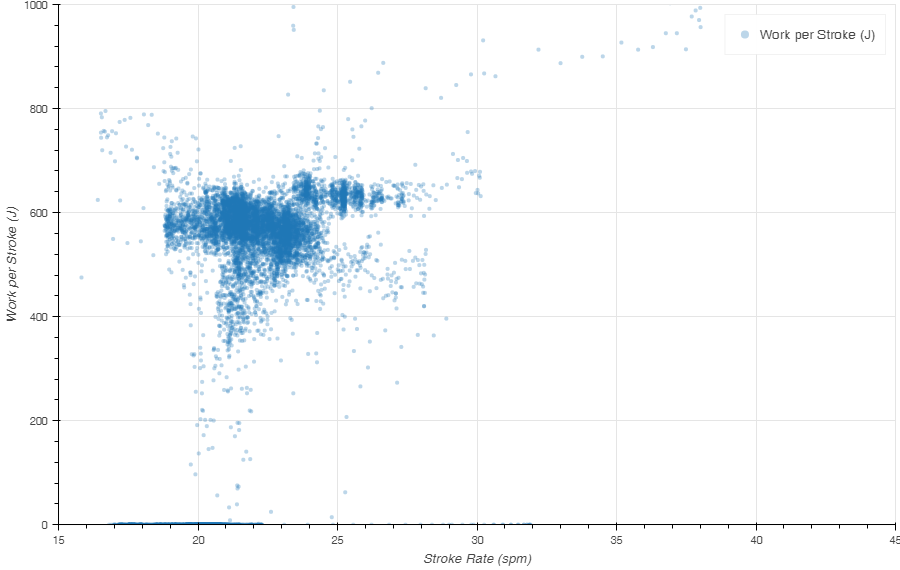
I managed to get to the lake before work, but not early enough to do more than a 12k workout. I actually think that is a good thing, because I was still feeling tired from Monday’s Pete Plan Pyramid (OTW version). The plan called for steady state (16k) but I decided to use the shorter format to spice it up slightly. I went for rate ladders. Our lake is a little under 3km long from “Rokle” to “Sirka”. (You can actually do a full length 3k if you row from “behind Rokle”, but then you have a turn at the beginning.) So I decided to do 1k/750m/500m/250m/rest of lake at 18spm/20spm/22spm/24spm/16spm. So I would gradually rate up, trying to hold just under 600 J on the Work per Stroke metric (Empower Oarlock), until a 250m at 24spm, and then I would fall down to 16spm, while still holding 600J, until I ran out of lake. A turn, sip of water, repeat.
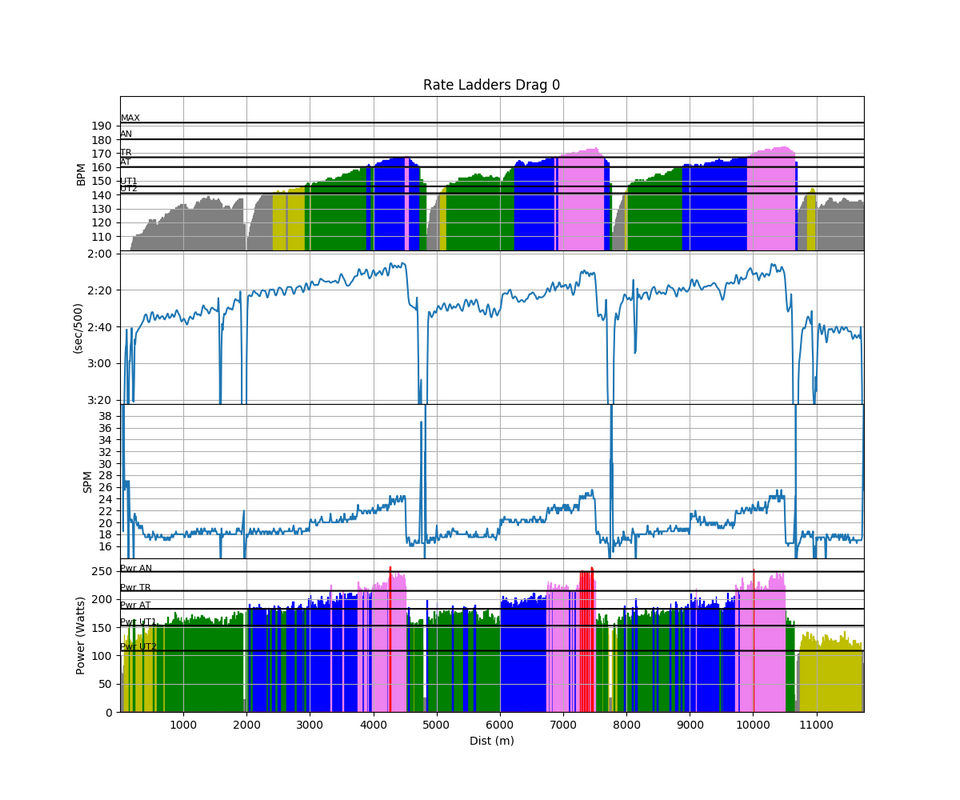
Workout Summary - media/20170801-093716-Sanders SpeedCoach 20170801 0653amo.csv
--|Total|-Total-|--Avg--|-Avg-|Avg-|-Avg-|-Max-|-Avg
--|Dist-|-Time--|-Pace--|-Pwr-|SPM-|-HR--|-HR--|-DPS
--|11751|61:24.0|02:36.8|170.9|20.2|147.5|175.0|09.5
W-|10252|50:02.0|02:26.4|177.0|20.0|147.1|175.0|10.3
R-|01500|11:22.0|03:47.5|120.8|20.4|144.1|175.0|00.0
Workout Details
#-|SDist|-Split-|-SPace-|-Pwr-|SPM-|AvgHR|MaxHR|DPS-
00|02000|11:16.1|02:49.0|141.4|20.4|121.0|139.0|08.7
01|01000|04:40.3|02:20.1|181.4|18.5|139.4|149.0|11.6
02|00750|03:22.5|02:15.0|198.1|20.3|152.3|158.0|10.9
03|00500|02:09.9|02:09.9|218.4|22.2|161.6|165.0|10.4
04|00250|01:03.2|02:06.3|239.7|23.8|166.7|167.0|10.0
05|01000|04:58.4|02:29.2|172.6|17.9|150.4|155.0|11.2
06|00750|03:35.6|02:23.7|196.7|20.3|160.9|166.0|10.3
07|00500|02:17.7|02:17.7|216.7|22.3|168.7|171.0|09.8
08|00250|01:05.1|02:10.2|242.2|24.5|172.4|173.0|09.4
09|01000|04:42.3|02:21.2|176.3|18.3|154.4|162.0|11.6
10|00750|03:26.0|02:17.4|191.2|20.1|163.4|166.0|10.9
11|00500|02:11.5|02:11.5|219.0|22.2|169.6|173.0|10.3
12|00250|01:03.9|02:07.8|236.8|24.3|173.6|175.0|09.6
13|00752|04:09.8|02:46.1|115.1|17.9|134.6|138.0|10.1
As the water was mirror flat, and the temperature just after sunrise a nice 22 degrees C, it just required a bit of concentration to hit those numbers:
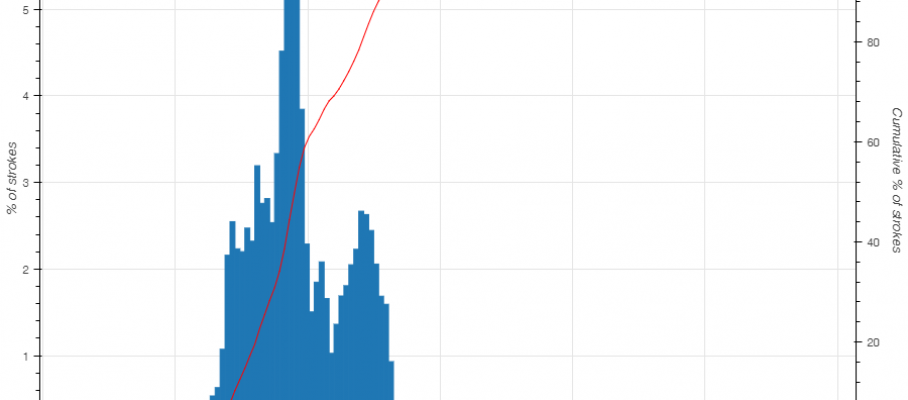
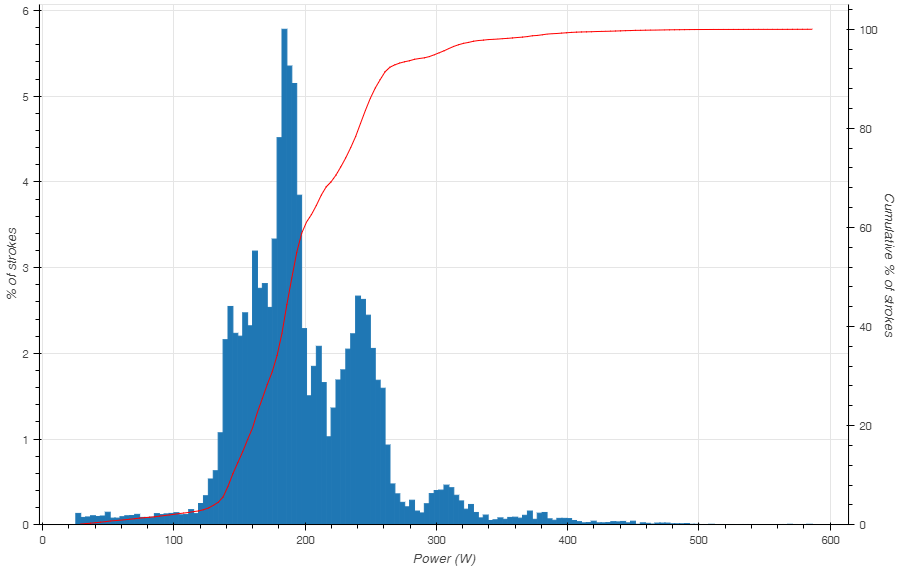
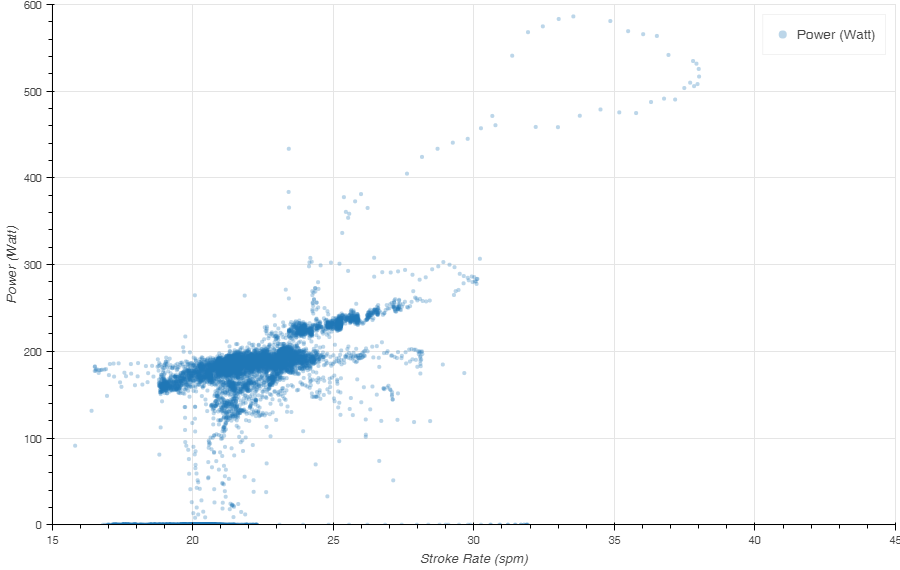
Just for fun, here is the distribution of strokes in terms of power and pace:
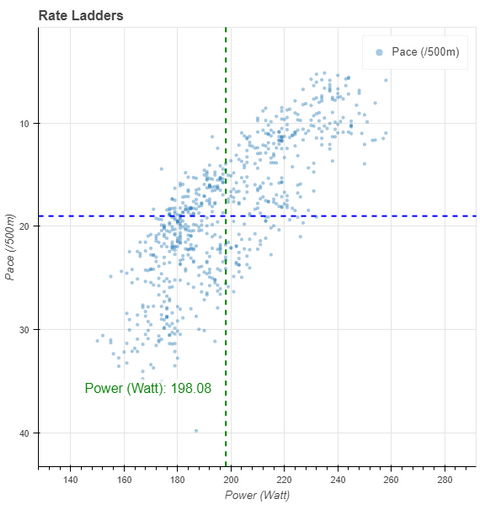
There was a slight wind when I started (tailwind in the first set, headwind in the second) but the wind strength was decreasing as the session progressed. I think that explains the spread of pace values.
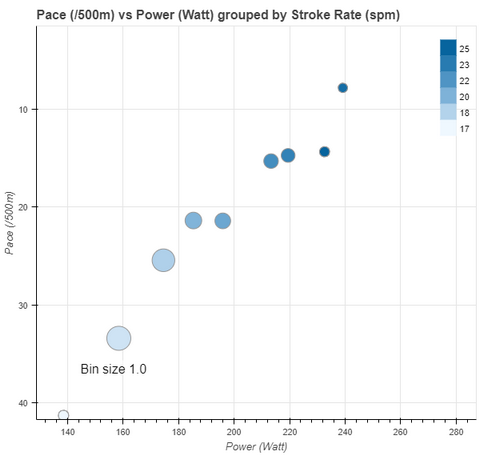
The Trend Flex chart averages all that out:
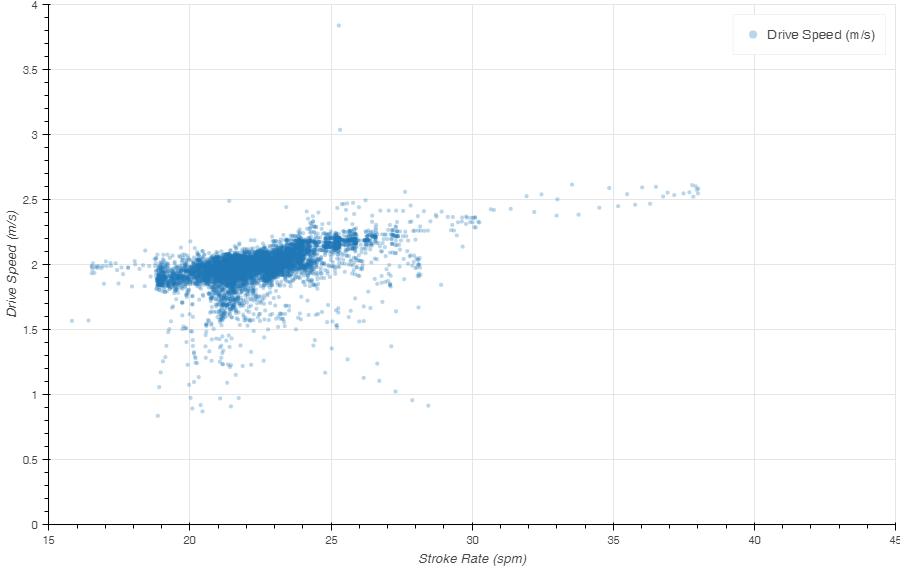
Monitoring the Work per Stroke over the past three months, here is the Box Chart of Work per Stroke for all strokes in the 15 to 25 spm range with more than 400 J (to eliminate paddle strokes):
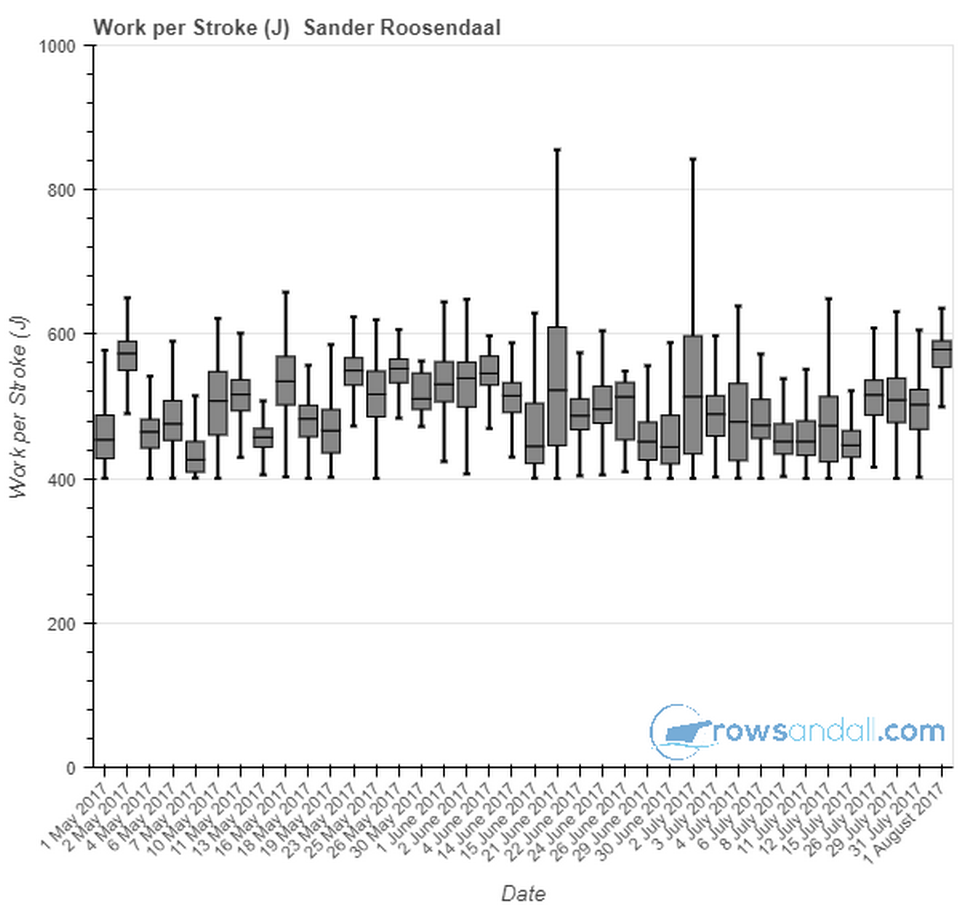
Perhaps “just under 600 J” is a bit too much and my natural stroke should be in the 500-550J range? Looking at the trend for race pace strokes (chart below), I have been rowing them at a higher Work per Stroke. Wrongly, perhaps?
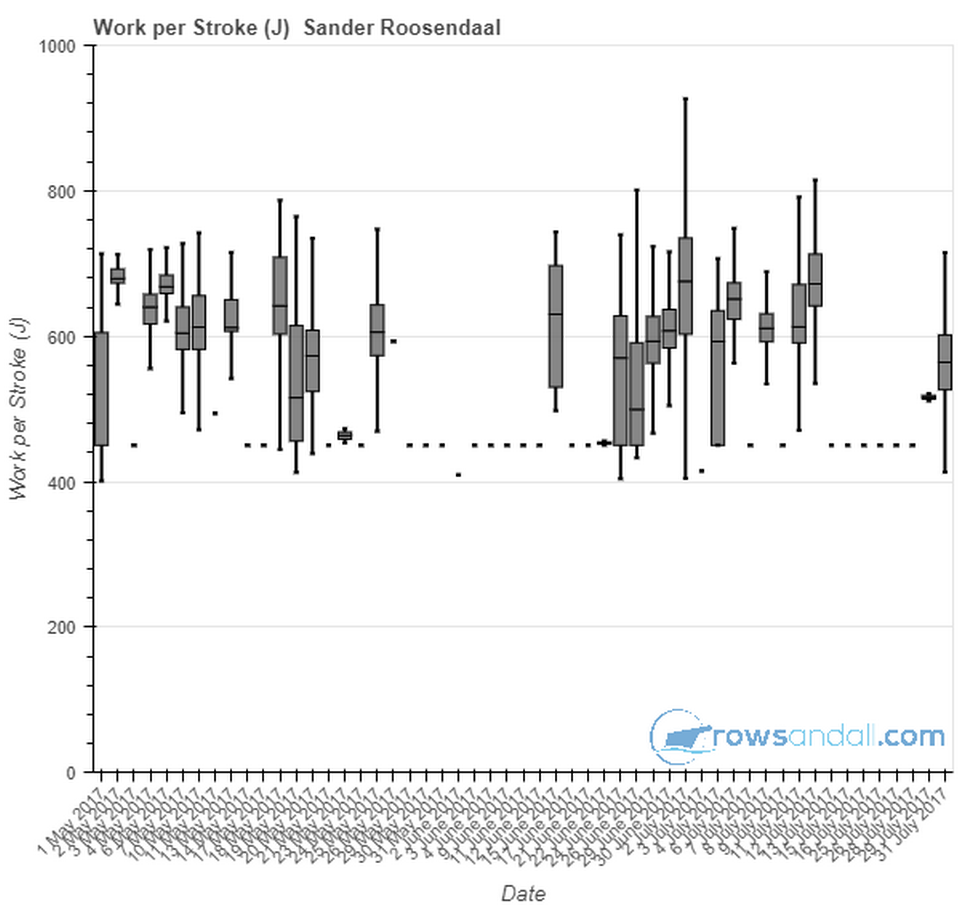
Anyway, glad that I have the data allowing me to ask those questions.
Apr 7 2019
No fiddling!
These guys seem to be happy fiddling, but the combination of Sander, rowing electronics, and fiddling is not a pretty sight.
Today there was too much fiddling with the Quiske app. I had moved the sensor to under the seat, but I am always uncertain about the correct orientation of the pod, and there is no quick google answer to that. Quiske has a couple of user guides and other documents, but all I need is a simple table which I could print out and put on the inside of my locker door.
I think I got this correct, but I need to check it.
What added to my frustration is that the Quiske app sometimes doesn’t update the lines. The only way to get it to behave again is to go out of the application, kill it, and start again. Or, at least, that seems to be the procedure. On the water, of course, I am trying out all kinds of menu and settings combinations before I kill the app.
Anyway, enough about fiddling.
When I had finally set up my gear correctly at the end of the warming up, I was happy to find myself alongside another Masters team. In the spirit of GDPR, I shall not reveal who it was, but suffice to say it was a big, coxed, sweep boat. And there were eight ladies in it. Of varying age. The prettiest lady being Martin on stroke seat.
So, of course, I wanted to focus on technique, get some good Quiske curves measured at various stroke rates, but I also wanted the eight to not pass me.
We did three full lake stretches of about 3 kilometers each, and the score was 3-0 for the single sculler. Well, in the first two stretches the eight was also doing technique drills, but in the final one, they were rowing at a steady pace.
Workout Summary - media/20190407-172713-Sharing file: SpdCoach 2136923 20190407 0426PMo.csv

--|Total|-Total-|--Avg--|-Avg-|Avg-|-Avg-|-Max-|-Avg

--|Dist-|-Time--|-Pace--|-Pwr-|SPM-|-HR--|-HR--|-DPS

--|11412|67:38.0|02:57.8|162.0|22.9|148.8|184.0|07.4

W-|05264|24:53.0|02:21.9|216.5|23.6|164.1|184.0|09.0

R-|06157|42:45.0|03:28.4|130.3|22.6|139.9|184.0|03.8

Workout Details

#-|SDist|-Split-|-SPace-|-Pwr-|SPM-|AvgHR|MaxHR|DPS-

01|00490|02:29.0|02:31.9|196.0|19.8|134.5|143.0|10.0

02|00150|00:46.0|02:32.9|186.3|19.5|134.7|145.0|10.1

03|00221|01:04.8|02:26.7|207.1|21.2|161.1|164.0|09.6

04|00251|01:10.0|02:19.7|229.8|24.0|164.9|172.0|08.9

05|00233|01:04.3|02:18.2|256.0|26.0|171.4|176.0|08.3

06|00422|02:01.0|02:23.3|193.3|20.8|152.7|161.0|10.0

07|00282|01:17.1|02:16.6|214.6|23.0|164.1|170.0|09.5

08|00284|01:10.0|02:03.2|265.3|27.4|170.2|177.0|08.9

09|00120|00:30.9|02:08.3|266.6|27.3|158.2|163.0|08.6

10|02810|13:20.4|02:22.4|215.9|24.4|172.3|184.0|08.6
The summary table shows the splits for the pink intervals shown on the chart. Looks like it was a bit harder training than intended. Well, I don’t think it hurt me. A bit of good sparring with random other crews (preferably when they are not aware they are in a race) is always healthy, I think. It pushes me a bit further.
And now follows a whole bunch of Quiske charts.
An interesting observation. At 22spm, my seat is accelerating during the recovery, but as stroke rate increases this acceleration disappears and at 28spm (and higher) the maximum seat speed is during the middle of the recovery.
Seat speed during recovery is, for me on the single at least, an intuitive thing. I hope I am trying to not slow the boat down too much, but to be honest I am not sure how I determine the subtle things (or not so subtle things) I do on the recovery. I did not try to change my natural rowing style in this outing. I just wanted a good baseline of my current style.
By accident, I produced the above chart with the handy red lines on the Quiske web portal. I presume the lines coincide with, from left to right:
So what can we learn from this chart? To me the most significant point to notice is how much the boat slows down after the seat speed reversal. What Quiske cannot say if this is before or after the blade has entered the water. Here is a “powerpoint attempt” to determine this.
So what have I done here? I basically combined a few analyses from yesterday and today, selecting strokes at 27-28spm. I looked at the boat acceleration curves (not shown here) and determined that they were all very similar. From that, I conclude that these curves represent my typical (average) stroke at 28spm. Then I took screenshots of the oar angle velocity and seat speed curves (measured at different days) and in PowerPoint, I overlaid these charts, drawing a few vertical lines to indicate “significant” moments during the stroke. From left to right:
Interestingly, this set of measurements shows no sign of any funny movement just before the catch, like an extra reach or anything. I am sure Olympian rower have better timing around the catch than I do, but all in all I don’t see any big flaws, apart from using a back opening to do the catch.
And that’s a long story to say I need side video analysis.
By sanderroosendaal • Uncategorized • 0 • Tags: analysis, quiske, rowing, single, sparring, steady, training