Monday
No exercise.
Tuesday
Prototype testing day. Romana and I were out in the double wearing some interesting new rowing kit. I am not going to tell much about it, but it was very interesting.
After the session, we analyzed the data, and zoomed in on a technique flaw of mine, around the catch. I should get my GoPro out and do a good side video, or have someone shoot a good side video from the launch. What we saw from the prototype’s data, my shoulders do a funny extra moment just before the catch.
I am wondering if it is related to this thing:

I mean the red circle. This is my oar angle velocity as measured with the Quiske pod. It basically says that the oar turning point is way before the point where the boat deceleration is maximum. So I am pushing on the footstretcher before my blade is fully immersed. Quiske doesn’t tell me if this is “missing water” or if this coming into the front stops too hard. More about that later (under the Saturday header below).
Wednesday
There are many things wrong with this summary of the 4x5min/4min workout.
Workout Summary - media/20190403-1917150o.csv

--|Total|-Total-|--Avg--|-Avg-|Avg-|-Avg-|-Max-|-Avg

--|Dist-|-Time--|-Pace--|-Pwr-|SPM-|-HR--|-HR--|-DPS

--|07256|35:59.0|02:28.8|152.2|21.0|160.3|182.0|09.6

W-|05326|19:50.0|01:51.7|235.6|26.5|167.4|181.0|10.1

R-|01934|16:00.0|04:08.1|050.3|14.3|151.2|181.0|00.0

Workout Details

#-|SDist|-Split-|-SPace-|-Pwr-|SPM-|AvgHR|MaxHR|DPS-

00|01366|05:00.0|01:49.8|239.1|26.1|164.9|179.0|10.5

01|01348|05:00.0|01:51.2|233.3|25.8|169.2|181.0|10.4

02|01351|05:00.0|01:51.0|239.8|27.0|169.8|181.0|10.0

03|01261|04:50.2|01:55.1|230.0|27.2|165.7|178.0|09.6
The instructions said “4x5min” 1-2 at 26spm, then 3-4 at 28spm. I thought that the coach meant doing the first 1 or 2 minutes of each interval at 26spm, then increase to 28spm. I later found out that I was supposed to row the entire first two intervals at 26spm, and the final two at 28spm.
Oh well.
I actually thought that this was going to be too easy and was planning a fifth interval, to make this look closer to the 5x1500m/5min Pete plan workout. Well, here is what I did:
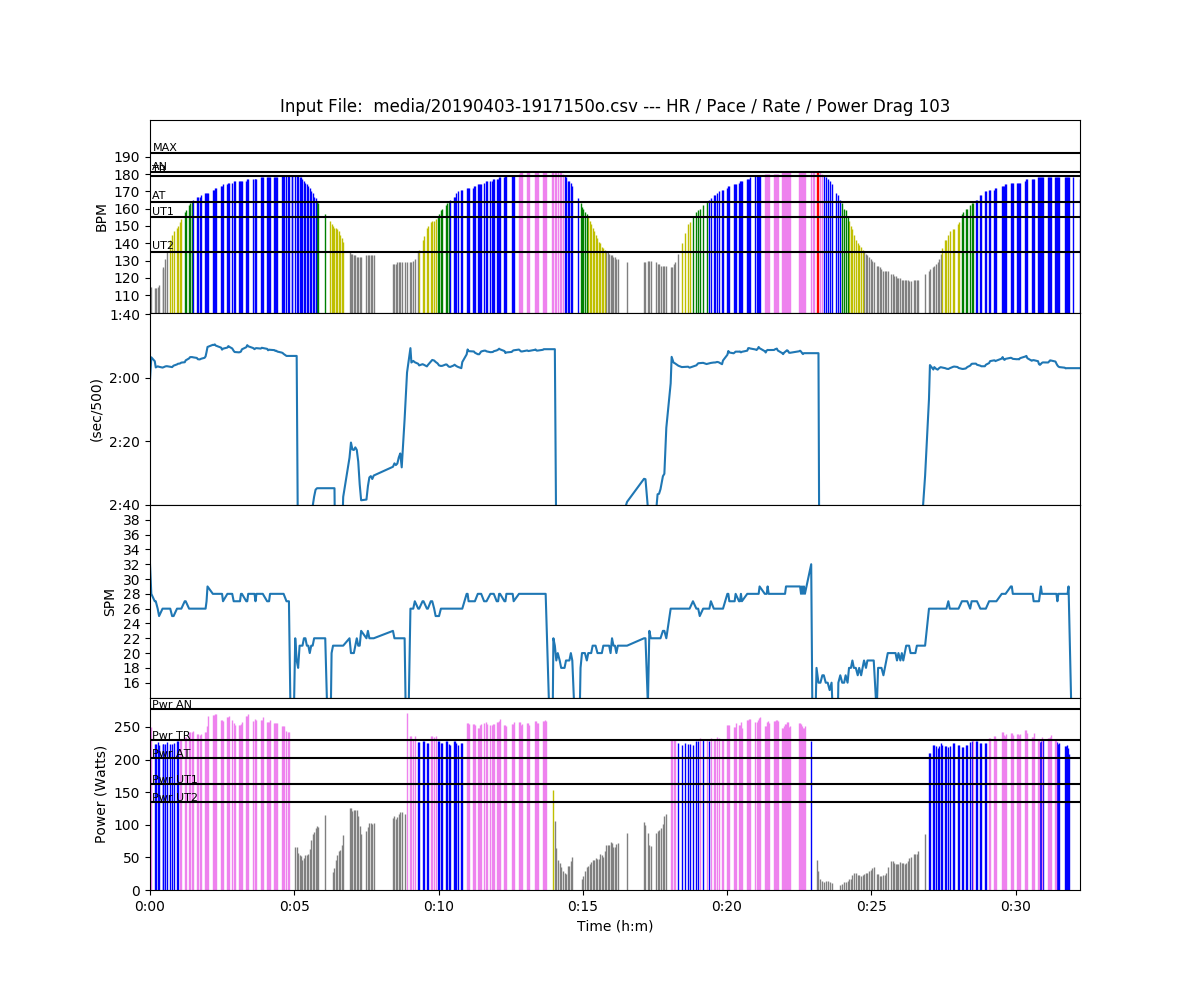
You see how the chart is missing strokes? That is PainSled dropping strokes, and it seems to be a BlueTooth issue. Greg Smith has done some extensive investigations and found that other apps on the same phone (ErgData) do not show the dropped strokes, using the same combination of bluetooth speakers (earphones) and PM5 connected to the phone through BlueTooth. He’s working with the Painsled developer to figure out what happened and how to correct it.
But you can still see how I was completely gassed in the fourth interval, so I didn’t attempt a fifth one.
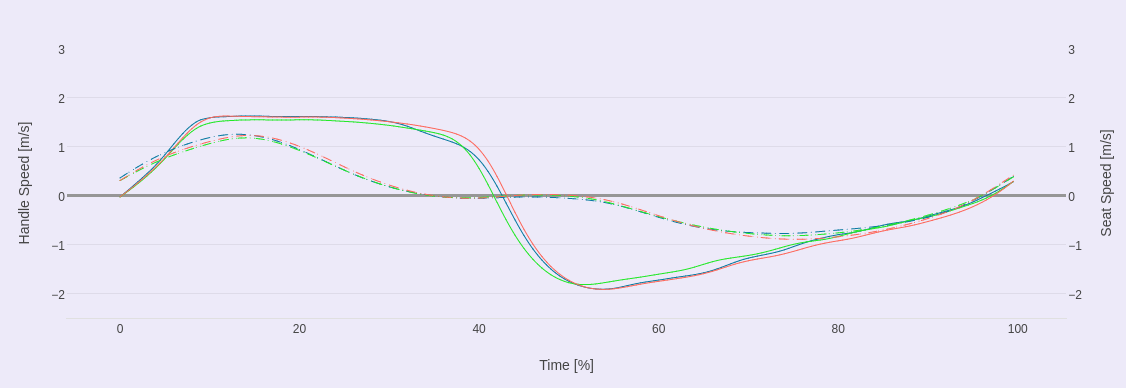
The chart above is the Quiske record for one of the intervals, green line for 26spm, blue line for 28spm and red for entire session. Solid lines are handle speed and dashed lines are seat speed.
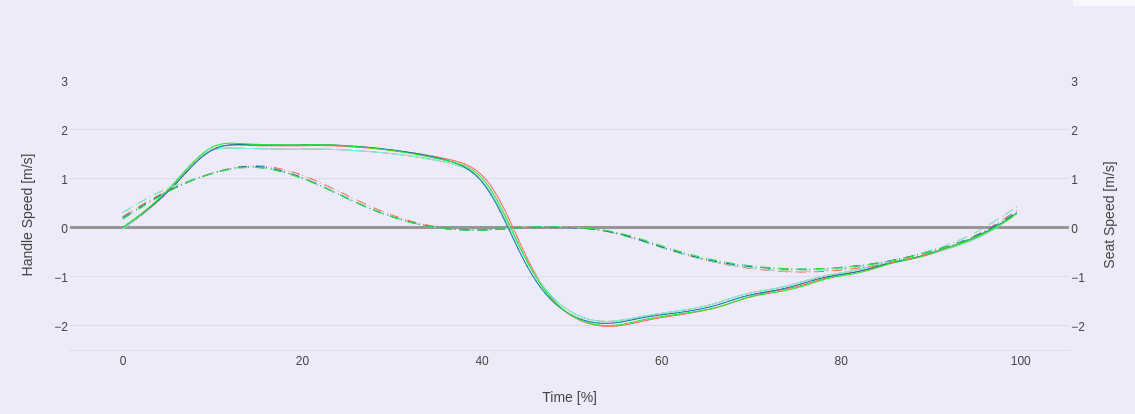
This chart shows the entire interval average curves for all four intervals. So first the good:
- [35% to 55% of time on the chart] Almost no seat movement during the last part of the stroke and the first part of the recovery – which is the arm swing mostly
- [80% to 100% of time on the chart] During the second half of the recovery, handle and seat have the same speed, as they should. That means that I am completely rolled up with my back and I am just sliding forward in catch position
- … that’s it. I can’t think of any other good things to say.
Now the questionable:
- [0-5% on the chart] In the first part of the drive, the handle speed is slower than the seat speed. It looks like I am shooting my bum a bit before the handle picks up speed.
- [0-20% on the chart] Nowhere in the first part of the drive is the handle speed equal to the seat speed. Actually, soon after the bum shooting, my back opens and the handle speed starts exceeding the seat speed.
Ideally, you would like to see the dashed and solid lines overlapping for the first part of the drive. The interesting thing was that I was looking at this chart during the row and I had the feeling I was rowing stroke profile that was closed to ideal for many strokes. Below, you will see that I have the same observation on the water. It seems almost as if the Quiske app (used during the row) is more positive than the Quiske cloud (used for post workout analysis, to generate the charts above). I guess I need to start making screenshots during the row.
By the way, I moved away from the “Quiske Virtual Coach” view and started looking at the raw curves directly. I want to work on one aspect of my technique, and the Quiske Virtual Coach gives feedback on 5 points after each stroke. I find that too much data. Using the stroke curve directly, I find it easier to focus on one aspect and on the technique flaw that is related to it.
Thursday
A 45 minute run. This was on the schedule, and it was an ideal way to workout in the evening. It’s light longer now, and I really enjoyed running through the forest.
We have some pretty tough things going on at work, and I am sure I wouldn’t have lasted for 45 minutes on the erg. I didn’t have time to drive to the lake and take a single (it would have been dark already).
In fact, the work things were going through my head during most of my run, and I even wrote up a “stream of consciousness” paragraph or three after the run. I need to look at it, check if it’s total crap or not. But perhaps that doesn’t matter. It was a better way to relax than to watch TV.
Friday
An hour long session in the gym. In fact, I paid a personal trainer to look at my muscles and their balance. She praised my lats and admired my “Plank”, but the rest was heavily criticized. We didn’t really do a workout, but basically went through all the exercises and worked on good form. I have been doing a couple of exercises wrong, employing the wrong set of muscles. Excellent feedback, and I am probably going to take a few more sessions with her, to see how she lays out the program.
Saturday
The workout (OTW) was 2x3km/7min. It was nice weather. Slight rain when we drove to the club but it cleared up. There was a mild wind, which was a head wind in the first interval and a tailwind in the second one.
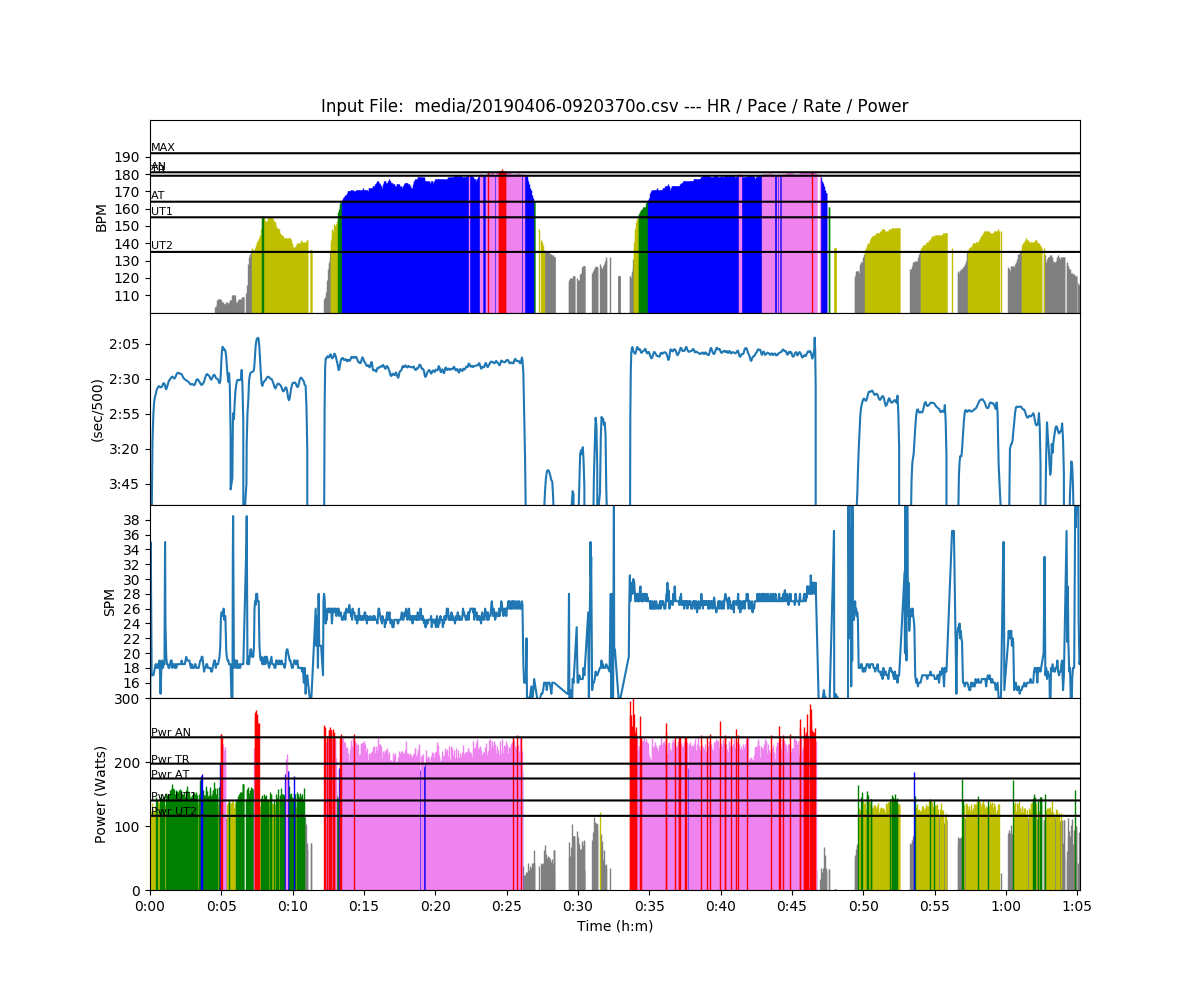
Here are the summary data (obtained by the Rowsandall summary “Interval by Power” function, which is very handy for OTW workouts).
Workout Summary - media/20190406-0920370o.csv

--|Total|-Total-|--Avg--|-Avg-|Avg-|-Avg-|-Max-|-Avg

--|Dist-|-Time--|-Pace--|-Pwr-|SPM-|-HR--|-HR--|-DPS

--|11309|65:12.0|02:53.0|153.7|21.9|147.9|183.0|07.9

W-|06133|27:44.0|02:15.7|221.9|26.0|172.2|183.0|08.5

R-|05179|37:28.0|03:37.1|103.3|18.9|129.9|183.0|06.9

Workout Details

#-|SDist|-Split-|-SPace-|-Pwr-|SPM-|AvgHR|MaxHR|DPS-

01|00082|00:21.9|02:14.0|224.4|24.6|105.9|108.0|09.1

02|00101|00:25.8|02:07.8|250.2|25.6|138.9|143.0|09.2

03|02974|13:54.4|02:20.3|216.2|25.1|172.7|183.0|08.5

04|02976|13:02.0|02:11.4|227.0|27.1|174.5|182.0|08.4
So a 2:15.7 average pace. Here’s the SPM and boat speed in one chart:
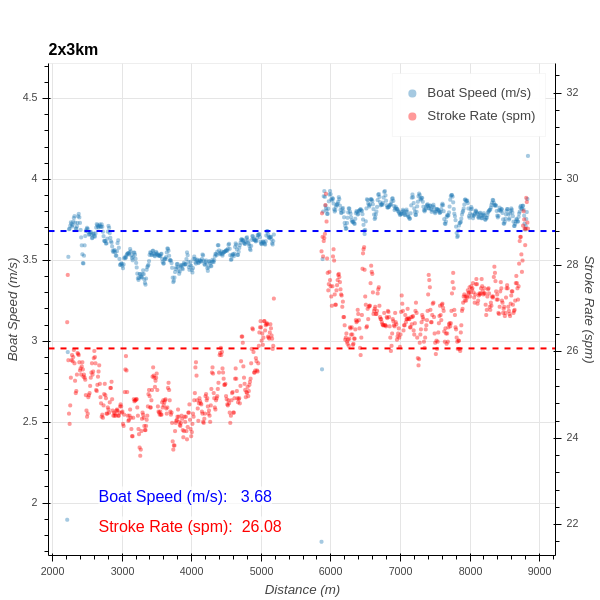
I checked a few 6k efforts that I did in the fall, and there my average boat speed was around 3.7 m/s, so 0.5% faster but without the 7 minutes rest in the middle. Maybe I shouldn’t be too worried about my base speed. Especially considering that my stroke rate was significantly lower than the target rates today. I was lazy, but not slow.
Let’s look at technique. This is from the second 3k. The green curve is just before the end of the interval.
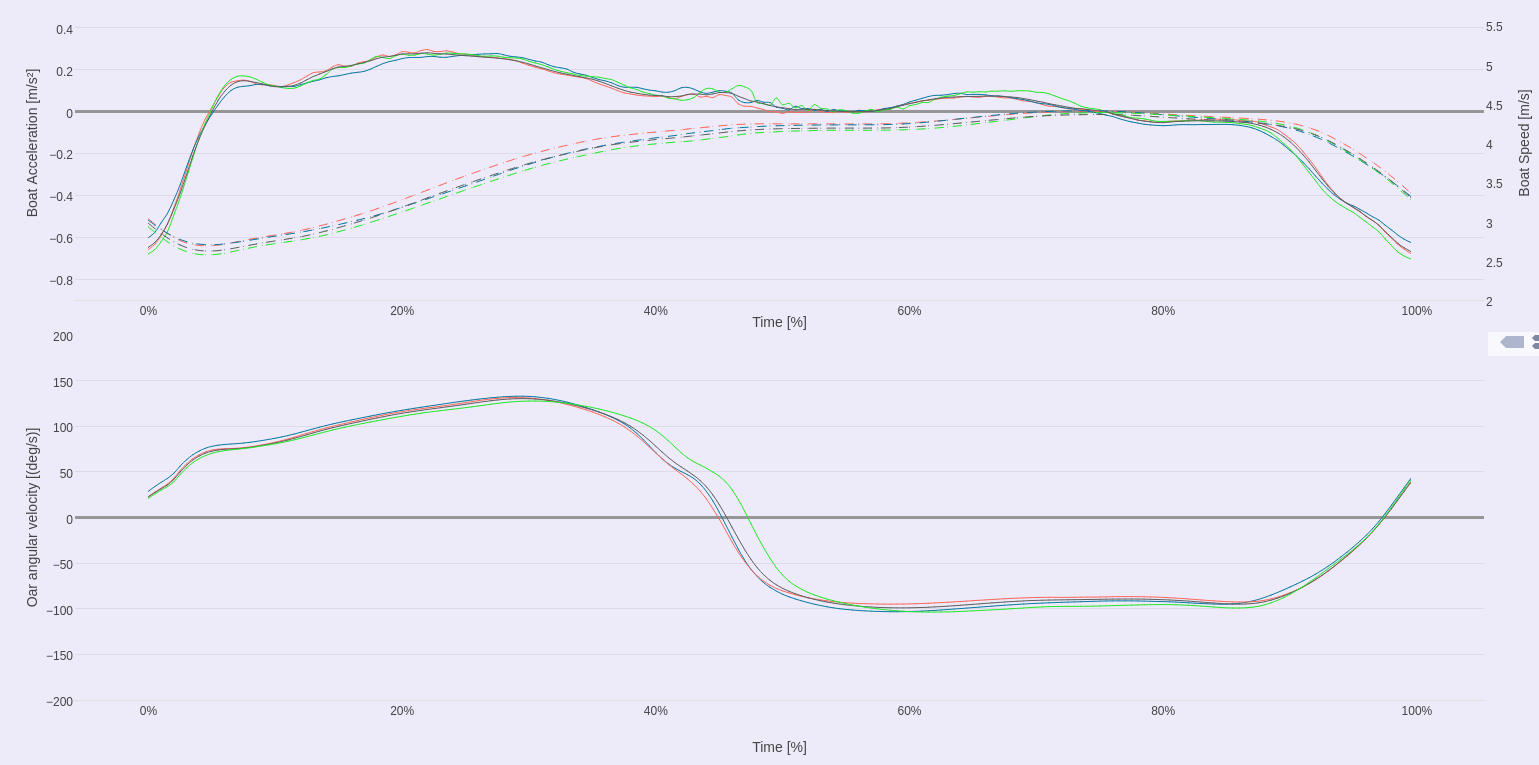
I am disappointed to see that the oar angle velocity doesn’t start at 0! I remember it looking a bit better on the phone screen during the row. It’s also interesting to see the differences between handle speed and oar angle curve. One cannot compare these quantities one to one, as the erg handle goes in a straight line while the scull rotates around the pin.
Being conscious of the catch during the row, I checked my blade splash a few times, and I do have a nice V splash. That indicates that my blade is going in at the right speed. I think that it is too simple to say that I am missing water at the catch. It’s more about the dynamics of how I accelerate and decelerate during the recovery and how much I check the boat around the catch.
I think I need to do some seat speed rows as well and see what’s going on.
In the 2k cooling down I did a technical drill aimed at improving the dynamics around the catch each 500m. That helped a lot.
Follow me in social media
Like this:
Like Loading...
Apr 6 2019
Week Review
Monday
No exercise.
Tuesday
Prototype testing day. Romana and I were out in the double wearing some interesting new rowing kit. I am not going to tell much about it, but it was very interesting.
After the session, we analyzed the data, and zoomed in on a technique flaw of mine, around the catch. I should get my GoPro out and do a good side video, or have someone shoot a good side video from the launch. What we saw from the prototype’s data, my shoulders do a funny extra moment just before the catch.
I am wondering if it is related to this thing:
I mean the red circle. This is my oar angle velocity as measured with the Quiske pod. It basically says that the oar turning point is way before the point where the boat deceleration is maximum. So I am pushing on the footstretcher before my blade is fully immersed. Quiske doesn’t tell me if this is “missing water” or if this coming into the front stops too hard. More about that later (under the Saturday header below).
Wednesday
There are many things wrong with this summary of the 4x5min/4min workout.
Workout Summary - media/20190403-1917150o.csv
--|Total|-Total-|--Avg--|-Avg-|Avg-|-Avg-|-Max-|-Avg
--|Dist-|-Time--|-Pace--|-Pwr-|SPM-|-HR--|-HR--|-DPS
--|07256|35:59.0|02:28.8|152.2|21.0|160.3|182.0|09.6
W-|05326|19:50.0|01:51.7|235.6|26.5|167.4|181.0|10.1
R-|01934|16:00.0|04:08.1|050.3|14.3|151.2|181.0|00.0
Workout Details
#-|SDist|-Split-|-SPace-|-Pwr-|SPM-|AvgHR|MaxHR|DPS-
00|01366|05:00.0|01:49.8|239.1|26.1|164.9|179.0|10.5
01|01348|05:00.0|01:51.2|233.3|25.8|169.2|181.0|10.4
02|01351|05:00.0|01:51.0|239.8|27.0|169.8|181.0|10.0
03|01261|04:50.2|01:55.1|230.0|27.2|165.7|178.0|09.6
The instructions said “4x5min” 1-2 at 26spm, then 3-4 at 28spm. I thought that the coach meant doing the first 1 or 2 minutes of each interval at 26spm, then increase to 28spm. I later found out that I was supposed to row the entire first two intervals at 26spm, and the final two at 28spm.
Oh well.
I actually thought that this was going to be too easy and was planning a fifth interval, to make this look closer to the 5x1500m/5min Pete plan workout. Well, here is what I did:
You see how the chart is missing strokes? That is PainSled dropping strokes, and it seems to be a BlueTooth issue. Greg Smith has done some extensive investigations and found that other apps on the same phone (ErgData) do not show the dropped strokes, using the same combination of bluetooth speakers (earphones) and PM5 connected to the phone through BlueTooth. He’s working with the Painsled developer to figure out what happened and how to correct it.
But you can still see how I was completely gassed in the fourth interval, so I didn’t attempt a fifth one.
The chart above is the Quiske record for one of the intervals, green line for 26spm, blue line for 28spm and red for entire session. Solid lines are handle speed and dashed lines are seat speed.
This chart shows the entire interval average curves for all four intervals. So first the good:
Now the questionable:
Ideally, you would like to see the dashed and solid lines overlapping for the first part of the drive. The interesting thing was that I was looking at this chart during the row and I had the feeling I was rowing stroke profile that was closed to ideal for many strokes. Below, you will see that I have the same observation on the water. It seems almost as if the Quiske app (used during the row) is more positive than the Quiske cloud (used for post workout analysis, to generate the charts above). I guess I need to start making screenshots during the row.
By the way, I moved away from the “Quiske Virtual Coach” view and started looking at the raw curves directly. I want to work on one aspect of my technique, and the Quiske Virtual Coach gives feedback on 5 points after each stroke. I find that too much data. Using the stroke curve directly, I find it easier to focus on one aspect and on the technique flaw that is related to it.
Thursday
A 45 minute run. This was on the schedule, and it was an ideal way to workout in the evening. It’s light longer now, and I really enjoyed running through the forest.
We have some pretty tough things going on at work, and I am sure I wouldn’t have lasted for 45 minutes on the erg. I didn’t have time to drive to the lake and take a single (it would have been dark already).
In fact, the work things were going through my head during most of my run, and I even wrote up a “stream of consciousness” paragraph or three after the run. I need to look at it, check if it’s total crap or not. But perhaps that doesn’t matter. It was a better way to relax than to watch TV.
Friday
An hour long session in the gym. In fact, I paid a personal trainer to look at my muscles and their balance. She praised my lats and admired my “Plank”, but the rest was heavily criticized. We didn’t really do a workout, but basically went through all the exercises and worked on good form. I have been doing a couple of exercises wrong, employing the wrong set of muscles. Excellent feedback, and I am probably going to take a few more sessions with her, to see how she lays out the program.
Saturday
The workout (OTW) was 2x3km/7min. It was nice weather. Slight rain when we drove to the club but it cleared up. There was a mild wind, which was a head wind in the first interval and a tailwind in the second one.
Here are the summary data (obtained by the Rowsandall summary “Interval by Power” function, which is very handy for OTW workouts).
Workout Summary - media/20190406-0920370o.csv
--|Total|-Total-|--Avg--|-Avg-|Avg-|-Avg-|-Max-|-Avg
--|Dist-|-Time--|-Pace--|-Pwr-|SPM-|-HR--|-HR--|-DPS
--|11309|65:12.0|02:53.0|153.7|21.9|147.9|183.0|07.9
W-|06133|27:44.0|02:15.7|221.9|26.0|172.2|183.0|08.5
R-|05179|37:28.0|03:37.1|103.3|18.9|129.9|183.0|06.9
Workout Details
#-|SDist|-Split-|-SPace-|-Pwr-|SPM-|AvgHR|MaxHR|DPS-
01|00082|00:21.9|02:14.0|224.4|24.6|105.9|108.0|09.1
02|00101|00:25.8|02:07.8|250.2|25.6|138.9|143.0|09.2
03|02974|13:54.4|02:20.3|216.2|25.1|172.7|183.0|08.5
04|02976|13:02.0|02:11.4|227.0|27.1|174.5|182.0|08.4
So a 2:15.7 average pace. Here’s the SPM and boat speed in one chart:
I checked a few 6k efforts that I did in the fall, and there my average boat speed was around 3.7 m/s, so 0.5% faster but without the 7 minutes rest in the middle. Maybe I shouldn’t be too worried about my base speed. Especially considering that my stroke rate was significantly lower than the target rates today. I was lazy, but not slow.
Let’s look at technique. This is from the second 3k. The green curve is just before the end of the interval.
I am disappointed to see that the oar angle velocity doesn’t start at 0! I remember it looking a bit better on the phone screen during the row. It’s also interesting to see the differences between handle speed and oar angle curve. One cannot compare these quantities one to one, as the erg handle goes in a straight line while the scull rotates around the pin.
Being conscious of the catch during the row, I checked my blade splash a few times, and I do have a nice V splash. That indicates that my blade is going in at the right speed. I think that it is too simple to say that I am missing water at the catch. It’s more about the dynamics of how I accelerate and decelerate during the recovery and how much I check the boat around the catch.
I think I need to do some seat speed rows as well and see what’s going on.
In the 2k cooling down I did a technical drill aimed at improving the dynamics around the catch each 500m. That helped a lot.
Follow me in social mediaShare this:
Like this:
By sanderroosendaal • Uncategorized • 0 • Tags: OTW, rowing, single, threshold, threshold training, training