May 13 2017
Friday: A short run
I stayed at work too long, so my window for OTW rowing was gone. I drove home, switched to running gear and set off. It was a nice, warm day, and it was good to be in the hilly forest behind our house, after a long time.
I decided to try out the Wahoo Tickr’s RunFit app, which promises to extract extra running metrics from the Wahoo Tickr X and I was curious to see how it works. Of course, I took the good old Garmin Forerunner 220 as a backup.
I had to make dinner for the family to come back from their race prep (it’s the International Youth Regatta in Brno this weekend), so I didn’t have too much time to run.
The RunFit app was interesting. After every kilometer, a computer lady voice told me “distance x kilometer heart rate 155 pace previous lap 5 minutes 7 seconds”. It annoyed me quite a lot, because the RunFit kilometers were about 100m shorter than the Garmin kilometers. I trust the Garmin more, because it is very consistent with the SpeedCoach, with CrewNerd (running on the same iPhone as the RunFit app) and with other apps. Interesting that an app running on the same hardware can disagree with another app. Funny algorithms. Not enough data smoothing. Something like that. It proves again that doing sports data science is not easy.
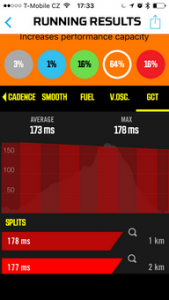
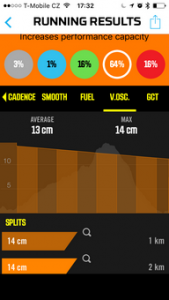
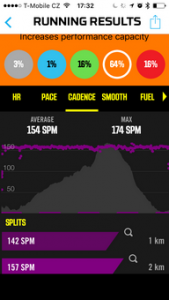
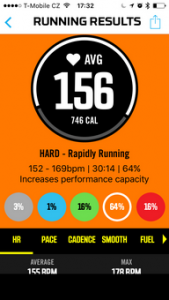
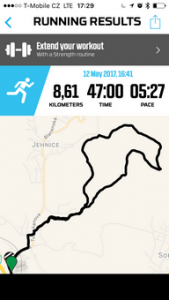
After the run, the app offered me the promised stats. Here they are (in screenshot form):
So apart from Cadence we have running smoothness, vertical oscillation and ground contact. So according to RunFit my ground contact was 173ms, and according to this link elite runners are under 200 ms. To be honest, I have no idea whether my running metrics are good or bad (and I honestly don’t care much as long as I don’t get injured while running), and to make matters worse, I don’t trust metrics measured by an app that doesn’t get distance right.
By the end of the run, the Garmin was 1km behind the RunFit app.
When I exported the run from RunFit to Strava, Runkeeper, and TrainingPeaks, I was curious to see if the extra metrics would make it across.
Strava? Nope
TrainingPeaks? The sync didn’t work, so I don’t know
Runkeeper? Nope
So all in all I am not so impressed. I am more impressed by the website VeloViewer, which integrates very nicely with Strava.
http://veloviewer.com/activities/982844482
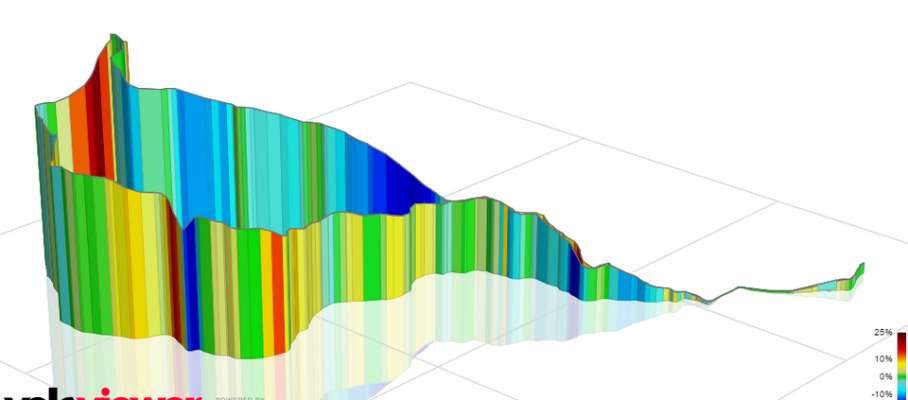
You can make cool 3D pictures like this one:
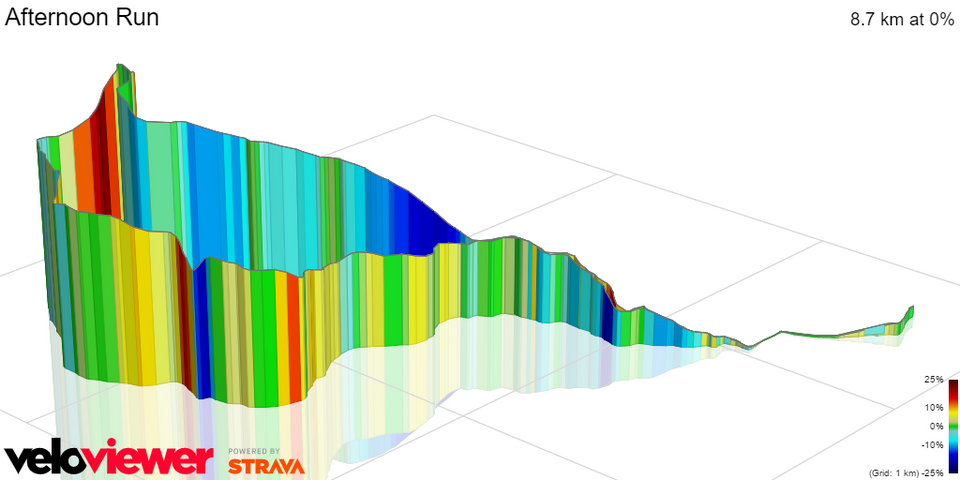
There are also a few plots and additional statistics to explore, and everything looks very nice and slick.
[amazon_link asins=’B00O5Y4FXA,B00KLAGSW8,B016PAPI3W,B013GVDTI4,B01MQMJM6G,B01KPUHBK6,B01MATKIWO’ template=’ProductCarousel’ store=’rowingdata-20′ marketplace=’US’ link_id=’be5273ff-37f1-11e7-9579-bb4eb5180272′]
May 13 2017
Saturday – Experimenting with footstretcher setting
There was no time for a long outing today. There wasn’t even the possibility, because the Youth regatta was in full swing and the lake was closed for other rowers.
I wanted to test some foot stretcher settings, so I figured that it was OK to use a remote corner of the lake that is outside the main traffic patterns.
There has been some discussion on rec.sport.rowing on how to set the footstretcher, and about speed gains to be achieved by setting the foot stretcher towards the stern (larger catch angle, more efficient stroke, etc). I decided to do an experiment.
Row 2x250m (one in each direction, with 250m “rest” to turn) with each foot stretcher setting. Try to hold 300W as closely as possible. Measure total time over 500m. Running start. Stroke rate free.
Today there was almost no wind and the water was flat.
The 300W is submaximal, which makes it easy to hold steady and focus on technique. So after a few minutes of warming up, I set off for the first set of 2x250m. Then I changed the footstretcher as much as possible towards the bow (where I was limited by my backstops which I didn’t want to change OTW), and repeated the experiment.
I did have the feeling that there was slightly more “light wind” than in the first run, though. This may have destroyed the experiment.
The second set with the bow-wards setting felt weird, and I had a lot of room between my belly and my scull handles at the tap-down. Here are the overview graphs: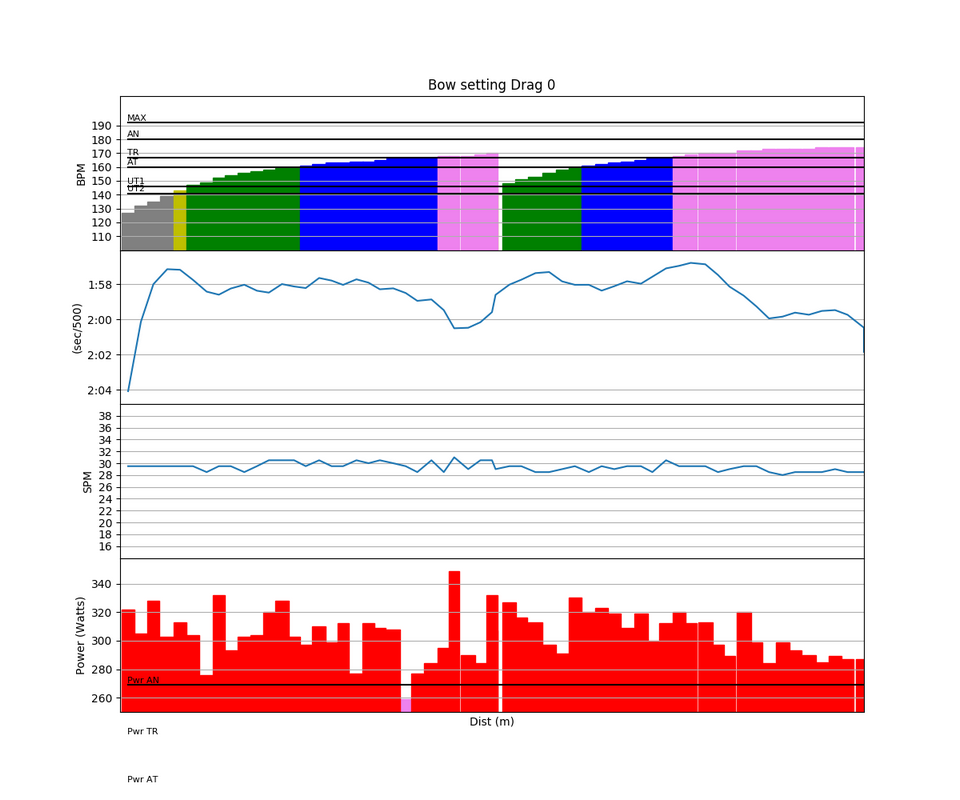
Here are the Empower force curves:
So only a 5 degree shift in catch and finish angles for what feels very different in the boat. The stroke felt much lighter with the bow-ward setting. Now on to the verdict.
My “normal” setting (larger catch angle):
Workout Summary - media/20170513-144854-Sanders SpeedCoach 20170513 0929amo.csv

--|Total|-Total-|--Avg--|-Avg-|Avg-|-Avg-|-Max-|-Avg

--|Dist-|-Time--|-Pace--|-Pwr-|SPM-|-HR--|-HR--|-DPS

--|00500|01:58.8|01:58.7|302.9|29.4|159.1|171.0|08.6

W-|00500|01:58.8|01:58.8|302.9|29.3|159.1|171.0|08.6

R-|00000|00:00.0|00:00.0|000.0|00.0|000.0|171.0|00.0

Workout Details

#-|SDist|-Split-|-SPace-|-Pwr-|SPM-|AvgHR|MaxHR|DPS-

00|00250|01:00.8|02:01.6|306.9|29.6|154.5|167.0|08.3

01|00250|00:58.0|01:56.0|298.7|29.1|163.9|171.0|08.9
And the “bow-ward” setting (shorter catch angle):
Workout Summary - media/20170513-144939-Sanders SpeedCoach 20170513 0938amo.csv

--|Total|-Total-|--Avg--|-Avg-|Avg-|-Avg-|-Max-|-Avg

--|Dist-|-Time--|-Pace--|-Pwr-|SPM-|-HR--|-HR--|-DPS

--|00500|01:59.0|01:58.9|304.4|29.4|161.5|174.0|08.6

W-|00500|01:59.0|01:59.0|304.4|29.4|161.5|174.0|08.6

R-|00000|00:00.0|00:00.0|000.0|00.0|000.0|174.0|00.0

Workout Details

#-|SDist|-Split-|-SPace-|-Pwr-|SPM-|AvgHR|MaxHR|DPS-

00|00250|00:59.8|01:59.6|304.3|29.7|157.3|170.0|08.4

01|00250|00:59.2|01:58.4|304.5|29.0|165.7|174.0|08.7
For completeness, the SpeedCoach itself reports 1:58.8 time at 29.0 spm and 301W for the “normal” setting, and 1:59.0 at 29.0spm and 306W with the bow-ward setting.
So almost the same total time with a power difference of 1% (5W at most). This is in the order of magnitude that I was expecting, and the question is whether the measurement system is accurate enough to measure such small differences.
But it was fun to do, and I am going to stick with my “normal” setting with the larger catch angles.
By sanderroosendaal • Uncategorized • 1 • Tags: experiment, OTW, rigging, rowing, single